Zhiming Lua,
Fang Pana,
Dong Wangb,
Mario Campanaa,
Hai Xub,
Ian M. Tuckerc,
Jordan T. Petkovcd,
John Webstere and
Jian R. Lu*a
aBiological Physics Laboratory, School of Physics and Astronomy, University of Manchester, Oxford Road, Manchester, M13 9PL, UK. E-mail: j.lu@manchester.ac.uk
bCentre for Bioengineering and Biotechnology, China University of Petroleum (East China), Qingdao 266580, China
cUnilever Research and Development Laboratory, Port Sunlight, Quarry Road East, Bebington, Wirral CH63 2JW, UK
dMenara KLK 1, Jalan Pju 7/6, Mutiara Damansara, 47810 Petaling Jaya, Selangor Darul Ehsan, Malaysia
eISIS Neutron Facility, Science and Technology Facilities Council, Rutherford Appleton Laboratory, Harwell Science and Innovation, Campus, Didcot OX11 0QX, UK
First published on 27th October 2016
Keratins are filament proteins, but we report in this work that water-soluble keratin polypeptides hydrolyzed from wool could readily adsorb onto the surface of water and could thus be used as surface active biomaterials. Neutron reflection measurements with the help of deuterium labelling were used to determine the adsorbed amount and distribution of the polypeptide layers formed. It was found that the interfacial layers were comprised of two main regions, a dense top layer of 18–25 Å and a loose bottom layer of 25–30 Å. Half of the top dense layer was exposed to air with the remainder of the top layer and the diffuse bottom layer immersed in the aqueous solution. Both the volume fraction and the layer thickness increased with keratin solution concentration as did the adsorbed amount which was seen to plateau just above 2 mg m−2 at approximately 0.1 g dm−3 (2.1 μM). Increase in [NaCl] led to reduced surface adsorption, accompanied with the thinning of the top layer. Cryo-TEM imaging revealed that the keratin aggregates had an ellipsoidal structure with radii ranging from 60 Å to 220 Å. The ellipsoidal shape was well supported by SANS, with the major radius of 140 Å and the minor radius of 60 Å. With increasing [NaCl], the ellipsoids became thinner but longer, a feature consistent with the observed trend from surface adsorbed layer. This unusual behaviour could be explained by the electrostatic screening effect. As the salt concentration increased, the polypeptide chains became stiffer and more readily aligned, resulting in thinner layers and longer aggregates.
Most known keratins belong to the type I and type II classes of currently recognized intermediate filament proteins, with their molecular weights spanning from 40 kDa to 70 kDa.9 The type I keratins often have smaller sizes with molecular weights of 40–48 kDa and acidic isoelectric points, and the type II ones are larger with molecular weights of 59–62 kDa and neutral or slightly basic isoelectric points. Human hair or sheep wool contain examples of both these two classes which can be further divided into hard keratins (type Ia and IIa) and soft keratins (type Ib and IIb). Eight major hard keratins containing four type Ia (a1, a2, a3, a4) and four type IIa (b1, b2, b3, b4) have been identified in different species.10 Common to many of the intermediate filament proteins is the highly conserved central alpha-helical domain, which is comprised of four coiled-coil segments and non-helical terminal domains of varying lengths and sequences.11 The acidic and basic soft keratins first interact to form the basic heterodimers and they can then pair up to create tetramers and the polymerisation process goes on to create the final 100 Å filament structures.12 It is widely thought that wool and hair share a similar process in keratin filament formation because of their closely related secondary structures.
Yu et al. have undertaken amino acid sequence comparisons between a human type Ia keratin a3 and other four type Ia hair keratins, including two from sheep and two from mouse. The a3 hair keratin has 404 amino acids, a molecular weight of 45914 Da and an isoelectric point of 5.6, in contrast to the number of amino acids of 412 and the molecular weight of 48
300 Da (including an acetyl group on its N-terminal) from a wool microfilament keratin 8c-1 (ref. 13) and a molecular weight of 47
600 Da from another wool type I microfilament keratin.14 The comparisons show predominant sequence homologies with a small frequency of variations.
Keratin adsorption from aqueous solution could implicate many technological applications, for example, in personal care. To study keratin adsorption at different interfaces, a stable keratin solution is required. An important feature of keratin as compared to other proteins such as collagen and elastin is the existence of a large number of disulphide bonds and hydrophobic amino acids. This makes it difficult to dissolve keratin in most solutions or solvents including water.15 The keratin used in this work was extracted from sheep wool by utilising reducing agents to break the disulphide bonds. This produces keratin which is readily soluble in water. In this extraction process, the reducing agents cause little chemical alteration or damage to the protein.16 Although keratins have previously been rendered water-soluble by a range of approaches, information regarding their adsorption at interfaces and aggregation in solution is required for their use in this field. Of current interest is also the investigation of their interactions with various formulation ingredients such as surfactants. The work reported here presents an initial study of the surface adsorption and solution aggregation of keratin derived from wool using a combination of surface tension measurements, neutron reflection (NR), dynamic light scattering (DLS) and small angle neutron scattering (SANS).
Protein folding and related structural changes in solution have been of interest over recent decades.17–19 Due to difficulties in the measurement of their structural changes experimentally, a combination of techniques is usually required. Various types of nuclear magnetic resonance techniques including nuclear overhauser effect spectroscopy (NOSEY) have provided a wealth of information regarding intra- and inter-molecular structures with a high degree of resolution.20 However, these methods have limitations on the detection of interfacially adsorbed protein layers, particularly at the air/liquid interface. Circular dichroism (CD) determines a protein's secondary structures by detecting the optical polarisation associated with the chiral centres under different environments.21 Fourier transform infrared spectroscopy (FTIR) is also able to reveal secondary structural information at both substrate interface and solution.22 Additional techniques including ellipsometry and dual polarisation interferometry (DPI) are capable of measuring the adsorbed amount of materials at an interface, but it is difficult for them to detect structural changes in the protein layers.22,23
Neutron reflection has been widely used in thin film studies and is one of the most commonly used techniques for the study of the adsorption of surfactants, polymers, proteins, and their mixtures, at different interfaces.24,25 This technique, when used in conjunction with selective deuterium labelling,26 has the unique advantage of allowing for the determination of each individual component in a mixture. A further advantage of neutron reflection is that it allows measurement of both the adsorbed amount and the thickness of the adsorbed layer with angstrom resolution.27,28 Because NR is highly sensitive to the H/D isotopic substitution, simultaneous measurements can be performed by labelling the adsorbing species, or by using H2O, D2O or any of their mixtures to highlight the interface differently. This results in significant improvements in the sensitivity and resolution of the interfacial structures. Whereas NR at an air/water interface provides a useful tool in determining the structural conformations of keratin molecules at the interface, the scattering profile from SANS provides a way to estimate the dimensional conformations of the keratin molecules and possible formation of aggregates. The effect of salt in producing structural changes in the keratin molecules can also be investigated.
Investigation of the molecular weight distribution of the extracted keratin was carried out by SDS polyacrylamide gel electrophoresis (SDS-PAGE), using the Mini-PROTEAN 3 Cell system from Bio-Rad. Stacking gels (6% acrylamide of about 0.75 mm thickness) and resolving gels (12% acrylamide of about 0.75 mm thickness) were prepared according to a standard method described by the Mini-PROTEAN 3 Cell Instruction Manual (run at a constant voltage of 150 V). Keratins were visualized by Coomassie Brilliant blue G 250 stain using a protein marker (Biolabs) for calibration. The molecular weight distribution of extracted wool keratins was observed as two main bands, at approximately 45 kDa (equivalent to type Ia keratins) and 60 kDa (equivalent to type IIa keratins). In addition, several weak bands were observed, corresponding to the low molecular weights at approximately 6–9 kDa and 10–20 kDa, which were attributed to the high-sulphur and high-glycine/tyrosine proteins of the matrix and the low-sulphur intermediate filament proteins. These parameters obtained from the wool keratin extractions are consistent with the results reported previously by other groups.29,30
For ease of data analysis in neutron reflection, it is necessary to use one keratin as a model molecule for the estimate of its scattering length density (SLD) and calculation of the amount of surface adsorption. Table SI1 in ESI† shows how SLD values vary with the ratio of H2O and D2O due to the labile H/D exchanges. An important observation is that the SLD values change little for different proteins in a given solvent such as H2O. This illustrates that although proteins differ in sequence and in their physical and biological properties, all their amino acid compositions tend to be similar.31
![]() | (1) |
![]() | (2) |
Neutron reflectivity profiles are often analysed via the optical matrix method.34 The interfacial region is modelled assuming a finite number of layers, each characterised by a certain thickness (τj) and scattering length density (ρj). The reflectivity is then calculated from the model and compared to the experimental data and the process is iterated until a good fit is obtained. If the adsorbed layer can be modelled by a one-layer fitting, the molecular volume fraction of the protein (φs) in the layer can be calculated from the following equation:35
![]() | (3) |
Vs = Aτφs; | (4) |
![]() | (5) |
The neutron reflection experiments were performed at the ISIS Neutron Facility, Rutherford Appleton Laboratory, Didcot, UK. The reflectometer SURF was used with a white neutron beam wavelength from 0.5 to 6.5 Å. Each reflectivity profile was combined from the measurements taken at three different incidence angles of 0.5°, 0.8° and 1.5° covering a momentum transfer (Q) from 0.015 to 0.5 Å−1. The system was calibrated by measuring a pure D2O profile in order to determine the scale factor. The typical background in null reflecting water (NRW) was 7 × 10⁻⁶ Å−2 and that in D2O was 2 × 10⁻⁶ Å−2. All NR measurements were performed with Teflon troughs in a carrier containing 5 troughs at a time. The neutron beam was defined by two sets of horizontal and vertical slits placed before the sample trough, providing a neutron beam with an illuminated area of some 10 × 3 cm2.
![]() | ||
Fig. 2 Neutron reflectivity (R) measured at the air/NRW interface. (a) The adsorption of keratin at 0.003 (◊), 0.01 (□), 0.03 (△) and 0.3 (○) mg ml−1, with NaCl concentrations kept at 5 mM; (b) the adsorption of keratin at 0.1 mg ml−1. The red dashed line indicates the best uniform layer fit with a thickness of 30 Å and a volume fraction of the protein at 0.6. The green dotted line also shows a uniform layer fit with a thickness of 25 Å and a volume fraction of protein also at 0.6. The continuous line represents the best fit of a two layer model with a top dense layer of 25 Å on the air side and a bottom dilute layer of 30 Å in NRW. The solid lines indicate the optimum two layer fits; (c) NR profiles plotted in the form of R/Ro (where Ro denotes reflectivity from the sharp air/D2O interface) measured from keratin adsorption onto the D2O surface at concentrations of 3 × 10⁻³ (◊), 1 × 10⁻² (□), 3 × 10⁻² (△), 0.3 (○) mg ml−1 in 5 mM NaCl. Solid lines indicate the best fits to the data measured. The original reflectivity profiles are shown in Fig. SI4.† (d) the adsorption of keratin at 0.3 mg ml−1 in NRW in 5 mM NaCl (○) and in 500 mM NaCl (□). The lines indicate the best fits to the data: the thickness of the dense top layer reduces from 25 Å to 19 Å with NaCl being increased from 5 mM to 500 mM. All measurements were performed under a temperature of 25 °C at pH 6.7 ± 0.1. |
An initial fit to the profiles using a one layer fit proved unsatisfactory. An example of this can be seen in the reflectivity profile for 0.1 mg ml−1 as shown in Fig. 2(b). It can be seen that the red (long dashed) line and green (short dashed) line, both of which represent the best one layer fits to the measured profile, and fail to adequately model the data. Introduction of a second layer in the interfacial region with a lower scattering length density produced an improved fit to the data as shown by the continuous line in Fig. 2(b).
The adsorbed interfacial layers were therefore modelled by a dense top layer with thickness increasing from 18 to 25 Å covering a concentration ranging from 0.003 to 0.01 mg ml−1. The corresponding second layers were much looser, extending towards the bulk aqueous phase with a layer thickness in the increasing order ranging from 18 to 26 Å over the same concentration range. The volume fraction of keratin in both the top and bottom layers increased with increasing concentrations, ranging from 0.3 to 0.6 for the dense top layer and 0.05 to 0.11 for the loose bottom layer. The adsorbed amount of keratin increased with increasing protein concentration and reached the highest value of 2.29 mg m−2 at a concentration of 0.1 mg ml−1. Little further increase was observed at the highest concentration of 0.3 mg ml−1 studied. Fig. 2(a) shows the NR profiles at the air/NRW interface with the 4 representative keratin concentrations studied and the continuous lines denote the best 2 layers following the structural features as outlined for the reflectivity data measured at 0.1 mg ml−1 with due adjustments of layer thickness and composition depending on the keratin concentration concerned, with the best fitted parameters shown in Table 1.
[Keratin] mg ml−1 | Layer | Thickness (Å) ±1 | SLD (×10−6 Å−2) ±0.02 | Volume fraction ±0.02 | Layer mass (mg m−2) ±0.03 | Total mass (mg m−2) ±0.04 |
---|---|---|---|---|---|---|
0.003 | 1 | 18 | 0.6 | 0.30 | 0.75 | 0.88 |
2 | 20 | 0.11 | 0.05 | 0.13 | ||
0.01 | 1 | 22 | 1 | 0.50 | 1.53 | 1.81 |
2 | 24 | 0.16 | 0.08 | 0.28 | ||
0.03 | 1 | 24 | 1.06 | 0.53 | 1.76 | 2.06 |
2 | 26 | 0.17 | 0.08 | 0.30 | ||
0.1 | 1 | 25 | 1.1 | 0.55 | 1.90 | 2.29 |
2 | 26 | 0.22 | 0.11 | 0.39 | ||
0.3 | 1 | 25 | 1.1 | 0.55 | 1.90 | 2.29 |
2 | 26 | 0.22 | 0.11 | 0.39 |
In order to reduce the number of fitting parameters involved, the reflectivity profiles were modelled using the layer thickness and adsorbed keratin amount as determined from the corresponding NRW measurements, with the only variable being the extent of the top layer immersion into D2O. The data indicate that the proportion of keratin immersed in the aqueous phase is much greater than that in air. As a result, it was necessary to split the top layer as fitted from the NRW into two separate layers, representing the fraction exposed to air and that immersed in water. The overall interfacial region was therefore described by a three layer model, in which the top layer is exposed to air and the remaining 2 layers are fully immersed into the aqueous phase. The layer exposed to air was found to increase in thickness from 10 to 13 Å as the concentration increased from 3 × 10⁻³ mg ml−1 to 0.03 mg ml−1. No further increase was found as the concentration then increased to 0.3 mg ml−1. For all concentrations studied, approximately half of the top layer was exposed to air and it contained approximately half of the total adsorbed mass. The fitting parameters used are listed in Table 2.
[Keratin] mg ml−1 | Layer | Thickness (Å) ±1 | SLD (×10−6 Å−2) ±0.02 | Volume fraction ±0.02 | Layer mass (mg m−2) ±0.03 | Total mass (mg m−2) ±0.04 |
---|---|---|---|---|---|---|
0.003 | 1 | 10 | 1.1 | 0.3 | 0.42 | 0.92 |
2 | 8 | 5.2 | 0.3 | 0.33 | ||
3 | 25 | 6.15 | 0.05 | 0.17 | ||
0.01 | 1 | 12 | 1.6 | 0.47 | 0.78 | 1.63 |
2 | 10 | 4.8 | 0.49 | 0.68 | ||
3 | 25 | 6.1 | 0.06 | 0.17 | ||
0.03 | 1 | 13 | 1.8 | 0.53 | 0.96 | 2.08 |
2 | 12 | 4.75 | 0.57 | 0.95 | ||
3 | 25 | 6.1 | 0.06 | 0.17 | ||
0.1 | 1 | 13 | 1.9 | 0.56 | 1.02 | 2.25 |
2 | 12 | 4.75 | 0.57 | 0.95 | ||
3 | 30 | 6.1 | 0.07 | 0.29 | ||
0.3 | 1 | 13 | 1.9 | 0.56 | 1.02 | 2.25 |
2 | 12 | 4.75 | 0.57 | 0.95 | ||
3 | 30 | 6.1 | 0.07 | 0.29 |
It is difficult to determine the sizes of the keratin solutions over the concentrations around 0.1 mg ml−1, especially when their sizes vary in the range of 10 to 100 Å. In spite of this limitation, however, a set of DLS measurements was still performed from 0.01 mg ml−1 to 0.3 over 10 concentrations in total. The results (not shown here) indicated that the keratin solution must reach its critical aggregation concentration (CAC) at the concentration below 0.1 mg ml−1, consistent with the trend observed from the surface tension measurements. Taken together, the DLS measurements depict progressive changes in the size and distribution of the keratin aggregates with increasing salt concentration, but at the lowest salt concentration the size distribution did not change much with keratin polypeptide concentration.
![]() | ||
Fig. 4 Unstained, frozen-hydrated keratin polypeptide solutions at 1 mg ml−1 and in 5 mM NaCl (left) and 500 mM NaCl (right) were imaged by cryo-TEM. The dark regions represent keratin aggregates, contrasted against the background of vitreous ice, showing the elongation of the ellipsoidal aggregates with increasing salt concentration. Full images of cryo-EM are shown in Fig. SI2 and SI3 in ESI.† |
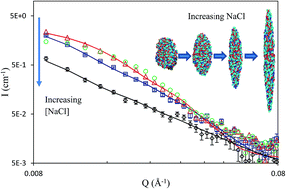
Fig. 5 shows the scattering profiles of keratin solutions at 1 mg ml−1 of keratin concentration but with NaCl concentrations changing from 5 mM to 0.5 M in D2O. It can be seen that increase in salt concentration reduced the scattered intensity gradually, suggesting that the size and shape of the ellipsoidal particles did change with increasing NaCl concentration. Specifically, the scattering profiles changed little over the low NaCl range, with larger reductions in scattering seen when [NaCl] was above 100 mM. The presence of NaCl in protein solution squeezed the ellipsoidal particles, making them thinner and longer with increasing NaCl concentration. The short axial radius remained almost constant up to 100 mM NaCl. Above this concentration, the short axial radius began to decrease. The long axial radius showed a steady increase over the entire salt concentration range studied. In the presence of 500 mM NaCl, the keratin molecules became elongated with a short radius of 36 Å and a long radius of 306 Å, compared to the radii of 58 and 138 Å at 5 mM NaCl. The volume of the keratin aggregates can be calculated using
![]() | (6) |
![]() | (7) |
The volumes of the scattered particles under different NaCl concentrations were calculated using eqn (6) and the results are listed in Table SI4.† Whilst the aggregate shape showed a steady transition with NaCl concentration, the volume peaked around 100 mM NaCl. The volume fractions of keratin in keratin aggregates occupied an almost constant value of 0.6, except at the highest salt concentration of 500 mM, where it reduced to 0.4. Given that the molecular volume of keratin was taken to be approximately 56600 Å3, the molecular number of keratin in an aggregate can be calculated. Over the entire salt concentration range studied, the average number of keratin molecules per micellar aggregate began at 21 at NaCl = 5 mM, peaked at 38 at NaCl = 100 mM and then reduced to 14 at NaCl = 500 mM.
These size and shape changes are also evident from the cryo-EM images shown in Fig. 4. The ellipsoidal model is very sensitive to the short radius and the errors can be controlled well within ±2 Å. In contrast, the long radius has much less sensitivity, hence the fittings within ±10 Å being acceptable. The values of radius b listed in Table SI4† are the minimum values that could produce acceptable fits. Despite these uncertainties, the size and shape transitions as observed must be valid. The geometrical shape changes in the aggregates were also well supported by the DLS data as shown in Fig. 3, where the measured hydrodynamic diameters of the aggregates show substantial variations in the peak values of aggregate size and size distribution.
The NR work carried out explored both the concentration and salt effects of keratin adsorption at the air/water interface, with NRW and D2O contrasts to highlight the layer structure and composition and their extent of immersion in water. All of the reflectivity profiles measured under different conditions revealed a two layer structure for the adsorbed keratin polypeptides: a top dense layer of 18–25 Å with a keratin volume fraction of 0.3–0.55 and a bottom loose layer of 25–30 Å with a keratin volume fraction of 0.05–0.11. The top layer was found to contain 80–85% of the polypeptides with the bottom layer containing the remaining 15–20%. The parallel measurements in D2O revealed that almost half of the top layer was exposed to air and that this exposed region also contained almost half of the adsorbed polypeptides. Fig. SI6† shows the total surface adsorbed amount as a function of keratin concentration. It can be seen that the adsorption plateaued upon approaching 0.1 mg ml−1, which is consistent with the detection of aggregation by both DLS and SANS measurements around this concentration.
It is also evident from Fig. 2(d) that increase in salt concentration caused reduction in the surface adsorption. However, the main part that contributed to the reduction of the adsorbed amount was the top dense layer, whereas the bottom loose layer remained broadly the same. The loss of the adsorbed polypeptides on the air side implied that the addition of salt caused them to become more hydrophilic, possibly through charge association or binding. However, the basic feature of a dense top layer and a loose bottom layer still remained. This feature of adsorbed protein layers has also been observed using human lactoferrin38 and human serum albumin (HSA) and bovine serum albumin (BSA) by NR,24 although it was thought that the adsorption of the albumins did not lead to any major structural unfolding.
The effect of salt concentration on the aggregation of keratin polypeptides was then studied by DLS. At the low NaCl concentration of 5 mM the hydrodynamic diameters were peaked around 200 Å. Increases in salt concentration above 100 mM led to the average diameters centering around 300 Å. The SANS work revealed an ellipsoidal shape of the aggregates with a short radius of approximately 60 Å and a long radius of approximately 140 Å under 5 mM NaCl. Increase in the ionic strength of the keratin solution was found to change the radii of the ellipsoids formed. It was found that the keratin molecules were stretched into thinner, longer ellipsoid shape with increasing salt concentration.
These size and shape changes of the aggregates appear to be highly unusual, but the trend is broadly consistent with the thinning of the adsorbed layers. Thus, the SANS and NR results were broadly consistent in that the addition of salt made the polypeptides stiffer, resulting in the formation of thinner layers and thinner but longer aggregates. The reduced aggregate size and adsorbed amount might also imply that the polypeptides became more hydrophilic.
The effects of ions on the conformation of polyelectrolytes has been explored quite extensively.39 With reference to the interfacial adsorption and formation of films of synthetic polyelectrolytes by McAloney et al.40 and Dubas et al.41 we can explain the observations as described in the work by electrostatic screening. The differences between the adsorbed layers and size and shape transitions of micellar aggregates formed under different salt concentrations could be accounted for by considering a conformational transition in the bulk polyelectrolyte solution, leading to a changed effective persistence length and chain stiffening. Unlike synthetic polymers, however, the keratin polypeptides used in this work contained several polypeptide chains, each bearing both positively and negatively charged amino acid groups. These oppositely charged groups could well work to promote the binding and association between neighbouring polypeptide chains, leading to the ion concentration induced transitions similar to the film features as observed by McAloney et al.40 Fig. 6 provides a schematic representation of the surface adsorbed layer and solution aggregation. It also depicts how the main features of surface adsorbed layers and solution aggregates formed change in response to the salt concentration increase.
![]() | ||
Fig. 6 Schematic diagrams to show changes of the keratin distributions at the air/water interface and in bulk solution when the salt concentration was increased from 5 to 500 mM. |
Footnote |
† Electronic supplementary information (ESI) available. See DOI: 10.1039/c6ra15817j |
This journal is © The Royal Society of Chemistry 2016 |