DOI:
10.1039/C6RA15791B
(Paper)
RSC Adv., 2016,
6, 110884-110897
Growth, physicochemical and quantum chemical investigations on 2-amino 5-chloropyridinium 4-carboxybutanoate – an organic crystal for biological and optoelectronic device applications†
Received
17th June 2016
, Accepted 30th October 2016
First published on 7th November 2016
Abstract
Optically transparent organic single crystals of 2-amino 5-chloropyridinium 4-carboxybutanoate (2A5C4C) with sizes of 7 × 4 × 2 mm3 were grown by a slow evaporation solution growth technique at room temperature using methanol solvent. The lattice parameter values of the crystals were evaluated by single crystal XRD; the results confirmed that 2A5C4C crystal belongs to the orthorhombic system with cell parameters of a = 5.1858 Å, b = 14.501 Å and c = 15.963 Å. The crystalline phases and quality of the grown crystals were ascertained by powder XRD and high resolution XRD (HRXRD) studies, respectively. The crystal structure and various functional groups present in 2A5C4C were confirmed by 1H, 13C NMR and FTIR analysis. The optical absorption, transmittance and lower cutoff wavelength were identified by UV-Vis-NIR studies. The optical band gap was estimated from the Tauc plot and was found to be about 3.68 eV. The charge transport mechanism and photoconducting nature of 2A5C4C were analyzed using dielectric and photoconductivity studies, and the obtained results were compared with previously reported values. In order to analyze the thermal and mechanical stability properties of the 2A5C4C crystal, TG/DTA and Vickers microhardness studies were performed. The laser-induced surface damage threshold values for the grown crystal were measured using a Nd:YAG laser. Powder SHG analysis was also carried out for powder samples using the Kurtz and Perry powder second harmonic generation (SHG) technique; the results were compared with KDP as a reference. The theoretical molecular electrostatic potential, HOMO–LUMO, natural bonding orbital analysis (NBO) and first hyperpolarizability values of the 2A5C4C molecule were calculated and discussed in detail. Moreover, the hydrogen bonded charge transfer crystal was screened for its pharmacological antioxidant activity against 2,2-diphenyl-1-picrylhydrazyl (DPPH) and hydrogen peroxide (H2O2) radicals.
1 Introduction
In recent years, the demand for optically active organic crystals has increased due to their useful applications, such as electro-optic modulators, optical storage devices, terahertz wave generation and detection, laser fusion reactions, optical signal processing, color displays, frequency conversion, photonics, laser remote sensing and medical diagnostics.1–6 The electronic susceptibilities (χe) of organic NLO materials are several orders of magnitude higher than those of inorganic materials. Furthermore, organic materials have higher molecular polarizability (β) and higher laser damage thresholds; also, they demonstrate ease of device fabrication and flexibility of molecular design via proper synthetic methods.7–9 Also, these organic NLO crystals are constituted by weak van der Waals and hydrogen bonds with conjugated electrons. Polar and chiral organic molecules with π-electron conjugated moieties substituted by an electron donor group on one end of the conjugated structure and an electron acceptor group on the other end have increased asymmetric electronic distribution in both the ground and excited states; thus, their second order polarizability is increased.10–15 Hence, these molecules are expected to be leading candidates for fundamental and applied investigations. 2-Amino 5-chloropyridine is one such π-donor–acceptor molecular compound; it can receive a donated proton (H+) from glutaric acid. Hence, the asymmetric system consists of protonated 2-amino 5-chloropyridine mono-ionised with glutaric acid. Previously, Hemamalini and Fun reported the crystal structure of 2A5C4C.16 A detailed literature survey shows that no significant studies are available for this material.
Based on these facts, in this manuscript, we have studied the powder X-ray diffraction, HRXRD, NMR, FTIR, optical transmittance, thermal, dielectric, photoconductivity, mechanical, laser damage threshold, powder SHG and antioxidant properties of 2A5C4C. In addition to these studies, molecular electrostatic potential (MEP), frontier molecular orbital (FMO), natural bonding and theoretical first hyperpolarizability analyses were performed using the density functional theory (DFT) method; these have not been reported in the literature to our knowledge.
2 Experimental details
2.1 Solubility and metastable zone width studies
The solubility and metastable zone width plot determine optimal growth and improvement in crystallization procedures. The solubility of any material in a given solvent affects nucleation and the availability of the solute substance during the growth process; it also determines the cooling rate.17 Supersaturation is a driving force for growing better quality crystals; it also has an effect on the quality of the crystals. The solubility of a substance should be moderate to grow better quality single crystals. Also, to encourage spontaneous nucleation, the solute must remain in solution until an elevated level of supersaturation has been reached. The solubility of the title compound was measured in methanol as a function of temperature between 25 °C and 45 °C in steps of 5 °C. The saturated solution was prepared in a well-controlled thermal environment. The excess solute was magnetically stirred and equilibrated for nearly 5 h before each sample was acquired. The solubility was then measured gravimetrically. The filtered saturated solution was preheated to 5 °C above the saturation temperature for homogenization and maintained at the superheated temperature for 2 h before cooling. The equilibrium-saturated solution was cooled from the overheated temperature, with a cooling rate of 2 °C h−1, until the first visible crystal was observed. The difference between the saturated temperature and the nucleation temperature was taken to be the metastable zone width of the system.18 The solubility and nucleation curves were fitted with linear equations; the values were found to be 0.69 and 0.86, respectively. Fig. 1 represents the variations in solubility and metastable zone width at various temperatures. The solubility increases almost linearly with temperature. Therefore, slow evaporation or slow cooling solution growth may be superior methods to grow good quality crystals of the title compound.
 |
| | Fig. 1 Solubility and metastable zone width studies of 2A5C4C in methanol. | |
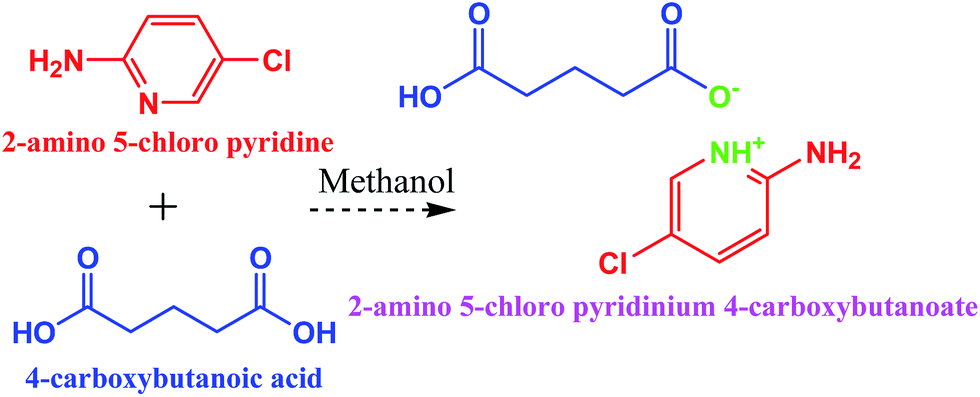
2.2 Synthesis and growth
Analytical grade 2-amino 5-chloropyridine and glutaric acid were purchased from Sigma Aldrich and were used without any further purification. The methanol used as solvent was HPLC grade. The slow evaporation solution growth method was used to grow single crystals of the title compound at room temperature. The title compound was prepared by adding one mole of 2-amino 5-chloropyridine (C5H5ClN2) and one mole of glutaric acid (C5H8O4) to methanol solvent (Scheme 1). The two solutions were mixed together and stirred well using a mechanical stirrer at ambient temperature with a stirring rate of 200 rpm for about 5 hours to obtain a homogeneous solution; the resulting solution was filtered through Whatmann 41 filter paper. In order to prevent rapid evaporation of the solvent, the beaker containing the filtrate was covered with a thin polythene sheet. Care was taken to minimize the temperature gradient and mechanical shaking. The filtrate was maintained in a dust-free environment for the crystallization process. The crystals of the title compound were harvested by the slow evaporation technique at room temperature. The crystallization occurred within 10 days with an average dimension of 7 × 4 × 2 mm3. The crystal morphology and the as-grown crystals are shown in Fig. 2(a) and (b).
 |
| | Scheme 1 Reaction scheme of 2A5C4C with methanol as the solvent. | |
 |
| | Fig. 2 (a) BDFH morphology diagram of single crystal 2A5C4C with the major facet of (011) obtained by Mercury software using the CIF file of the BCS crystal structure as input. (b) As-grown crystal of 2A5C4C (7 × 4 × 2 mm3). | |
2.3 Characterization techniques
2.3.1 Physiochemical characterization. The single crystal X-ray diffraction data of the title compound were collected at 293 K with graphite-monochromated MoKα radiation (λ = 0.071073 nm) using an Enraf-Nonius CAD-4 diffractometer in ω–2θ scan mode. The crystals were finely crushed into polycrystalline powders using an agate mortar and pestle and were subjected to powder XRD analysis. Studies were carried out using a RICH SIEFERT X-ray powder diffractometer using CuKα (λ = 1.5405 Å) radiation. The sample was scanned over the 2θ range of 5 to 60° at a rate of 2° min−1. The crystallinity of the 2A5C4C single crystals grown by the solution growth technique was characterized by high resolution X-ray diffraction (HRXRD). A well-collimated and monochromated MoKα1 beam obtained from three monochromator Si crystals set in the dispersive (+, −, −) configuration was used as the exploring X-ray beam. The specimen crystal was aligned in the (+, −, −, +) configuration. In order to confirm the chemical structure of the 2A5C4C crystal, 1H NMR and 13C NMR spectra were recorded employing a Bruker 500 MHz spectrometer in deuterated solvent, using DMSO (dimethyl sulfoxide-d6) as the internal reference standard. In the present work, the functional groups of 2A5C4C were identified using a JASCO-FT-IR 5300 infrared spectrometer in the frequency region of 400 to 4000 cm−1 by employing the KBr pellet technique with a spectral resolution of 4.0 cm−1. The optical transmittance and absorption spectra of the grown 2A5C4C crystals with 1.502 mm thickness were recorded at room temperature using a Perkin-Elmer Lambda 35 spectrophotometer in the wavelength region of 200 to 1100 nm. TG-DTA analysis was carried out using a Simultaneous Thermal Analyzer (SDT Q600 V 8.3 Build 101) in nitrogen atmosphere with a heating rate of 2 °C min−1 in the temperature range of 35 °C to 500 °C. Etching studies for the grown 2A5C4C crystals were carried out using an OLYMPUS U-TV0.5XC-3 optical microscope in reflection mode. Dielectric studies were carried out in the frequency range from 50 Hz to 5 MHz at different temperatures using a Hioki LCR 3532-50 LCR meter. Photoconductivity measurements for the grown 2A5C4C crystals were taken using a Keithley electrometer (Model 6517B). Microhardness studies for the grown 2A5C4C crystals were carried out using a LEITZ WETZLAR Vickers microhardness pyramidal indenter attached to an incident light microscope. A Q-switched Nd:YAG laser with a fundamental wavelength of 1064 nm was used to study both the laser damage threshold and the powder SHG efficiency.
2.3.2 Computational studies. The theoretical quantum chemical studies were performed using the DFT [B3LYP (Becke's three-parameter (B3) exchange in conjunction with Lee–Yang–Parr's (LYP) correlation functional) method with the B3LYP/6-311++G(d,p) basis set using the Gaussian 09 program.19–21 The molecular structure of 2A5C4C was optimized from the crystallographic information file (CIF) as the source, and all calculations were computed for this optimized structure only. The GaussView 5.0 visualization program was employed to shape the HOMO and LUMO orbitals.22
2.3.3 Antioxidant characterizations. The 2,2-diphenyl-2-picryl-hydrazyl (DPPH) radical scavenging activity of the compound was measured according to the method of Elizabeth and Rao.23 The DPPH radical is a stable free radical with a λmax at 517 nm. A fixed concentration of the experimental compound (100 μL) was added to a solution of DPPH in methanol (0.3 mM, 1 mL), and the final volume was made up to 4 mL with double distilled water. DPPH solution with methanol was used as a positive control, and methanol alone acted as a blank. The solution was incubated at 37 °C for 30 min in the dark. The decrease in the absorbance of DPPH was measured at 517 nm.A 2.0 mM solution of H2O2 was prepared in phosphate buffer (0.2 M, pH = 7.4). Different concentrations of the synthesized compound, curcumin and ascorbic acid (10 μg mL−1, 25 μg mL−1, 50 μg mL−1, 100 μg mL−1 and 200 μg mL−1) were added to the hydrogen peroxide solution (0.6 mL) in phosphate buffer. The total solution was made up to 4 mL with phosphate buffer. The same solution without the compound was taken as a negative control. The absorption of hydrogen peroxide was recorded at 230 nm, and the phosphate buffer was taken as a blank. The percentage inhibition was calculated by the following relation. For each of the above assays, the tests were observed in triplicate by varying the concentration. The percentage inhibition of absorbance was calculated and plotted as a function of the concentrations of the standard and sample to determine the antioxidant concentration. The percentage activity was calculated using the formula % activity = [(Ao − Ac)/Ao] × 100, where Ao and Ac represent the absorbance in the absence and presence of the test compound, respectively. Ascorbic acid was used as a standard for all the above assays.
3 Results and discussion
3.1 X-ray diffraction studies
The obtained unit cell parameters are a = 5.1858 Å, b = 14.501 Å, c = 15.963 Å, α = β = γ = 90° and V = 1200.40 Å3. From the single crystal XRD results, it can be concluded that the grown 2A5C4C crystal belongs to the orthorhombic crystal system with the noncentro symmetric space group of P212121. The lattice parameters obtained in the present study are in good agreement with earlier reported work.16 From the powder X-ray diffraction data, various planes (hkl) of reflections were indexed using Mercury software.24 The indexed experimental powder X-ray diffraction pattern was compared with the XRD pattern simulated by Mercury software; the patterns were found to be in good agreement. The 2A5C4C crystals have a well-developed morphology with several habit faces. The simulated and experimental PXRD patterns are shown in Fig. 3(a) and (b). The spiky peaks on a specific 2θ angle confirm the crystalline nature of the sample. The pattern shows that there is no solvent incorporation in methanol-grown 2A5C4C single crystals.
 |
| | Fig. 3 Powder XRD spectrum of 2A5C4C. (a) Simulated pattern (blue line/upper pattern) using single crystal X-ray refinement data of 2A6MPNN. (b) Observed powder X-ray diffraction pattern (red line/lower pattern). All peaks were indexed; the indexed experimental powder X-ray diffraction pattern peaks were compared with the simulated XRD pattern, and they were found to be in good agreement. | |
3.2 HRXRD analysis
The high resolution X-ray diffraction curve recorded for the (011) diffraction plane of the 2A5C4C crystal is depicted in Fig. 4. As seen in the figure, the DC contains a single sharp peak; this indicates that the specimen is free from structural grain boundaries. The full width at half maximum (FWHM) of the curve is 22 arc s, which is slightly greater than that expected from the plane wave theory of dynamical X-ray diffraction for an ideally perfect crystal but close to that expected for nearly perfect real life crystals.25 It is interesting to see the asymmetry of the DC. For a particular angular deviation (Δθ) of the glancing angle with respect to the peak position, the scattered intensity is much greater in the negative direction than in the positive direction. This feature clearly indicates that the crystal predominantly contains vacancy defects rather than interstitial defects.
 |
| | Fig. 4 HRXRD curve of 2A5C4C crystal. | |
3.3 NMR studies
Nuclear magnetic resonance (NMR) is a versatile technique that is employed to identify molecular structures. The 1H NMR and 13C NMR spectra of 2A5C4C were recorded using deuterated DMSO as the solvent and TMS as an internal standard reference. The recorded 1H and 13C NMR spectra are shown in ESI Fig. 1 and 2,† respectively, and the chemical shifts are given in ESI Table S1.† In the 1H NMR spectrum, the appearance of six distinct proton signals confirms the presence of different proton environments in the studied crystal. The 1H NMR spectrum of 2A5C4C shows the presence of C3 protons as a multiplet at 1.74 to 1.65 ppm (J3,4 = 10 Hz), and one triplet appeared in the region of 2.26 to 2.21 ppm (C2, C5, J1,2 = 10 Hz). The NH2 signal appeared as a singlet at 6.14 ppm. The aromatic proton peaks are observed in the regions of 6.46 to 6.43 ppm (C8, d, J = 11.6 Hz) and 7.42 to 7.39 ppm (C9,11, m, J = 8.4 Hz). The aliphatic carboxylic acid proton appeared as a singlet at 7.88 to 7.87 ppm.
The appearance of eight distinct carbon peaks in the spectrum explicitly confirms the molecular structure of the salt. The downfield carbon signal at 174.6 ppm is due to the highly deshielded carbonyl carbon of the butanoic moiety. The signal at 159.0 ppm is due to the C7 carbon of the pyridinium moiety. The chemical shift value at 139.2 ppm indicates the presence of the C10 carbon atom. The signals appearing at 137.2 ppm, 117.7 ppm and 109.8 ppm are attributed to the C9, C11 and C8 carbons of the pyridinium moiety, respectively. The signal at 33.3 ppm is attributed to the similar C2 and C4 aliphatic carbon atoms. The sharp and intense peak at 20.5 ppm is due to the C3 carbon atom of the butanoic moiety. From the above results, we can confirm the structure of the crystallized compound.
3.4 FTIR studies
The vibrational spectrum of 2A5C4C is shown in Fig. 5. In the spectrum, the bands at 3792 and 3730 cm−1 are attributed to the NH2 asymmetric and symmetric stretching vibrations. The peak at 3005 cm−1 is assigned to the C–H stretching vibration. The stretching modes of OH vibration occurred at 2811, 2760 and 2499 cm−1, respectively. The peaks appearing at 1959 and 2027 cm−1 are due to the C–N stretching vibration. The asymmetric and symmetric stretching modes of the NO2 group are revealed by peaks at 1514, 1387 and 1335 cm−1. The NO2 in plane and out of plane deformation vibrations were observed at 431, 512, 675 and 712 cm−1. The band combination and overtone of the NH group are observed at 1951 cm−1. The NH bending vibration occurs at 1669 cm−1. The bands at 1597 and 1243 cm−1 are due to the NO and C–O stretching vibrations and the peak at 1448 is due to the C![[double bond, length as m-dash]](https://www.rsc.org/images/entities/char_e001.gif) C stretching vibration. The bands at 1176 and 757 cm−1 are attributed to CH wagging and the CH out of plane bending vibration. The in plane bending vibration of the CH group absorbs at frequencies of 977 and 1026 cm−1. The occurrence of NH wagging absorption is evident at 878 and 931 cm−1. The peak at 1101 cm−1 is assigned to the NH2 rocking vibration. The peaks at 662 and 636 cm−1 are characteristic of the out of plane bending vibrations of the aromatic ring. The CH2 rocking vibration is observed at 829 cm−1. Thus, the presence of functional groups was confirmed.
C stretching vibration. The bands at 1176 and 757 cm−1 are attributed to CH wagging and the CH out of plane bending vibration. The in plane bending vibration of the CH group absorbs at frequencies of 977 and 1026 cm−1. The occurrence of NH wagging absorption is evident at 878 and 931 cm−1. The peak at 1101 cm−1 is assigned to the NH2 rocking vibration. The peaks at 662 and 636 cm−1 are characteristic of the out of plane bending vibrations of the aromatic ring. The CH2 rocking vibration is observed at 829 cm−1. Thus, the presence of functional groups was confirmed.
 |
| | Fig. 5 FTIR spectrum of 2A5C4C. | |
3.5 UV-vis spectral studies
Optical absorption, transparency and cutoff wavelength bands are important optical parameters for laser frequency conversion applications. For device fabrication, the crystal should be transparent over a considerable region of wavelength. In the present investigation, the crystal exhibits a lower cutoff wavelength at 348 nm; also, the grown 2A5C4C crystal is transparent in the entire visible region, which enables it to be a potential candidate for NLO device applications (Fig. 6a). The higher optical transmission in solution-grown 2A5C4C crystal may be due to fewer defects and the absence of inclusions, which in turn reduces scattering in the 2A5C4C crystal and increases its output intensity.26 Also, in the absorption spectrum, the crystal shows two peaks at 237 nm and 310 nm; these are attributed to the n–π* and π–π* transitions (Fig. 6b). This is assigned to the charge transfer and aromatic conjugation. The charge transfer transition is due to the promotion of an electron from the highest occupied molecular orbital (HOMO) of the donor to the lowest unoccupied molecular orbital (LUMO) of the acceptor. The absence of absorption and transmittance in the visible region makes the crystal suitable for photonic and optical applications. The band structure and transition of electrons were studied by means of the dependence of the optical absorption coefficient on the photon energy. The optical absorption co-efficient (α) of the grown crystal was obtained from the following relation:27| |
 | (1) |
where d is the thickness of the crystal and T is the transmittance. The absorption co-efficient (α) of 2A5C4C was determined using the following relation:where A is a constant, h is Planck's constant and ν is the frequency of incident photons. The above equation is highly suitable to determine the allowed direct transition between simple parabolic bands. According to the Tauc plot,28 the optical band gap was evaluated by extrapolating the linear plots of (αhv)1/2 and hv, as shown in Fig. 6c. The evaluated band gap is 3.68 eV. As indicated by the wide band gap, the grown crystal possesses large transmittance and a high laser damage threshold. Also, this high bandgap value shows that the crystal has dielectric behavior to induce polarization when powerful radiation is incident on the material.29
 |
| | Fig. 6 (a) Optical transmittance spectrum of 2A5C4C. (b) Absorption spectrum of 2A5C4C, revealing peaks at 237 nm and 310 nm due to the n–π* and π–π* transitions. (c) The optical band gap spectrum of 2A5C4C (3.68 eV). | |
3.6 Thermal studies
To study the thermal stability, decomposition and melting point of 2A5C4C, the grown crystals were subjected to TG/DTA analysis. The TG/DTA traces of 2A5C4C are depicted in Fig. 7. From the graph, it can be observed that the thermal decomposition of 2A5C4C occurs in three stages. Below 100 °C, there is no weight loss; hence, the crystal does not contain any lattice-entrapped water. In the TG trace, the first weight loss of 4.15% was observed at 120 °C. In the DTA trace, there is a sharp endothermic peak at 119 °C; this is assigned to the melting point of the compound and merely coincides with the TG result. The sharpness of this endothermic peak confirms the crystallinity and purity of the sample. This ensures the suitability of the crystal for laser applications, where the crystals must withstand high temperatures. The second and third stages of mass loss occurred between the temperature ranges of 173 °C to 252 °C and 252 °C to 500 °C. The mass losses at these stages are 32.50% and 63.69%. The second and third stages of mass losses are ascribed to the release of volatile substances, probably CO2, CO, NH3, CH2 molecules, CH of carboxylic acid, and pyridine fragments. Finally, a small amount of carbon is present in the residue. From the TG/DTA results, it can be concluded that the grown 2A5C4C crystals can be utilized for optoelectronic device applications up to 119 °C.
 |
| | Fig. 7 TG/DTA spectra of 2A5C4C recorded between 30 °C and 500 °C; the sharp endothermic DTA peak at 119 °C corresponds to the melting point of the sample. | |
3.7 Etching studies
Some important features of crystal surfaces, such as growth hillocks, spirals and grain boundaries, are essential to study the micro-structural imperfections of crystals. Etching is an important tool for the identification of crystal defects. In the present investigation, ethanol was used as an etchant. Fig. 8a–c show the etch pit patterns observed on the flat crystal face (011) of 2A5C4C with etching times of 3 s, 8 s and 10 s, respectively. The patterns reveal nucleation and three-dimensional growth in a step by step process. Well-defined, oriented stepped triangular etch patterns are formed at the dislocation sites. The above study supports a three-dimensional nucleation (3D) mechanism with low dislocation in the 2A5C4C crystal.
 |
| | Fig. 8 Etching patterns of 2A5C4C recorded at different times: (a–c) 3 s, 8 s and 10 s, respectively. | |
3.8 Dielectric constant and dielectric loss studies
The dielectric properties of materials are basic electrical properties that are directly interconnected with the electro-optic properties of crystals.30 They provide valuable information about the structural behaviour, defect behaviour and polarization mechanism of crystals. Currently, the microelectronics industry requires low dielectric constant materials for use as interlayer dielectrics (ILDs), which decrease RC delay, lower power consumption and reduce crosstalk between nearby interconnects.31,32 When comparing polycrystalline materials, single crystalline materials have low dielectric losses and good chemical homogeneity. Dielectric measurements were performed while cooling a sample of the 2A5C4C crystal. The dielectric constant of the crystal was calculated from the measured capacitance using the given formula:| |
 | (3) |
where C is the capacitance, d is the thickness of the sample, A is the cross-sectional area of the crystal and εo is the free space permittivity (8.854 × 10⁻¹² F m−1). Fig. 9a and b illustrate the dielectric constant and dielectric loss as a function of frequency for 2A5C4C crystal. The dielectric constant and dielectric loss increase at a lower frequency and attain a constant value at a higher frequency. The magnitude of the dielectric constant is a measure of the electrostatic binding strength between ions. The εr and ε′′ values are found to decrease with increasing frequency at all temperatures. This is considered to be normal dielectric behaviour. It can be elucidated on the basis of the polarization mechanism, which is similar to that of the conduction process. The electronic exchange of the number of ions in the crystal gives a local displacement of electrons in the direction of the applied field, which in turn gives rise to polarization. The higher value of εr at a lower frequency may be due to the existence of all four polarizations, namely, space charge, orientation, electronic and ionic polarization; the low value at higher frequencies is due to the progressive loss of significance of the polarizations.33,34 At higher frequencies, dipoles cannot follow the applied field; thus, the polarization decreases and the values of the dielectric constant are reduced. The variation of εr with temperature is due to the thermally generated charge carriers and impurity dipoles.35
 |
| | Fig. 9 (a) Dielectric constant vs. log![[thin space (1/6-em)]](https://www.rsc.org/images/entities/char_2009.gif) f. (b) Dielectric loss vs. logf. f. (b) Dielectric loss vs. logf. | |
It was observed that the εr of the 2A5C4C crystal is 9.4 at 343 K. This is lower than that of some pyridine derivatives and other well-known photonic crystals, such as 2-aminomethylpyridinium picrate (εr ≈ 38),36 4-aminopyridinium p-aminobenzoate dihydrate (εr ≈ 420),37 and dimethyl amino pyridinium 4-nitrophenolate (εr ≈ 1180),32 and considerably lower than some inorganic electro-optic crystals, such as LiNbO3 (εr ≈ 85)38 and KNbO3 (εr ≈ 154).39 These comparisons suggest that 2A5C4C is a low dielectric constant material and could be a suitable candidate for electro-optic, photonic and microelectronic device applications, where a faster response is required. According to the Miller rule, lower dielectric constant values at higher frequencies are suitable parameters for improvement of the SHG coefficient.33 The low value of dielectric loss at higher frequencies suggests that the 2A5C4C crystal possesses fewer defects and good quality.
3.9 Photoconductivity
Photoconductivity forms the basis of photoresistors, sensors, memories and other devices. Photoconducting materials should be capable of converting the low energy content of sub picosecond laser pulses to electric pulses of relatively high amplitude.40 Dark current (Id) and photocurrent (Ip) measurements of these crystals were carried out by a two probe technique at room temperature. Polished crystals 3 × 3 × 1.5 mm3 in size were selected, and electrodes of two thin copper wires were fixed onto the crystal surface at some distance apart using electronic grade silver paste. A DC power supply, a Keithley electrometer and the prepared sample were connected in series. For dark current measurements, the sample was sheltered from all radiation and the input of applied voltage was increased from 20 V to 200 V in steps of 10 V. The corresponding dark current was recorded. For photocurrent measurements, illumination from a 100 W halogen lamp containing iodine vapour and a tungsten filament was used. Fig. 10 depicts the dark current (Id) and photocurrent (Ip) responses of the 2A5C4C crystal.
 |
| | Fig. 10 Photoconductivity response of the 2A5C4C crystal to applied voltage, showing an increase in current with respect to illumination; this confirms its positive photoconducting nature. | |
From the figure, it is evident that the dark current and photocurrent are linear with applied input voltage; also, the photocurrent is higher than the dark current, which is termed as positive photoconductivity. This can be attributed to the generation of mobile charge carriers caused by the absorption of photons.41 When the material is illuminated with photons of energy E > Eg, where Eg is the band gap energy, electron–hole pairs are generated and the conductivity of the material increases. Also, a high value of photocurrent is due to a lack of traps and the population of an intrinsic centre formed by direct excitation of charge carriers in the crystal.42 As the crystal possesses a high band gap for photon absorption, it can be used for soliton wave communication, where optical pulses propagate within the photonic band gap for large distances without any distortion. Similar results have been found in investigations of promising NLO materials, such as strontium niobate, NPNa, and NPLi.43
3.10 Mechanical studies
Microhardness is an essential solid state property for understanding the mechanical properties of a crystal. Also, it plays a vital role in NLO device fabrication. Transparent polished crystals with crack-free surfaces (crack-free) were selected for the microhardness investigation. The grown 2A5C4C crystal was properly mounted on the base of a microscope, and indentations were made on the surface of the crystal by varying the applied load from 25 g to 100 g. In the current study, all the measurements were performed at room temperature with a constant indentation time of 10 s. Several indentations were made for all loads, and the average value of the diagonal length was used to calculate the Vickers microhardness number. The Vickers microhardness number was calculated using the given expression:| | |
HV = 1.8554(P/d2) (kg mm−1)2
| (4) |
where P is the applied load in g, d is the diagonal length of the indented impression (μm) and 1.8554 is a constant of a geometrical factor for the diamond pyramid. Fig. 11 shows the variation of HV as a function of the applied field. It is very clear from the figure that the hardness value increases with increasing load and that the crystal exhibits the reverse indentation size effect (RISE). High mechanical strength has important effects on NLO device fabrication and processing, such as ease of polishing and less wastage due to cracking/breakage during polishing.44 As the load was further increased above 100 g, microcracks were observed, owing to the release of internal stress generated locally by deformations.
 |
| | Fig. 11 Hardness number vs. applied load for 2A5C4C. The plot exhibits the reverse indentation size effect. | |
3.11 Laser damage threshold measurements
Nonlinear optical single crystal frequency conversion not only depends on the linear and nonlinear optical properties of the crystal but also on the intensity of the incident laser and the ability of the crystal to withstand high power laser energy. The laser damage threshold is an important parameter to obtain the maximum second harmonic conversion efficiency in NLO crystals.1 A Q-switched Nd:YAG (1064 nm) laser with a pulse width of 8 ns, a frequency of 10 Hz and a 40 cm focal length was used to measure the laser damage threshold of a 2A5C4C single crystal. For this purpose, the flat (011) plane of a freshly grown 2A5C4C single crystal with typical dimensions of about 5 × 4 × 1.5 mm3 was carefully polished using a silk cloth on which a paste made of fine grade alumina powders dispersed in an ethanol medium was used so that a good surface finish could be obtained. The Nd:YAG laser beam was focused on the flat (011) plane, which was gradually moved horizontally or vertically by a distance of about 250 μm between each point of focusing, and the energy of the laser beam was increased gradually by 50 mJ for every exposure. The laser damage threshold of the grown crystals was evaluated by the diameter of the spot and the beam energy when the damage occurred, using the following equation:| |
 | (5) |
where E is the pulse energy of the laser, τ is its pulse width, and A is the focus area of the laser spot. The single-shot and magnified damage profile of the 2A5C4C crystal is presented in Fig. 12; this image reveals the nature of the damage and its possible origin. The damage pattern of 2A5C4C exhibited uneven cracks resulting from anisotropic thermal expansion of the crystal. The laser damage threshold of the 2A5C4C crystal was calculated to be about 2.88 GW cm−2 when it was measured using a pulsed laser with single shots.
 |
| | Fig. 12 Micrograph of the laser-induced damage pattern of single crystal 2A5C4C. The evaluated surface laser damage threshold of single 2A5C4C crystal using a pulsed laser with single shots is about 2.88 GW cm−2. | |
3.12 Powder SHG studies
The powder SHG efficiency of the powdered 2A5C4C material was tested using the modified Kurtz and Perry technique.45 A Q switched mode locked Nd:YAG laser beam with a wavelength of 1064 nm was used as an optical source for the SHG measurements. An input power of 4 mJ per pulse, a pulse width of 8 ns and a repetition rate of 10 Hz were used. The grown 2A5C4C crystal was ground into uniformly sized particles of 125 to 150 μm and packed in a microcapillary tube of about 1.8 mm. The same particle size of microcrystalline KDP was used as a reference for SHG measurements. The SHG behaviour of 2A5C4C was confirmed from the emission of green radiation (532 nm). The green intensity was measured using a photomultiplier tube (Hamamatsu R5109), transformed into electrical signals, and displayed on a storage oscilloscope. The comparison of the powder second harmonic generation efficiency of 2A5C4C with that of KDP is depicted in Fig. 13a. From the figure, it can be concluded that the SHG efficiency of 2A5C4C is 4.34 times higher than that of the reference KDP. The SHG efficiencies of crystals of different sizes (45 to 210 μm) were measured. Fig. 13b shows the variation between the average particle sizes and the second harmonic output values. From the figure, it can be seen that the SHG output increases with increasing particle size; beyond a certain size, the upper limit value is attained. This reflects the attainment of the maximum output value of the crystallites. In the case of phase-matchable materials, it is noted that beyond the coherence length (lc), the output efficiency reaches its limiting value. In this region, i.e. ![[r with combining circumflex]](https://www.rsc.org/images/entities/i_char_0072_0302.gif) ≫ lc, the phase matchable materials attain their maximum second harmonic intensity independent of the particle size.45 This concluded the phase matching ability of the 2A5C4C. The powder SHG efficiency of the 2A5C4C was compared with the previously reported pyridinium based organic NLO materials and is listed in Table 1.
≫ lc, the phase matchable materials attain their maximum second harmonic intensity independent of the particle size.45 This concluded the phase matching ability of the 2A5C4C. The powder SHG efficiency of the 2A5C4C was compared with the previously reported pyridinium based organic NLO materials and is listed in Table 1.
 |
| | Fig. 13 (a) Comparison of the powder SHG output spectra of 2A5C4C and KDP. The output of 2A5C4C is 4.34 times greater than that of the KDP sample. (b) Plot of the average particle size vs. the second harmonic output values. | |
Table 1 Comparison of SHG efficiencies of 2A5C4C
| Material |
SHG efficiency (reference: KDP) |
| 2-Amino-4-picolinium 4-aminobenzoate46 |
3.73 |
| Dimethylpyridinium 4-nitrophenolate 4-nitrophenol47 |
15 |
| 2-Aminopyridinium 4-methylbenzoate dihydrate48 |
3.03 |
| 2-Aminopyridinium benzoate49 |
1.8 |
| 2A5C4C (present work) |
4.34 |
3.13 Optimized geometry
The optimized geometry of the molecular structure of the title compound (2A5C4C) with an atomic numbering scheme is shown in ESI Fig. S3.† The computed optimized structural parameters and the experimental data of 2A5C4C were obtained from the Gaussian 09 program package using the B3LYP/6-311++G(d,p) method and X-ray diffraction data [cif], respectively; the compared results are listed in ESI Table S2.† The deviations in the experimental XRD data [cif] from the computed optimized parameters are perhaps due to the intra-molecular interactions in the crystalline state. The difference may be justified on the basis that the calculations were carried out on a single molecule in the gaseous phase. In contrast, the experimental measurements involved many packing molecules treated in the condensed phase. Due to intra-molecular interactions, most of the optimized band lengths are smaller than the experimental values.
The 2A5C4C compound contains a 2-amino-5-chloropyridinium cation and a hydrogen glutarate anion. The calculated bond length of protonated N2–H3 is 1.025 Å and that of N4–H14 is 1.014 Å; the bond lengths increase due to intramolecular hydrogen bonding to the carboxylate oxygens. The distances between O15⋯H3 and O16⋯H14 are found to be 1.924 Å and 2.065 Å, respectively. These distances are significantly less than the van der Waals radii, which indicates the possibility of intramolecular hydrogen bonding between N2–H3⋯O15 and N4–H14⋯O16. The C–C bond lengths of 1.371 Å for C5–C7, 1.375 Å for C8–C10 and 1.489 Å for C20–C21 are shortened, which confirms the electron delocalization within the molecule. In 2-amino-5-chloropyridinium cation, the bond angles of C12–N4–H13 (119.78°), N2–C5–C7 (119.89°), Cl1–C7–C5 (120.55°), Cl1–C7–C8 (120.91°), C7–C8–C10 (120.51°), H9–C8–C10 (120.13°), C8–C10–H11 (120.91°) and C8–C10–C12 (120.09°) are essentially planar; a wide bond angle of 123.74° is obtained for C5–N2–C12 at the pronated N2 atom. In the hydrogen glutarate anion, the carboxylic group bond angle of O15–C20–O16 is 109.02°, and that of O17–C30–O19 is 123.84°. The O15–C20–O16 bond angle is shortened due to the existence of the protonated nitrogen group and hydrogen bonding. The DFT calculations predicted the dihedral angle of C20–C21–C24–C27 to be 70.67° and that of C21–C24–C27–C30 to be 179.53°, which describes the backbone conformation of the hydrogen glutarate anion. From ESI Table 3,† it is clear that the computed values are well matched with the experimental results.
3.14 Electrostatic potential (MEP) analysis
MEP is a useful property to study reactivity, given that an approaching electrophile will be attracted to negative regions. The negative potential regions are related to electrophilic reactivity, while the positive potential regions are related to nucleophilic reactivity. In most MEP maps, the maximum negative region, which is the preferred site for electrophilic attack, is depicted as red, while the maximum positive region, which is the preferred site for nucleophilic attack, is depicted as blue. The importance of MEP lies in the fact that it simultaneously displays the size and shape of a molecule as well as its positive, negative and neutral electrostatic potential regions in terms of color grading (Fig. 14(a)–(d)); this is very useful for studying the physiochemical property relationships of molecular structures.50,51
 |
| | Fig. 14 (a–d) Total electron density (TED), molecular electrostatic potential (MEP), electrostatic potential contour map and electrostatic potential (ESP) of 2A5C4C. | |
Dissimilar values of electrostatic potential at the surface are signified by different colors. The potential increases in the order red < rose < yellow < green < blue. The color code of the maps is in the range between −0.223 a.u (deepest red) and 0.223 a.u (deepest blue). Blue (positive) indicates the strongest attraction and red (negative) indicates the strongest repulsion. The electrophilic reactivity of the oxygen atom of the hydrogen glutarate anion represents the negative potential region of the molecule; meanwhile, in the positive region, the maximum nucleophilic reactivity is placed on all hydrogen atoms of the aromatic ring and chlorine atom (carbon-attached) of the 2-amino 5-chloropyridinium cation.
3.15 HOMO–LUMO analysis
The highest occupied molecular orbitals (HOMOs) and the lowest unoccupied molecular orbitals (LUMOs) of a molecule are termed the frontier molecular orbitals (FMOs). The FMOs play a vital role in the optical and electrical properties of a compound, as well as in quantum chemistry and UV-vis spectra.52 The HOMO exemplifies the ability to donate an electron; the LUMO, as an electron acceptor, embodies the ability to acquire an electron. The energy gap between the HOMO and LUMO regulates the kinetic stability, chemical reactivity, optical polarizability, and chemical hardness–softness of a molecule.53,54 In order to evaluate the energetic behaviour of the title compound, we carried out calculations in vacuo and in an organic solvent (methanol). The HOMO and LUMO values are −5.551 eV and −2.876 eV, respectively. The 3D plots of the HOMO and LUMO orbitals computed at the B3LYP/6-311++G(d,p) level for a 2A5C4C molecule are shown in Fig. 15. The positive phase is red and the negative phase is green. It is clear from the figure that the HOMO is localized on the chlorine and pyridine ring, except for the NH2 group and the adjacent C12 carbon; also, the LUMO is localized on the entire pyridine ring. The value of energy separation between the HOMO and the LUMO is 2.675 eV. The HOMO–LUMO energy gap explains the eventual charge transfer interaction within the molecule, which influences its biological activity. The HOMO–LUMO transition implies that the electron density partially relocates from the chloro and amino groups.
 |
| | Fig. 15 Frontier molecular orbitals and energies for the HOMO and LUMO of 2A5C4C. | |
Moreover, the energy band gap value is useful to determine the chemical reactivity and kinetic stability of a molecule. A molecule with a relatively small band gap energy has high chemical reactivity and low kinetic stability. The ionization energy (I) and electron affinity (A) of a molecule are of great importance in determining biochemical pathways for electron transfer, photosynthesis, oxidative phosphorylation, and oxidative stress. The ionization energy of a compound is directly proportional to its electrochemical oxidation potential. The electron affinity indicates the stability of free radicals and anions. The ionization energy and electron affinity can be expressed through HOMO and LUMO orbital energies by the Koopmans' theorem as I = −EHOMO and A = −ELUMO.55 The ionization energy and electron affinity of the title molecule are 5.551 eV and 2.876 eV, respectively. From the ionization energy and the electron affinity, the Mulliken electronegativity (χ) can be calculated from the equation χ = (I + A)/2. The electronegativity of our molecule is 4.213 eV. The chemical potential (μ) is the negative value of the electronegativity. Softness (S) is a property of the molecule that measures the extent of chemical reactivity. It is the reciprocal of hardness (S = 1/2η). The hardness is calculated using the expression η = (I − A)/2.56 The softness and hardness values of 2A5C4C are 1.337 and 0.374 eV, respectively. Parr et al.57 have proposed the global electrophilicity power of a system as ω = μ2/2η. This index measures the stabilization in energy when the system acquires an additional electronic charge from the environment. The value of the electrophilicity index of the title molecule is 6.637 eV. The estimated chemical potential value is negative (−4.213 eV) and is smaller than the electrophilicity index, which indicates that the electron is promoted from the nucleophile (HOMO) to the electrophile (LUMO), which provides the chemical reactivity and the stability of the molecule. The lowest HOMO–LUMO energy gap indicates the eventual charge transfer interaction within the molecule and also confers proof of the NLO activity of the material.
3.16 NBO analysis
NBO analysis was performed on the title molecule at the B3LYP/6-311++G(d,p) level in order to elucidate the intramolecular interactions, hybridization and delocalization of electron density within the molecule. Natural bond orbital analysis provides an efficient method for studying intra- and inter-molecular bonding and interactions between bonds; it also provides a convenient basis for investigating charge transfer or conjugative interaction in molecular systems. Some electron donor orbitals, acceptor orbitals and interacting stabilization energies resulting from second-order micro disturbance theory have been reported previously.58,59 The NBO analysis results are presented in ESI Table S3.† The result of this interaction is a loss of occupancy from the concentration of electrons in the NBO of the idealized Lewis structure into an empty non-Lewis orbital. For each donor (i) and acceptor (j), the stabilization energy E(2) associated with the delocalization I → j is estimated as| |
 | (6) |
where 〈σ|F|σ〉2 or Fij2 is the Fock matrix element, i and j are the NBO orbitals,  and −εσ are the energies of σ and σ* NBOs, respectively, and n → σ is the population of the donor σ orbital.
A large diversity of energy values was found; the most dominant hyperconjugative interaction of n1C7 → π*(N2–C5) has a maximum stabilization energy of 423.49 kJ mol−1, while the electron density of π*(N2–C5) is up to 0.3108 e. The charge transfer hyperconjugative interactions between n1C7 → π*(C8–C10) and n2O17 → π*(O19–C30) have high stabilization energies of up to 106.18 and 103.92 kJ mol−1, respectively, and electron densities of up to 0.1033 e and 0.1079 e for the respective anti-bonds. This larger energy shows the hyperconjugation between the electron donating groups and the pyridine ring. These interactions are observed as high electron densities (ED) in the (N2–C5), (C8–C10) and (O19–C30) anti-bonding orbitals which weaken the respective bonds and increases the bond lengths. This high occupancy indicates strong π electron delocalization in the respective bonds in the molecule. The intramolecular hydrogen bonding interactions are formed by the overlap between the n orbital and the π* anti-bonding orbital. The interactions between n1O15 → σ*(N2–H13) and n1O16 → σ*(N4–H14) have stabilization energies of 20.98 and 13.06 kJ mol−1, respectively, whereas the n2O19 bonding orbitals interact with the σ*(O17–C30) and σ*(C27–C30) anti-bonding orbitals, contributing energies of up to 69.88 and 43.42 kJ mol−1, respectively.
3.17 First order hyperpolarizability calculations
The theoretical values of the fundamental NLO properties (μ, αo, Δα and βo) of 2A5C4C were obtained using the Gaussian 09 program package with the B3LYP/6-311++G(d,p) basis set. The parameters calculated through the finite field approach are listed in ESI Table S4.† The numerical values of the NLO parameters were acquired by substituting the Gaussian 09 output data in the following equation:| |
 | (7) |
where μx, μy and μz are dipole moments along the x, y, and z directions. A dipole moment is a major electronic property of a molecule which results from the non-homogeneous distribution of charges on various atoms in the molecule. Also, it is mainly used to study the intermolecular interactions involving van der Waals type dipole–dipole forces. Intermolecular interactions are much stronger for larger dipole moments.
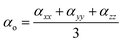
The mean polarizability is calculated as
| |
 | (8) |
where
αxx,
αyy and
αzz are the diagonal components of the polarizability tensor, and other components (
αxy,
αyz,
αxz) are not required to obtain isotropic quantities.
The anisotropy of polarizability is calculated as
| |
 | (9) |
The first hyperpolarizability is calculated as
| |
 | (10) |
In the presence of the applied electric field, the first order hyperpolarizability is a third rank tensor that can be explained by a 3 × 3 matrix with 27 components. Kleinman symmetry reduces these to 10 components. The value of total polarizability and hyperpolarizability of the x, y and z components obtained from the Gaussian 09 output is given as
| |
 | (11) |
Because the polarizability and hyperpolarizability values of Gaussian 09 outputs are reported in atomic units (a.u.), the calculated values have been converted into electrostatic units (esu). The calculated values of μ and βo for 2A5C4C crystals with the B3LYP/6-311++G(d,p) method were 5.01 D and 12.3226 × 10⁻³⁰ cm−5 esu−1, respectively, whereas for urea, they were 1.5256 debye and 0.8461 × 10⁻³⁰ cm−5 esu−1, respectively. The total dipole moment (μ) of the 2A5C4C molecule is approximately 3.28 times greater than that of urea, and its first order hyperpolarizability (βo) is 14.56 times greater than that of urea. Because urea is a prototypical molecule used in the study of the NLO properties of a molecular structure, it is frequently used as a reference material for comparative purposes. A large first hyperpolarizability value is a requirement of a good NLO material; generally, the significant parameters influencing β are (i) a donor–acceptor system, (ii) the nature of the substituents, (iii) a conjugated π system and (iv) the influence of planarity. The results indicate that the studied compound is a good NLO material due to its β values. The largest value is noted to be in the βxxx direction; this may be because the subsequent delocalization of the electron cloud occurs more in this particular direction. The larger predicted hyperpolarizability value of 2A5C4C compared to the experimental value may be validated by the fact that the theoretical value belongs to the isolated molecule in the gas phase, whereas the experimental value was determined for the bonded molecule in the solid state.
3.18 Antioxidant activity
The DPPH method is a simple, rapid and convenient method for scavenging free radicals. This method is widely used to examine the antioxidant properties of compounds. In the presence of the compound, the stable DPPH radicals can donate hydrogen atoms. Hence, its radical property is destroyed. The free radical scavenging ability of the synthesized compound was studied with DPPH radical in this analysis. H2O2 scavenging was also studied to analyze its antioxidant activity. Hydrogen peroxide (H2O2) is a weak oxidizing agent and can inactivate a few enzymes directly, usually by oxidation of essential thiol (–SH) groups. Hydrogen peroxide can cross cell membranes rapidly; once inside the cell, H2O2 can react with Fe2+ and with Cu2+ to form hydroxyl radicals, which may be the origin of many of its toxic effects. It is therefore biologically advantageous for cells to control the amount of hydrogen peroxide that is allowed to accumulate. Ascorbic acid (Aca) was used as a standard complex to compare the results. The antioxidant activity results toward DPPH and H2O2 radicals are depicted in Fig. 16. The results indicated that the scavenging ability of the compound is higher for H2O2 free radicals than for DPPH radicals. Also, the antioxidant results obtained in the present study were compared with those of other pyridinium crystals (Table 2). This study confirms that the synthesized 2A5C4C compound is capable of scavenging free radicals.
 |
| | Fig. 16 Comparison charts of DPPH radical scavenging activity of single crystal 2A5C4C with standard ascorbic acid. (b) Comparison charts of H2O2 radical scavenging activity of single crystal 2A5C4C with standard ascorbic acid. | |
Table 2 Comparison of antioxidant activity of 2A5C4C with some known pyridinium derivatives for DPPH radicals
| Pyridinium crystal |
IC50 value |
Standard (Aca) |
No. of times greater than standard |
| APPTS60 |
131.25 |
63.26 |
2.07 |
| BPHB61 |
271.6 |
101.6 |
2.67 |
| 2A54C (present) |
154 |
34.27 |
4.49 |
4 Conclusions
Nonlinear optical single crystals of 2A5C4C were synthesized and grown by adopting a slow evaporation method at room temperature. Single crystal and powder X-ray diffraction analysis confirmed the non-centrosymmetric space group, phases and crystallinity of the grown crystals. HRXRD studies of the surface qualities of the single crystal reveal a FWHM of 22 arc s, indicating excellent crystallinity; also, the grown crystals are free from structural grain boundaries. The structure and presence of various functional groups in the crystal were confirmed by NMR and FTIR studies, respectively. UV-Vis analysis reveals a lower cutoff wavelength at 348 nm and exhibits the absence of absorption in the visible region. The 2A5C4C crystal showed transparency beyond the 400 nm wavelength (visible) region, which is a desirable property for various NLO applications. The TG/DTA analysis substantiated the thermal stability of 2A5C4C up to 119 °C. An etching study confirmed lower dislocation with 3D growth. The characteristic low dielectric constant and dielectric loss values suggest that the crystal is suitable for photonics, electro-optics and microelectronics applications. The positive photoconducting nature of the crystals conveys their suitability for optical applications. The Vickers microhardness test revealed the reverse indentation nature of the material. The single shot surface laser damage threshold was found to be 2.88 GW cm−2. The SHG efficiency of the 2A5C4C crystal was 4.34 times that of KDP. Also, particle size-dependent SHG exhibited phase-matching behaviour; this demonstrates the suitability of the crystal for second harmonic generation applications. Molecular electrostatic potential analysis was performed using the optimized geometry of the molecule and provided vital details on the nucleophilic and electrophilic sites of 2A5C4C. The small HOMO–LUMO energy gap provided detailed information about the chemical stability, hardness, charge distribution and biological activity of 2A5C4C. NBO analysis revealed inter- and intramolecular interactions in the molecular system of 2A5C4C. The predicted first hyperpolarizability was found to be 14.56 times greater than that of urea; this suggests that the title compound could be an attractive material for nonlinear optical applications. Antioxidant studies revealed that the grown 2A5C4C crystal is a potential antioxidant against DPPH and H2O2 radicals. All the above results, including the good crystalline nature, optical transparency, lower values of dielectric constant and loss, positive photoconductivity, phase matching behaviour, theoretical investigations and antioxidant studies, indicate that 2A5C4C is a potential candidate for both optoelectronics and biological applications.
Acknowledgements
The authors gratefully acknowledge financial support from the DST, Government of India, for the major research project (SB/EMEQ-293/2013).
References
- G. Peramaiyan, P. Pandi, N. Vijayan, G. Bhagavannarayana and R. Mohan Kumar, J. Cryst. Growth, 2013, 375, 6–9 CrossRef CAS.
- V. Kannan, K. Thirupugalmani and S. Brahadeeswaran, J. Mol. Struct., 2013, 1049, 268–279 CrossRef CAS.
- T. Pal, T. Kar, G. Bocelli and L. Rigi, Cryst. Growth Des., 2003, 3, 13–16 Search PubMed.
- B. Ruiz, B. J. Coe, R. Gianotti, V. Gramlich, M. Jazbinseka and P. Gunter, CrystEngComm, 2007, 9, 772–776 RSC.
- A. H. Reshak, S. Auluck, D. Stys, I. V. Kityk, H. Kamarudin, J. Berdowski and Z. Tylczynski, J. Mater. Chem., 2011, 21, 17219–17228 RSC.
- V. Murugesan, M. Saravanabhavan and M. Sekar, Spectrochim. Acta, Part A, 2015, 147, 99–106 CrossRef CAS PubMed.
- J. Chandrasekaran, S. Balaprabhakaran and B. Babu, Optik, 2013, 124, 4296–4299 CrossRef CAS.
- T. Chen, Z. Sun, C. Song, Y. Ge, J. Luo, W. Lin and M. Hong, Cryst. Growth Des., 2012, 12, 2673–2678 Search PubMed.
- C. Ji, T. Chen, Z. Sun, Y. Ge, W. Lin, J. Luo, Q. Shi and M. Hong, CrystEngComm, 2013, 15, 2157–2162 RSC.
- L. Guru Prasad, V. Krishnakumar and R. Nagalakshmi, Phys. B, 2010, 405, 1652–1657 CrossRef CAS.
- N. Vijayan, G. Bhagavannarayana, R. Ramesh Babu, R. Gopalakrishnan, K. K. Maurya and P. Ramasamy, Cryst. Growth Des., 2006, 6, 1542–1546 Search PubMed.
- P. Srinivasan, T. Kanagasekaran, R. Gopalakrishnan, G. Bhagavannarayana and P. Ramasamy, Cryst. Growth Des., 2006, 6, 71663–71670 Search PubMed.
- J. Zaccaro, F. Lorut and A. Ibanez, J. Mater. Chem., 1999, 9, 1091–1095 RSC.
- P. Mukhopadhyay, P. K. Bharadwaj, G. Savitha, A. Krishnan and P. K. Das, J. Mater. Chem., 2002, 12, 2237–2244 RSC.
- N. Nemoto, J. Abe, F. Miyata, Y. Shirai and Y. Nagase, J. Mater. Chem., 1998, 8, 1193–1197 RSC.
- M. Hemamalini and H.-K. Fun, Acta Crystallogr., 2010, E66, o2008–o2009 Search PubMed.
- V. Venkataramanan, S. Maheswaran, J. N. Sherwood and H. L. Bhat, J. Cryst. Growth, 1997, 179, 605–610 CrossRef CAS.
- S. J. Kwon, M. Jazbinsek, O. P. Kwon and P. Gunter, Cryst. Growth Des., 2010, 10, 1552–1558 Search PubMed.
- M. J. Frisch, et al., Gaussian 09, Revision C. 02, Gaussian, Inc., Wallingford CT, 2009 Search PubMed.
- A. D. Becke, J. Chem. Phys., 1993, 98, 5648–5652 CrossRef CAS.
- G. Rauhut and P. Pulay, J. Phys. Chem., 1995, 99, 3093–3100 CrossRef CAS.
- R. I. Dennington, T. Keith, J. Millam, K. Eppinnett and W. Hovell, Gauss View, Version 3.09, 2003 Search PubMed.
- K. Elizabeth and M. N. A. Rao, Int. J. Pharm., 1990, 58, 237–240 CrossRef.
- MERCURY 1.3, Cambridge Crystallographic Data centre, CCDC Software Limited, Cambridge, UK, 2004 Search PubMed.
- B. W. Batterman and H. Cole, Rev. Mod. Phys., 1964, 36, 681–717 CrossRef CAS.
- M. Senthil Pandian, N. Pattanaboonmee, P. Ramasamy and P. Manyum, J. Cryst. Growth, 2011, 314, 207–212 CrossRef CAS.
- K. Thirupugalmani, S. Karthick, G. Shanmugam, V. Kannan, B. Sridhar, K. Nehru and S. Brahadeeswaran, Opt. Mater., 2015, 49, 158–170 CrossRef CAS.
- J. C. Tauc, Optical properties of solids, Amsterdam, North-Holland, 1972, pp. 372–5 Search PubMed.
- R. Thirumurugan, B. Babu, K. Anitha and J. Chandrasekaran, Spectrochim. Acta, Part A, 2015, 140, 44–53 CrossRef CAS PubMed.
- S. Boomadevi and R. Dhanasekaran, J. Cryst. Growth, 2004, 261, 70–76 CrossRef CAS.
- V. Mathew, S. Jacob, C. K. Mahadevan and K. E. Abraham, Phys. B, 2012, 407, 222–226 CrossRef CAS.
- P. Srinivasan, T. Kanagasekaran, N. Vijayan, G. Bhagavannarayana, R. Gopalakrishnan and P. Ramasamy, Opt. Mater., 2007, 30, 553–564 CrossRef CAS.
- K. Syed, S. Babu, G. Peramaiyan, M. Nizam Mohideen and R. Mohan, J. Therm. Anal. Calorim., 2015, 120, 1337–1345 CrossRef.
- Broadband Dielectric Spectroscopy, ed. F. Kremer and A. Schoenhals, Springer, Berlin, 2003 Search PubMed.
- S. Nazarath Begum, U. Sankar, T. ChithambraThanu and P. Selvarajan, Optik, 2014, 125, 1493–1497 CrossRef CAS.
- M. Sethuram, G. Bhargavi, M. V. Rajasehakaran, M. Dhandapani and G. Amirthaganesan, Optik, 2014, 125, 55–60 CrossRef CAS.
- B. M. Sornamurthy, G. Peramaiyan, P. Pandi, S. Das, G. Bhagavannarayana, V. Manivannan and R. Mohan Kumar, J. Cryst. Growth, 2014, 397, 1–5 CrossRef CAS.
- M. Jazbinsek and M. Zgonik, Appl. Phys. B, 2002, 74, 407–414 CrossRef CAS.
- M. Zgonik, R. Schlesser, I. Biaggio, E. Voit, J. Tscherry and P. Gunter, J. Appl. Phys., 1993, 74, 1287–1297 CrossRef CAS.
- I. P. Bincy and R. Gopalakrishnan, J. Cryst. Growth, 2014, 402, 22–31 CrossRef CAS.
- V. N. Joshi, Photoconductivity, Marcel Dekkar, New York, 1990 Search PubMed.
- R. H. Bube, Photoconductivity of Solids, Wiley Inter Science, New York, 1981 Search PubMed.
- B. Milton Boaz, S. Mary Navis Priya, J. Mary Linet, P. Martin Devaprasath and S. Jerome das, Opt. Mater., 2007, 29, 827–832 CrossRef.
- M. Senthil Pandian, N. Pattanaboonmee, P. Ramasamy and P. Manyum, J. Cryst. Growth, 2011, 314, 207 CrossRef CAS.
- S. K. Kurtz and T. T. Perry, J. Appl. Phys., 1968, 39, 3798–3815 CrossRef CAS.
- T. P. Srinivasan, S. Anandhi and R. Gopalakrishnan, Spectrochim. Acta, Part A, 2010, 75, 1223–1227 CrossRef CAS PubMed.
- C. Jesintha John, M. Amalanathan, A. R. Twinkle, P. Srinivasan and I. Hubert Joe, Spectrochim. Acta, Part A, 2011, 81, 151–161 CrossRef PubMed.
- M. Rajalakshmi, R. Indirajith, M. Palanichamy and R. Gopalakrishnan, Spectrochim. Acta, Part A, 2011, 84, 43–50 CrossRef CAS PubMed.
- L. Mariappan, A. Kandasamy, M. Rathnakumari and P. Sureshkumar, Optik, 2013, 124, 2630–2634 CrossRef CAS.
- J. M. Seminario, Recent Developments and Applications of Modern Density Functional Theory, Elsevier, 1996, vol. 4, pp. 800–806 Search PubMed.
- J. S. Murray and K. Sen, Molecular Electrostatic Potentials, Concepts and Applications, Elsevier, Amsterdam, 1996 Search PubMed.
- I. Fleming, Frontier Orbitals, Organic Chemical Reactions, Wiley, London, 1976 Search PubMed.
- A. M. Asiri, M. Karabacak, M. Kurt and K. A. Alamry, Spectrochim. Acta, Part A, 2011, 82, 444–455 CrossRef CAS PubMed.
- B. Kosar and C. Albayrak, Spectrochim. Acta, Part A, 2011, 78, 160–167 CrossRef PubMed.
- T. A. Koopmans, Physica, 1993, 1, 104–113 CrossRef.
- H. Chermette, J. Comput. Chem., 1999, 20, 129–154 CrossRef CAS.
- R. G. Parr, L. V. Szentpaly and S. Liu, J. Am. Chem. Soc., 1999, 121, 1922–1924 CrossRef CAS.
- L. J. Bellamy, The Infrared Spectra of Complex Molecules, John Wiley & Sons, New York, NY, USA, 3rd edn, 1975 Search PubMed.
- E. Koglin, E. G. Witte and R. J. Meier, Vib. Spectrosc., 2003, 33, 49–61 CrossRef CAS.
- V. Murugesan, M. Saravanabhavan and M. Sekar, J. Mol. Struct., 2015, 1084, 95–102 CrossRef CAS.
- B. Mohanbabu, R. Bharathikannan and G. Siva, J. Optoelectron. Adv. Mater., 2015, 17, 1603–1614 CAS.
Footnote |
| † Electronic supplementary information (ESI) available: 1H, 13C NMR (Fig. S1, S2 and Table S1); optimized geometry (Fig. S3), theoretical bond angle and bond length (Table S2), NBO analysis (Table S3) theoretical hyperpolarizability values (Table S4) thermodynamical properties (Table S5); Mulliken and natural population analysis (Fig. S4 and Table S6). See DOI: 10.1039/c6ra15791b |
|
| This journal is © The Royal Society of Chemistry 2016 |
Click here to see how this site uses Cookies. View our privacy policy here. 


 and −εσ are the energies of σ and σ* NBOs, respectively, and n → σ is the population of the donor σ orbital.


