Highly sensitive and selective optical detection of lead(II) using a label-free fluorescent aptasensor

Yafei Huangabc, Jiao Yanabc, Zongzhuang Fangab, Chenghui Zhang*a, Wenhui Baibc, Mengmeng Yanbc, Chao Zhubc, Chengguo Gaod and Ailiang Chen*bc
aCollege of Food Science and Technology, Hainan University, Haikou 570228, China. E-mail: zchlm@163.com
bInstitute of Quality Standards and Testing Technology for Agro-products, Key Laboratory of Agro-product Quality and Safety, Chinese Academy of Agricultural Sciences, Beijing 100081, China. E-mail: ailiang.chen@gmail.com
cKey Laboratory of Agri-food Quality and Safety, Ministry of Agriculture, Beijing 100081, China
dGansu Zeacen Yeast Technology Co., Ltd, Baiyin 730900, China

Received 21st June 2016 , Accepted 20th August 2016

First published on 31st August 2016


Abstract

Lead (Pb) is a heavy metal that does great harm to human bodies through its accumulation in the food chain. It remains a challenge to use environment-friendly and biocompatible materials to sensitively detect lead in organisms and aquatic ecosystems. To achieve highly sensitive and selective Pb2+ detection, a sensor based on ultra-sensitive double-stranded DNA (dsDNA) specific dye PicoGreen and label-free oligonucleotides was reported. The principle of this method is that the Pb2+ induced a structural change of G-rich thrombin aptamer from random coil to G-quadruplex, which prevented its binding to its complementary sequences to form dsDNA and caused a fluorescence intensity decrease with PicoGreen. The results showed that this method satisfied the requirement of the maximum residue limit (MRL) of Pb2+ and could detect Pb2+ at a lowest concentration of 1 ng mL−1 within a dynamic range of six orders of magnitude. Since the aptamer was highly specific, this method showed high Pb2+ selectivity against eight other metals. Finally, the proposed assay was successfully validated by determining Pb2+ in water samples.

1. Introduction

Heavy metal ions have great impacts on ecosystems and may seriously endanger human health because of their pollution. Among heavy metals, lead is significantly harmful to human health by damaging various human organisms such as the nervous system, hematopoietic stem cells in the bone, the digestive system, and the male reproductive system. During the sensitive development period of the nervous system, children's brains are especially sensitive to lead. Researches showed that mental retardation in children was correlated with the increase of lead contamination. When blood lead levels in children was augmented by every 10 mg/100 mL, children's intelligence test scores decreased by 6–8.1 Therefore, the United States generally considered blood lead poisoning when children's lead content reached 0.1 μg mL−1 compared with the previous 0.25 mg mL−1.2 In this case, monitoring the Pb2+ level in aqueous solutions is an important task.

As the most common techniques for Pb2+ detection, atomic absorption spectroscopy (AAS),3 reversed-phase high-performance liquid chromatography (RP-HPLC),4 inductively coupled plasma optical emission spectroscopy (ICP-OES)5 and inductively coupled plasma mass spectrometry (ICP-MS)6 have been developed. Nevertheless, these techniques require sophisticated and expensive equipment and materials, and using them is time-consuming.

To address these limitations, aptamers selected in vitro using the SELEX method are used as new recognition molecules for analytical applications. As single-stranded DNAs or RNAs, aptamers are highly specific to small-molecule drugs, peptides, cells and proteins with high affinity within a large range of target ligands.7,8 Compared with conventional antibodies, aptamers possess prominent advantages, such as high binding capability, excellent stability, wide target scope, simple synthesis and easy modification.4 TBA (5′-GGTTGGTGTGGTTGG-3′)9 is aptamer dedicated to Pb2+, which has a small dissociation constant within the nanomolar range and is not prone to bind with other heavy metal ions.

Recently, some Pb2+-based aptamer sensors have been reported to detect Pb2+ with induced allosteric G4 structures.10–13 Liu and his co-workers proposed a new sensitive method to detect Pb2+ with TBA where the 5′ and 3′ termini were labeled by a fluorophore and quencher, respectively.14 Li et al. developed an electrochemical sensing platform for sensitive and selective detection of lead based on conformational switching of Pb2+-induced G-rich DNA with the crystal violet functioning as a G4-binding indicator.11 However, DNA probes in these methods require an additional immobilization technique or DNA-labeling process, which is complex, time-dependent and cost-ineffective. Therefore, it is very important to develop a simple, convenient and inexpensive sensor for sensitive monitoring of Pb2+ in the environment and food.

Here, we reported a simple, sensitive and selective fluorescent approach for Pb2+ detection based on aptamer in the absence of any label. The method is dependent on dsDNA's conformational changes and light-emitting properties of PicoGreen. On this sensing platform, the PicoGreen dye transduces fluorescence signals with its high specificity for dsDNA. This approach was proved to be more sensitive, more specific, simpler and cheaper than earlier techniques.

2. Experimental

2.1 Reagents and chemicals

Pb2+ aptamer has a sequence 5′-GGT TGG TGT GGT TGG-3′,9 and its complete complementary strand is 5′-CCA ACC ACA CCA ACC-3′. All involved oligonucleotide sequences were synthesized and then purified using HPLC by Shanghai Sangon Biotechnology Co., Ltd.

The 10-fold concentrated fluorescent dye PicoGreen (PG) was obtained from Invitrogen (Carlsbad, USA). Lead nitrate, as well as Pb(NO3)2, LiCl, CaCl2, Cu(SO4)2, Zn(NO3)2, MgCl2, KCl, AgNO3, NaCl, and HgNO3 (Lot# BCBJ9926V) were from Sigma-Aldrich (CA, USA). Other standard chemicals (analytical grade) were purchased from Beijing Chemical Reagent Company. Ultrapure water was purified by the Milli-Q system (Millipore, Bedford, USA). An LS-55 Fluorescence Spectrometer (Perkin-Elmer, Norwalk, CT) was used to scan fluorescence intensities at excitation and emission lengths of 480 nm and 520 nm, respectively, and the results were recorded with a Tecan Infinite 200 multifunctional microplate reader (Tecan Austria GmbH, Austria), where the excitation and emission lengths were 480 nm and 520 nm, respectively. Agilent ICP-MS 5000 (Agilent Technologies Inc., USA) was used to analyze water samples to validate the assay.

2.2 Fluorescent detection of Pb2+

To detect Pb2+ using this approach, 25 μL of 0.5 μM aptamer containing Pb2+ that was dissolved in water at different concentrations was added to microplate wells and subsequently incubated at room temperature for 10 min. Afterwards, 25 μL of 0.5 μM complementary strand dissolved in water and 10 μL of 10× PG (10 mM Tris–HCl; pH 8.0) were both added to the wells with the samples. Following 3 min incubation, the fluorescence intensities of the samples were scanned with the aforementioned LS-55 Fluorescence Spectrometer and recorded by the multifunctional reader. The experiment was performed in triplicate to obtain average values.

2.3 Detection of Pb2+ in real samples

Tap water, mineral water (Ganten) and purified water (Wahaha) were all used as real samples to verify the practicability of this sensing system. Tap water was prepared in our laboratory, while other samples were purchased from a supermarket. They were all directly used for Pb2+ detection in the analysis methods described as above.

3. Results and discussion

3.1 Design of the principle

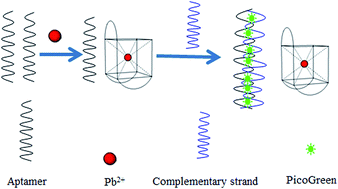
PG is specific double-stranded dye used during quantitative assay of dsDNA in a solution. This dye does not fluoresce if it is released free. As a signal probe, the PG dye can detect dsDNA whose concentration is so low as 25 pg mL−1.15 The sensing mechanism of Pb2+ detection is illustrated in Fig. 1. The figure shows that the aptamer and complementary strand form a hybrid without Pb2+, and then PicoGreen is inserted into the dsDNA duplex, resulting in strong fluorescent intensities. However, when Pb2+ exists, the structure of the aptamer is changed from ssDNA to a G-quadruplex that binds to the target, forming the aptamer–target complex. Upon addition of Pb2+, no or few aptamer sequences are present to form dsDNA, and then PicoGreen fails to induce fluorescence. Therefore, Pb2+ can be quantitatively analyzed when the changes in the fluorescence intensity of the PG dye are monitored, which adheres to the principle of the negative correlation between the amount of Pb2+ and the intensity of fluorescence.
image file: c6ra15750e-f1.tif
Fig. 1 Configurations and measurement principles of label-free fluorescent aptamer-based PG assay for Pb2+ detection.

3.2 PG amount optimization

In this strategy, the amount of PG was optimized before performing Pb2+ assay. Different volumes (2, 4, 6, 8, 10, 12, 14, 16, 18 and 20 μL) of 10× PG solutions were added into the mixture after the reactions. As shown in Fig. 2, with the increase of the PG volume from 0 to 20 μL, the fluorescence intensity gradually increases, and when PG increases continuously from 10 to 20 μL, the fluorescence intensity reaches the peak level and does not change obviously. Thus, 10 μL of 10× PG solution was selected for the following experiments.
image file: c6ra15750e-f2.tif
Fig. 2 The fluorescence intensity changes depending on the volumes (2, 4, 6, 8, 10, 12, 14, 16, 18 and 20 μL) of 10× PG solutions.

3.3 Aptasensor reaction time optimization

In this study, the method is dependent upon the change of the PG's fluorescence intensity. Therefore, the fluorescence decrease ascribing solely to the specific Pb2+–aptamer interaction is an important factor. Before Pb2+ was analyzed, time required for reaction between aptamer and Pb2+ to form a G4 structure was optimized. As shown in Fig. 3, the fluorescent intensity increased for the first 5 min due to the binding of free aptamer to the complementary strand. Then, the fluorescent intensity showed different changes from 5 to 20 min for different concentrations of Pb2+ due to the competition for aptamer between the aptamer/Pb2+ complex and aptamer/complementary strand DNA duplex. Most aptamers bind to the complementary sequences at low concentrations of Pb2+ within 10 min, and the increasing fluorescent intensity plays a major role. For a high concentration of Pb2+, most aptamer binds to Pb2+, and the decrease of the fluorescence intensity plays a major role even at the beginning of the reaction. Generally, about 10 min was selected as the dsDNA reaction time because it demonstrated the greatest discrepancy in the fluorescence intensity with Pb2+ of various concentrations. This optimized reaction time provided high sensitivity.
image file: c6ra15750e-f3.tif
Fig. 3 Optimization on the reaction time of aptamer and Pb2+ to form a G4 structure after the addition of aptamer into Pb2+ of different concentrations.

3.4 Sensitivity evaluation for the label-free fluorescent aptasensor

With the experimental conditions optimized, the changes in the fluorescence intensity were obtained by using different concentrations of Pb2+, which facilitated sensitivity evaluation for the proposed sensing platform. The results shown in Fig. 4 revealed a concentration-dependent response with a series of measured concentrations of Pb2+. When Pb2+ was unavailable, the sensor system provided excessively high fluorescence because the aptamer probes were chiefly hybridized with complementary probes and the PG intercalation caused an exceptionally increase in fluorescence emission. Fig. 4(A) shows that with the increasing concentrations of Pb2+ from 1 ng mL−1 to 1 mg mL−1, the fluorescence intensity is gradually decreased because of the decrease in DNA duplexes and intercalated PG. As shown in Fig. 4(B), the decrease of fluorescence signals represented by F/F0 is proportional to the Pb2+ concentration, indicating that quantitative acquisition of the Pb2+ concentration can be performed. With six or more orders of magnitude, Pb2+ can be detected at even the lowest concentration of 1 ng mL−1, and under the conditions, the fluorescent intensity was decreased by about 10% compared to the blank sample. Compared with Pb2+ sensors reported by other literatures, which utilize fluorescence, the aptasensor in this work exhibits high sensitivity and cost-effective (Table 1).
image file: c6ra15750e-f4.tif
Fig. 4 Label-free fluorescent aptamer-based PG fluorescent assay for detection of Pb2+. (A) The fluorescence intensity changes correlated with the logarithm of Pb2+ concentrations within the range of 1 ng mL−1 to 1 mg mL−1. (B) Fluorescence spectra of the solution at various concentrations of Pb2+.
Table 1 Analytical performance comparison between different Pb2+ biosensors based on oligonucleotides
Probe Detection method Linear range Reference
8-17DNAzyme/polythiophene Fluorescence 10 nM 16
G-Quadruplex/NMM Fluorescence 5 nM 17
G-Quadruplex/multi-walled carbon nanotube Fluorescence 20 nM 18
GR-5DNAzyme/fluorophore carboxyfluorescein Fluorescence 1 nM 19
8-17DNAzyme/fluorophore carboxyfluorescein Fluorescence 3.0 × 10⁻⁹ to 5.0 × 10⁻⁶ (mol mL−1) 20
G-Quadruplex DNAzyme Colorimetry and chemiluminescence 0 to 3.2 × 10⁻⁸ (mol mL−1) 21
8-17DNAzyme/Ru(bpy)32+ ECL 18 nM 22
C–AuNPs Fluorescence 10 nM 23
DNAzyme Fluorescence 530 pM 24
G-Quadruplex Fluorescence 1 ng mL−1 This work


3.5 Specificity confirmation

To study the selectivity of Pb2+, 10 μg mL−1 of metal ions, including Ag+, Cu2+, Li+, Zn2+, Na+, Ca2+, Mg2+, K+ and Hg2+ were used to perform control experiments. As shown in Fig. 5, Pb2+ causes a significant decrease in fluorescence signals while other metal ions have an eligible effect on fluorescent intensity. This sensing method is highly selective because aptamer is highly affinitive to Pb2+ against many other metal ions.
image file: c6ra15750e-f5.tif
Fig. 5 Specificity test against different metal ions (each at 10 μg mL−1). (1) background; (2) Ag+; (3) Cu2+; (4) Li+; (5) Zn2+; (6) Na+; (7) Ca2+; (8) Mg2+; (9) K+; (10) Hg+; (11) Pb2+.

3.6 Analysis of water samples

To explore practical applications of the proposed fluorescent system, trace Pb2+ in tap water samples was determined. Table 2 showed that the Pb2+ level in tap water was sufficiently low so that it failed to be detected using the sensor. Interestingly, an obvious increase was observed in real signals when Pb2+ at certain concentrations was added into the samples. The developed assay was validated by analyzing water samples in comparison with ICP-MS analysis. As shown in Table 2, there was no significant difference between the two methods. Thus, this approach shows potential applications in determination of Pb2+ in water samples.
Table 2 Results obtained in analysis of water samples with the label-free fluorescent aptasensor method and ICP-MS
  Spiked (ng mL−1) ICP-MS (ng mL−1) Fluorescent aptasensor
Mean (ng mL−1) RSD%
Tap water 0 0.9 −0.22 1.33%
30 32.8 31.7 2.56%
100 87.9 94.5 0.53%
Purified water (Wahaha) 0 −0.77 −1.3 2.09%
30 27.9 28.3 1.43%
100 102 107 0.98%
Mineral water (Ganten) 0 −1.6 −1.4 0.73%
30 23.7 27.8 1.39%
100 96 97.9 1.79%


4. Conclusion

For the purpose of Pb2+ detection, we have designed a simplified, fast, highly selective and highly sensitive sensor in this paper. This sensing system is developed according to the principle that when binding to its targets, aptamer with its structure changed leads to the decrease in DNA duplexes of aptamer/complementary sequences, and further the decrease in the fluorescent intensity of PG inserted into the dsDNA duplex. Compared with other fluorescent aptasensors for Pb2+, the proposed fluorescent aptasensor avoids DNA modification, becoming a simple and cost-effective analysis method for Pb2+. Importantly, the linear dynamic range was found from 1 ng mL−1 to over 1 mg mL−1, and the detection sensitivity for Pb2+ was found to be 1 ng mL−1. Furthermore, the entire detection procedure could be completed in less than 30 min. Therefore, the proposed method is simple, fast, highly sensitive and easy-to-read for Pb2+ analysis and can be utilized in future detection on site in environmental waters.

Acknowledgements

This work was supported by the Special Fund for Agro Scientific Research in the Public Interest (201203046, 201203023). The authors express their gratitude for the support.

References

  1. A. M. Chen, K. N. Dietrich, J. H. Ware, J. Radcliffe and W. J. Rogan, Environ. Health Perspect., 2005, 113, 597–601 CrossRef CAS PubMed.
  2. H. L. Needleman, V. N. Houk, I. H. Billick, E. Buchart, L. Chadzynski, R. Challop, J. J. Chisolm, A. S. Curran, B. Davidow, P. Field, J. Graef, N. H. Greenberg, J. S. Lin-Fu, E. P. Melia, S. Piomelli, J. R. Reigart, B. Robinson, J. W. Sayre, W. J. Sobolesky and M. Welcome, J. Kans. Med. Soc., 1992, 93, 358–359 Search PubMed.
  3. Y. Liu, Z. C. Liu, Y. Wang, J. D. Dai, J. Gao, J. M. Xie and Y. S. Yan, Microchim. Acta, 2011, 172, 309–317 CrossRef CAS.
  4. G. Yang, C. M. Zhang, Q. F. Hu and J. Y. Yin, J. Chromatogr. Sci., 2003, 41, 195–199 CAS.
  5. M. D. A. Korn, J. B. de Andrade, D. S. de Jesus, V. A. Lemos, M. L. S. F. Bandeira, W. N. L. dos Santos, M. A. Bezerra, F. A. C. Amorim, A. S. Souza and S. L. C. Ferreira, Talanta, 2006, 69, 16–24 CrossRef CAS PubMed.
  6. A. Schutz, I. A. Bergdahl, A. Ekholm and S. Skerfving, Occup. Environ. Med., 1996, 53, 736–740 CrossRef CAS PubMed.
  7. C. Tuerk and L. Gold, Science, 1990, 249, 505–510 CAS.
  8. A. D. Ellington and J. W. Szostak, Nature, 1990, 346, 818–822 CrossRef CAS PubMed.
  9. F. W. Kotch, J. C. Fettinger and J. T. Davis, Org. Lett., 2000, 2, 3277–3280 CrossRef CAS PubMed.
  10. C. W. Liu, C. C. Huang and H. T. Chang, Anal. Chem., 2009, 81, 2383–2387 CrossRef CAS PubMed.
  11. F. Li, Y. Feng, C. Zhao and B. Tang, Chem. Commun., 2011, 47, 11909–11911 RSC.
  12. L. Q. Guo, D. D. Nie, C. Y. Qiu, Q. S. Zheng, H. Y. Wu, P. R. Ye, Y. L. Hao, F. F. Fu and G. N. Chen, Biosens. Bioelectron., 2012, 35, 123–127 CrossRef CAS PubMed.
  13. T. Li, S. J. Dong and E. K. Wang, J. Am. Chem. Soc., 2010, 132, 13156–13157 CrossRef CAS PubMed.
  14. C. W. Liu, C. C. Huang and H. T. Chang, Anal. Chem., 2009, 81, 2383–2387 CrossRef CAS PubMed.
  15. A. I. Dragan, J. R. Casas-Finet, E. S. Bishop, R. J. Strouse, M. A. Schenerman and C. D. Geddes, Biophys. J., 2010, 99, 3010–3019 CrossRef CAS PubMed.
  16. X. Chen, H. L. Guan, Z. K. He, X. D. Zhou and J. M. Hu, Anal. Methods, 2012, 4, 1619–1622 RSC.
  17. X. B. Fu, F. Qu, N. B. Li and H. Q. Luo, Analyst, 2012, 137, 1097–1099 RSC.
  18. S. E. Wang and S. H. Si, Anal. Methods, 2013, 5, 2947–2953 RSC.
  19. X. H. Zhao, R. M. Kong, X. B. Zhang, H. M. Meng, W. N. Liu, W. Tan, G. L. Shen and R. Q. Yu, Anal. Chem., 2011, 83, 5062–5066 CrossRef CAS PubMed.
  20. X. B. Zhang, Z. D. Wang, H. Xing, Y. Xiang and Y. Lu, Anal. Chem., 2010, 82, 5005–5011 CrossRef CAS PubMed.
  21. T. Li, E. Wang and S. Dong, Anal. Chem., 2010, 82, 1515–1520 CrossRef CAS PubMed.
  22. D. Y. Liu, Y. Y. Xin, X. W. He and X. B. Yin, Analyst, 2011, 136, 479–485 RSC.
  23. Y. S. Wu, F. F. Huang and Y. W. Lin, ACS Appl. Mater. Interfaces, 2013, 5, 1503–1509 CAS.
  24. Y. Guo, J. T. Li, X. Q. Zhang and Y. L. Tang, Analyst, 2015, 140, 4642–4647 RSC.

This journal is © The Royal Society of Chemistry 2016
Click here to see how this site uses Cookies. View our privacy policy here.