Graphene enhanced low-density polyethylene by pretreatment and melt compounding†
Hong Leiab,
Zhuo Liua,
Chong Heab,
Shou-Chun Zhanga,
Ye-Qun Liua,
Cheng-Jie Huaac,
Xiao-Ming Lia,
Feng Liab,
Cheng-Meng Chen*a and
Rong Caiad
aKey Laboratory of Carbon Materials, Institute of Coal Chemistry, Chinese Academy of Sciences, Taiyuan 030001, P. R. China. E-mail: ccm@sxicc.ac.cn; Fax: +86-0351-4049061; Tel: +86-0351-4049061
bUniversity of Chinese Academy of Sciences, Beijing 100049, P. R. China
cSchool of Chemical Engineering and Technology, China University of Mining & Technology, Xuzhou 221116, P. R. China
dAcademy of Opto-Electronics, Chinese Academy of Sciences, Beijing 100094, P. R. China
First published on 11th October 2016
Abstract
The rational design and fabrication of structural-functional materials are development trends in materials science. Herein, graphene enhanced low-density polyethylene (LDPE) is prepared by pretreatment and melt compounding, which is a simple and eco-friendly method. The amount of graphene added is controlled from 0 to 0.8 wt% to explore the enhancement effects. The graphene/LDPE nanocomposites (LPGNs) are characterized via SEM, TEM, Raman spectra, XRD, TG-DTA and DSC to research their dispersion morphology, crystal structure and thermal stability. A DMA, Servo Universal Strength Tester and Izod Impact Test Machine were used to study their mechanical properties. The results show that the added graphene is dispersed uniformly in the LDPE matrix, and the crystallinity of the LPGNs increases. The high specific surface area and outstanding properties of graphene improve the thermal stability, storage modulus, and mechanical properties of the LPGNs. Compared with neat LDPE, the Te of the LPGN with 0.8 wt% graphene increased by 58 °C and its tensile strength increased to 138%. A low content of graphene was effective in optimizing the Tm, Te and flame retardant properties of the LPGNs without compromising their mechanical properties.
1 Introduction
Polymer materials have the characteristics of easy processing, light weight, low price, varied structures, and multi-functionality.1 Also, they have wide applications in the aviation industry, motor-dom, consumer electronics, packing field, etc. Among the available polymers, polyolefins stand out and are important commodity plastics. Polyolefins include high-density polyethylene (HDPE), low-density polyethylene (LDPE), and linear-low-density polyethylene (LLDPE). Among them, LDPE is widely used due to its low cost, good film-forming properties, excellent chemical stability, and nontoxicity.2,3 It should be noted that thermal stability, fire resistance, mechanical strength, and antistatic properties are important for materials in modern society.4–10 Composite polymers have better structures and functional properties than neat polymers. Nano-filler is one of the important additives to improve the properties of polymers, and the nanocomposites obtained are usually light weight with enhanced mechanical and specific functional properties. The high specific surface area of nano-fillers induces more interfacial contacts between the molecular chain and the fillers in nanocomposites, which generate complex interfacial morphologies when compared with the neat polymers.3Recently, graphene has gained revolutionary acclimation since its exfoliation in 2004.11 Graphene, as an efficient filler, has great potential applications due to its excellent electrical,12 thermal,13 and mechanical properties.14 The mechanical strength, flame retardancy, and thermal/electrical conductivity of polyamide,15 epoxy,16 polycarbonate17 and polystyrene18 are increased due to the presence of graphene. Sasha et al. added only 1 vol% of graphene to polystyrene by the solution mixing method, and the electrical conductivity of the nanocomposite increased to 1 S m−1.19 Wang et al. added 2 wt% of graphene to polyurethane via situ polymerization, and its tensile strength improved by 236%.20
The intrinsic performances of graphene are inhibited by aggregation which results from its high specific surface area and the strong van der Waals attraction between graphene sheets. Therefore, aggregation is the bottleneck that hinders the wide application of graphene. Chemical modification or in situ polymerization helps to increase the homogeneous dispersion of graphene in a matrix.1,6,21 Among them, the former is the commonly used method,22,23 and the modified graphene shows partial interfacial compatibility with polymers. However, chemical modification not only destroys the superior intrinsic property of graphene, but also requires the use of some poisonous reagents. Thus, in this method the interfacial compatibility and intrinsic properties are counterintuitive. In addition, the composite methods also include melt compounding and solution mixing.24,25 In previous references, graphene/polyolefins composites were prepared by the solution mixing of graphene and LDPE,2 HDPE,25 and LLDPE,26 using highly poisonous xylene or toluene as the solvent. In situ polymerization is an efficient method, however the process is complex. Compared with the above methods, melt compounding is eco-friendly and an easy process, and therefore is a potential method for the large-scale production of polymer composites.
Herein, we report graphene enhanced LDPE with increased mechanical and thermal stability. The compositing process was realized by premixing and melt compounding, in which the former contained the smashed LDPE particles, and the immersion of graphene in alcohol. These specially designed pretreatment procedures helped to form a homogenous mixture. Different amounts of graphene were added to research the enhancement effects, because the microstructure and properties of the composites are correlated with each other. Pre-processing in melt mixing offers a new approach to deal with other thermoplastic polymers, as well as for the realization of the large scale production of graphene/polymer nanocomposites.
2 Experimental
2.1 Materials
LDPE was purchased from Sinopec Maoming Company (P. R. China). Commercial graphene was provided by the Institute of Coal Chemistry, Chinese Academy of Sciences (P. R. China). Graphene was obtained by the thermal exfoliation of graphite oxide, which was prepared via a modified Hummers method,27 at 1000 °C. The graphene had a high specific surface area of 600 m2 g−1. Ethanol absolute was purchased from the Tianjin Fang Zheng Chemical Reagent Factory (P. R. China).2.2 Preparation of graphene/LDPE nanocomposites (LPGNs)
Before compounding, LDPE and graphene were preprocessed, separately. Commercial LDPE particles were crushed into small powders below 1 mm by high speed crushing in liquid nitrogen (Fig. 1a). Graphene was immersed in alcohol to form a dense suspension with the concentration of about 20 mg mL−1, and in order to prevent aggregation, the above suspension was sonicated by an ultrasonic cell disrupter at the power of 600 W for 15 min (Fig. 1b). The treated LDPE powders and the dense graphene suspension were mixed and mechanically stirred at 80 rpm for 5 min. Subsequently, the mixture was further melt mixed in a minilab kneader at 250 °C at the rotational speed of 80 rpm for 3–5 min. The purpose of this process was to remove most of the alcohol under a continuous flow of air. Then the compound was further mixed at 230 °C for 15 min at the same rotational speed under vacuum conditions, which further remove the residual alcohol, air bubbles, and prevent oxidation. After melt compounding, the mixture was left to cool down to room temperature, and was then broken into small powders by a grinder (Fig. 1a). For the performance characterization, the composite powders were hot pressed into plates at 180 °C for 20 min Fig. 1c shows the flat and dumbbell shaped test specimens of neat LDPE and LPGNs. The weight ratio of graphene in the LPGNs was controlled at 0, 0.2, 0.5, and 0.8 wt%, which corresponds to LDPE-0 wt% GN, LDPE-0.2 wt% GN, LDPE-0.5 wt% GN, LDPE-0.8 wt% GN, respectively.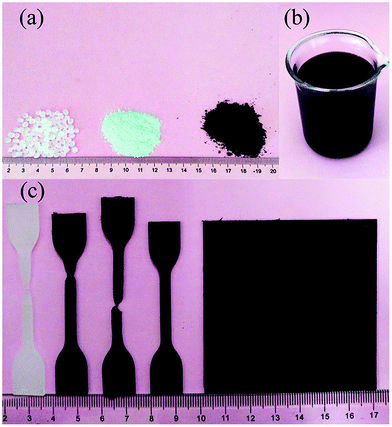 | ||
| Fig. 1 (a) Neat LDPE particles, LDPE powder and LPGNS powder after crushing. (b) Graphene/alcohol dense suspension. (c) Flat and dumbbell shaped test specimens of neat LDPE and the LPGNs. | ||
2.3 Characterization
The microstructures of the graphene were observed on a JSM-7001F (JEOL, Japan) scanning electron microscope (SEM) with the working voltage of 5 kV. An ULTRA 55 (Zeiss, Germany) scanning electron microscope (SEM) at an accelerating voltage of 1 kV was used to study the surface microstructures of neat LDPE and the LDPE-0.8 wt% GN powder, and the fracture surface of neat LDPE and LDPE-0.8 wt% GN were also studied under the same conditions. A JEM-200F (JEOL, Japan) transmission electron microscope (TEM) at an accelerating voltage of 200 kV was used to observe the structure of graphene and LDPE-0.8 wt% GN. LDPE-0.8 wt% GN ultrafine powders which were dispersed in alcohol by ultrasonication and collected by a standard TEM support film.Wide X-ray diffraction (XRD) patterns of neat LDPE and the LPGNs were obtained on a Bruker D2 phaser (Germany) with CuKα radiation (λ = 1.54 Å) under the voltage of 30 kV and current of 10 mA. Scanning was conducted in the range of 5° to 80° with the speed of 5° min−1. Raman spectra were recorded on a LabRAM HR800 Spectrometer (Horiba, Japan) using a 514 nm argon ion laser.
Thermal stability was characterized by an STA 409PC (Netzsch Geratebau GmbH, Germany) at air atmosphere with the heating rate of 10 °C min−1 from room temperature to 700 °C. Differential scanning calorimetry (DSC) experiments were carried out using a DSC 200F3 (Netzsch Geratebau GmbH, Germany). Every sample was heated from −40 °C to 160 °C with the increase in rate of 10 °C min−1 under a nitrogen atmosphere.
The dynamic mechanical analysis (DMA) was performed on TA Q800 DMA (TA Instruments, New Castle, Delaware, USA). The measurements were carried out at 1 Hz at the heating rate of 2 °C min−1 with the tension mode. Storage modulus, loss modulus and loss factor of neat LDPE and the LPGNs were obtained by increasing the temperature from room temperature to 120 °C.
Neat LDPE and the LPGNs were pressed into square plates with the dimensions of 70 × 70 mm at 180 °C and 5 MPa by a CMP4386 hot press machine. Stretching experiments and fatigue tests were conducted on a Servo Universal Strength Tester (Dongguan Huakai Testing Equipment Technology Co. Ltd, P. R. China). The testing speed of the tensile test was 100 mm min−1, and the testing speed of the fatigue test was 150 mm min−1 with the cycle period of 1 s. Dumbbell-shaped specimens, with the model dimensions of 4 × 75 mm and average thickness of 1.5 mm, were cut by a manual sheet punching machine. Notched impact testing was conducted on an XJUD-5.5 cantilever beam impact testing machine (Jing Instrument Manufacturing Co. Ltd, P. R. China). The sample size was 63.5 × 12.7 mm with the thickness of 3.2 mm and the notch depth was 2.5 mm.
3 Results and discussion
3.1 Characterization of graphene, neat LDPE and LPGNs
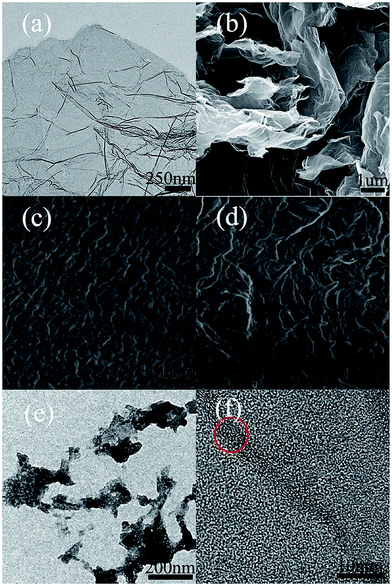
Fig. 2a and b show the TEM and SEM images of graphene, which confirm the full exfoliation of graphite oxide at 1000 °C. The graphene sheets had some wrinkles on the surface. This special surface structure helps to reduce aggregation, and facilitated its interactions with the polymer matrix.28,29 Fig. 2c and d show the surface morphology of neat LDPE and LDPE-0.8 wt% GN powder by SEM using the SE model. Compared with Fig. 2c, the wrinkle structure and apparent orientation are presented more obviously in Fig. 2d. The changed microstructure results from the effect of graphene on crystallinity. The different microscopic morphologies are correlated with its mechanical properties. Moreover, graphene fragments are uniformly dispersed in the matrix, since there is no obvious aggregation in the TEM images (Fig. 2e). The clear lattice fringes in Fig. 2f prove the dispersion of graphene in the matrix, and the red circle marks the lattice fringe of multilayer graphene.XPS and elemental analysis show that the graphene contains residual oxygen functional groups, and the C/O ratio of the graphene is 7.7. The typical C 1s survey spectra of graphene are shown in Fig. S1 and Table S1.† The residual oxygen functional groups of graphene contribute to its dispersion in ethanol.
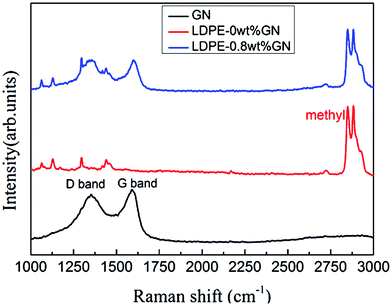
Fig. 3 shows the Raman spectra of graphene, neat LDPE and LDPE-0.8 wt% GN. In the Raman spectra of graphene, a defect structure (D peak) at 1355 cm−1 and in-phase vibration of sp2 carbon atoms (G peak) at 1590 cm−1 were observed. The 2D band of graphene, which was prepared by the oxidation and reduction method, disappeared due to the high disorder and defects of the graphene. Our graphene was obtained by thermal reduction from graphite oxide at 1000 °C and the disappearance of the 2D peak is consistent with previous reports.30 The major characteristic peaks of the chemical bonds in polyethylene are C–C stretching at 1067 cm−1 and 1128 cm−1, CH2 twisting at 1295 cm−1, CH2 blending at 1441 cm−1 and C–H (methyl) stretching vibration at 2800–2900 cm−1. The polyethylene branch chain can be reflected by the presence of a methyl group. The Raman spectrum of LDPE-0.8 wt% GN contained the characteristic peaks of graphene and neat LDPE which illustrate the good combination of the two materials.
3.2 Crystallinity of LPGNs
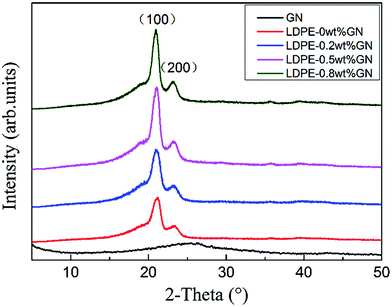
Some polymers exist in the crystalline state, since their molecular chain can be stretched and closely arranged in parallel. Polyethylene (PE) is a typical orthorhombic crystalline polymer. Crystallization characters (including crystallization temperature, crystallite size, and crystallinity) have an important influence on the melting point, physical properties, and mechanical strength of the polymer.31 Therefore, it is essential to research the crystallinity changes of neat LDPE and the LPGNs.Fig. 4 shows the XRD patterns of graphene, neat LDPE, and the LPGNs with 0.2, 0.5, 0.8 wt% of graphene. No obvious peaks appeared in the XRD pattern of graphene, which indicates that the graphite oxide was fully exfoliated. However, the high specific surface area led to the restacking of the graphene sheets, and this phenomenon is reflected in the wide and weak diffraction peak at around 26°. The peak at 26° corresponds to the (002) of graphite.32 The two peaks at 2θ = 20.96° and 23.21° are assigned to the (110) and (200) lattice planes of PE in the composites.33 With an increase in the content of graphene, the intensity of the diffraction peak becomes stronger, thus the addition of graphene helped to improve the crystallinity of the LPGNs.
In order to further describe the crystallite size and crystallinity of the LPGNs, two approximate formulae were used: the Scherrer formula (eqn (1)) and area approximate formula (eqn (2)).34
 | (1) |
 | (2) |
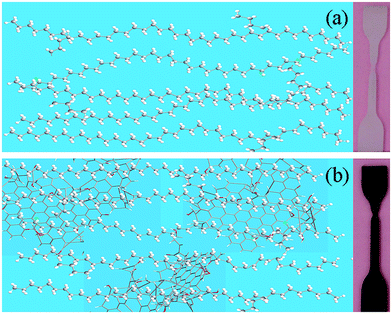
In eqn (1), D is the grain size of the crystal in the normal direction, β (rad) is the half height width of the crystalline peak, θ (rad) is the Bragg angle, and λ is the wavelength (0.154 nm for Cu), respectively. In eqn (2), Xc is the crystallinity, and Sc and Sa are the areas of the crystalline and amorphous regions, respectively. β (rad), Sc and Sa were fitted with the Jade5 software. Table 1 shows the detailed crystallization parameters of the LPGNs. Compared with neat LDPE, both the crystallite size and crystallinity of the LPGNs were increased. Peak 1 (110) and peak 2 (200) of LDPE-0.5 wt% GN were sharper than that of neat LDPE (Fig. 4). The addition of graphene not only improved the crystallinity, but also optimized the local lattice order of the LPGNs.35 Fig. 5 shows this change schematically. The crystal orientation of the LPGNs is ascribed to the fact that they have more ordered molecular chains (Fig. 5b) than neat LDPE (Fig. 5a).
| Sample | Peak angle (2θ1) | Peak angle (2θ2) | Crystallite size (nm) at 2θ1 | Crystallite size (nm) at 2θ2 | Crystallinity Xc (%) |
|---|---|---|---|---|---|
| LDPE-0 wt% GN | 21.19 | 23.45 | 9.95 | 7.38 | 34.12 ± 0.58 |
| LDPE-0.2 wt% GN | 21.10 | 23.33 | 9.48 | 7.64 | 40.40 ± 2.14 |
| LDPE-0.5 wt% GN | 21.08 | 23.27 | 11.33 | 10.60 | 44.99 ± 1.93 |
| LDPE-0.8 wt% GN | 20.96 | 23.21 | 11.70 | 10.95 | 44.20 ± 0.60 |
In addition to XRD, DSC is also used for analyzing the crystallinity of polymers. The melting enthalpy of a polymer is proportional to its crystallinity. High crystallinity corresponds to an increased melting enthalpy. The crystalline fractions of neat LDPE and the LPGNs were calculated using the following formula (eqn (3)):
 | (3) |
 | (4) |
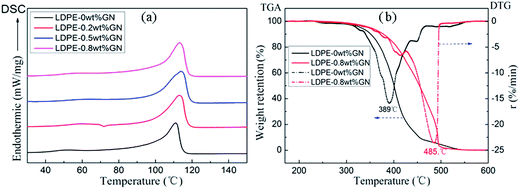 | ||
| Fig. 6 (a) DSC curves of neat LDPE and LPGNs with different graphene contents. (b) TGA-DTG curves of neat LDPE and LDPE-0.8 wt% GN. | ||
In this formula, Tm and T0m are melting points corresponding to the lamellae thickness with l and infinite, respectively, Δh is the melting heat of unit volume, and σe is the surface energy. Lamellae thickness is proportional to the normal direction of the grain size. Therefore, the larger grain size leads to the higher Tm of the LPGNs. In order to describe the change of crystallization in detail, the Tm, ΔH and crystallinity (Xc) of neat LDPE and the LPGNs by DSC are presented in Table 2.
| Sample | Tm (°C) | ΔH (J g−1) | Crystallinity Xc (%) |
|---|---|---|---|
| LDPE-0 wt% GN | 111.1 | 96.0 | 32.70 |
| LDPE-0.2 wt% GN | 113.0 | 108.3 | 36.89 |
| LDPE-0.5 wt% GN | 114.0 | 116.2 | 39.66 |
| LDPE-0.8 wt% GN | 113.8 | 115.5 | 39.34 |
The XRD and DSC results show that the crystallinity of the LPGNs increases with an increase in graphene content. The recrystallization of LDPE during hot pressing included a spontaneous process and second phase induced process, while the heterogeneous nucleating process accelerated the crystallization by providing crystal seeds and increasing the crystallization rate.25 Nucleation and growth rate are key parameters for crystallization. The heterogeneous nucleating process saved nucleation time and increased the growth rate, and the faster crystallization rate led to a larger grain size. Nano-fillers are efficient nucleating agents. They provide rich nucleation sites for polymer crystallization, which is common in CNTs/PE,36 nanoclay/PE,37 graphene/PE,25 etc. In a certain range, the higher the graphene content, the more heterogeneous nucleation occurs. The crystallinity was improved obviously, as presented in Tables 1 and 2. It is important to note that aggregation behavior becomes more obvious with the addition of too much graphene, which makes no contribution to improve crystallinity.
3.3 Thermal stability of the LPGNs
The thermal oxygen stability of the LPGNs was evaluated by thermal gravimetric analysis (TGA) in air atmosphere. Air atmosphere helps to evaluate the thermal stability of LDPE in the practical application environment, and it also contributes to the study of flame retardancy of LPGNs.Fig. 6b describes the thermal decompose process (TGA) and the decompose loss rate (DTG) of neat LDPE and LDPE-0.8 wt% GN. Before the initial temperature (Ti), the weight of LDPE-0.8 wt% GN presents a slight increase of about 0.25% because of oxidation. The Ti increases from 247 °C for neat LDPE to 257 °C for LDPE-0.8 wt% GN. The extrapolated onset temperature (Te) is the characteristic temperature in TGA for estimating the thermal stability of materials. The Te of neat LDPE and the LPGNs can be obtained from Fig. S2.† They were 357.4 °C, 407.9 °C, 408.5 °C and 415.4 °C for LDPE-0 wt% GN, LDPE-0.2 wt% GN, LDPE-0.5 wt% GN, and LDPE-0.8 wt% GN, respectively. Compared with the Te of neat LDPE, the Te of LDPE-0.8 wt% GN increased by 58 °C. It is noteworthy that the spontaneous ignition temperature of PE is about 350 °C, which is approximate to the Te of neat LDPE. The Te can indirectly predict the ignition of LDPE in air. Therefore, LDPE-0.8 wt% GN shows better flame retardancy than neat LDPE.
The position and intensity of the peaks in the DTG curves give more detailed information. The temperature with maximum mass loss rate (Tr) is given in Fig. 6b. The Tr increased from 389 °C to 485 °C when the amount of graphene increased from 0 to 0.8 wt%. The sharp peaks of the DTG curves indicate that maximum mass loss occurred. The Tr was delayed by 96 °C for LDPE-0.8 wt% GN, which is more obvious than the previous reported value.24 Chain scission reactions occur simultaneously with the oxidation reaction when the composite undergoes oxidation in air. Most of the alkyl radicals from the scission reactions immediately react with oxygen to decompose into small molecules in neat LDPE. The weight loss of LDPE-0.8 wt% GN in air is larger than that of neat LDPE due to the homogeneous dispersion of graphene. Dispersed graphene, as small rooms, separate the alkyl radicals, and many radicals become relatively isolated in the LPGNs.38 The weak characteristic peak temperature in the DTG curve of LDPE-0.8 wt% GN is close to the Te, which is because the oxygen reaction with the surface radicals was strong. The oxygen concentration decreased with depth in the sample, because graphene, which has ultra-low gas permeability property, worked as a barrier to hinder the diffusion of oxygen.39 Besides, the dispersed graphene in the composite captured some free radicals generated by the chain breaking of the polymer during the chain scission reactions, thus the decomposition rate was reduced.25
3.4 Mechanical properties of the LPGNs
For thermal mechanical analysis, DMA is considered to be an indispensable measuring technique. Modulus and loss factor (tan![[thin space (1/6-em)]](https://www.rsc.org/images/entities/char_2009.gif) δ) offer effective information for the end-application of composites, and they are applied to predict the controlled process behavior.40
δ) offer effective information for the end-application of composites, and they are applied to predict the controlled process behavior.40
Fig. 7a–c show the plots of storage modulus (E′), loss modulus (E′′), and loss factor (tan![[thin space (1/6-em)]](https://www.rsc.org/images/entities/char_2009.gif) δ) versus temperature for neat LDPE and the LPGNs. The storage modulus at 50 °C increased from 208 MPa (for LDPE-0 wt% GN) to 284 MPa (for LDPE-0.8 wt% GN), meanwhile the loss modulus increased from 35.6 MPa (for LDPE-0 wt% GN) to 46.6 MPa (for LDPE-0.8 wt% GN). Uniformly dispersed graphene worked as a reinforcing filler in the composite. It decreased the chain mobility of LDPE, and increased its comprehensive viscoelasticity. Graphene improved the tan
δ) versus temperature for neat LDPE and the LPGNs. The storage modulus at 50 °C increased from 208 MPa (for LDPE-0 wt% GN) to 284 MPa (for LDPE-0.8 wt% GN), meanwhile the loss modulus increased from 35.6 MPa (for LDPE-0 wt% GN) to 46.6 MPa (for LDPE-0.8 wt% GN). Uniformly dispersed graphene worked as a reinforcing filler in the composite. It decreased the chain mobility of LDPE, and increased its comprehensive viscoelasticity. Graphene improved the tan![[thin space (1/6-em)]](https://www.rsc.org/images/entities/char_2009.gif) δ value, which showed little variation with different nano-filler contents (Fig. 7c). Since the storage modulus of the crystalline phase is higher than that in the amorphous phase, the higher crystallinity of the LPGNs illustrates their higher storage modulus.31 When the temperature increased to Tm, the crystal phase turned into an amorphous phase quickly, which resulted in a simultaneous decrease in storage modulus. However, the loss modulus decreased relatively slower at high temperature, thus tan
δ value, which showed little variation with different nano-filler contents (Fig. 7c). Since the storage modulus of the crystalline phase is higher than that in the amorphous phase, the higher crystallinity of the LPGNs illustrates their higher storage modulus.31 When the temperature increased to Tm, the crystal phase turned into an amorphous phase quickly, which resulted in a simultaneous decrease in storage modulus. However, the loss modulus decreased relatively slower at high temperature, thus tan![[thin space (1/6-em)]](https://www.rsc.org/images/entities/char_2009.gif) δ(E′′/E′) showed a high value for LDPE-0.8 wt% GN around Tm.
δ(E′′/E′) showed a high value for LDPE-0.8 wt% GN around Tm.
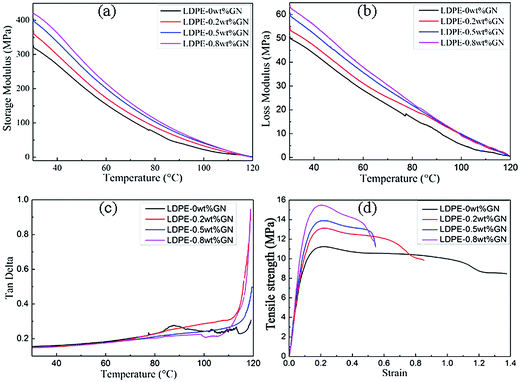 | ||
Fig. 7 (a) Storage modulus, (b) loss modulus, and (c) loss factor (tan![[thin space (1/6-em)]](https://www.rsc.org/images/entities/char_2009.gif) δ) curves. (d) Tensile curves of neat LDPE and LPGNs with different graphene contents. δ) curves. (d) Tensile curves of neat LDPE and LPGNs with different graphene contents. | ||
Tensile strength is one of the most important mechanical properties of polymers. Characterization of the fractured surface after tensile testing helps to understand the interaction between LDPE and the filler. Fig. 8 shows the SEM images of the fracture surfaces for neat LDPE and LDPE-0.8 wt% GN. The fractured surface of neat LDPE is slightly bumpy (Fig. 8a), and exhibits a perpendicular orientation to the stretching direction. However, the orientation is parallel to the stretching direction for LDPE-0.8 wt% GN. Folded lamellar graphene can be observed in high resolution SEM image of LDPE-0.8 wt% GN, which is marked with red arrows.
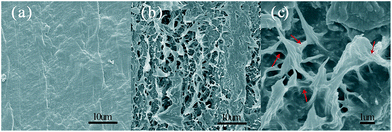 | ||
| Fig. 8 (a) SEM image of the fracture surface of neat LDPE. (b and c) SEM images of the fractured surface for LDPE-0.8 wt% GN. | ||
LDPE is a typical ductile material, which is characterized by relatively low tensile strength (TS), yield stress (YS), elastic modulus (EM) and high elongation at break (EB). Tensile strength divided by the corresponding cross section area gives the yield stress. Elastic modulus was calculated from the slope of the initial straight line in Fig. 7d, and elongation at break was calculated from the strain multiplied by 100%. The yield point is used to describe the deformation of a material. Poor mechanical strength restricts the extensive application of neat LDPE. Fig. 7d shows the tensile behavior of neat LDPE and the LPGNs with different graphene contents. In addition, the mechanical strength of LPGNs with premixing has a more significant advantage than normal melt processing (Fig. S3†). The tensile strength increased by 38% from 11.24 MPa to 15.48 MPa, and the elastic modulus increased by 57% from 82.8 MPa to 130.4 MPa for LDPE-0.8 wt% GN. The yield strain of the four yield points changed very little, and the difference of the yield point of the four curves is mainly reflected in the different maximum yield stress. The high yield stress of the LPGNs makes these composites more secure in the use of high strength. When the material is subjected to large stress or deformation, it would yield and absorb a large amount of energy, therefore it could withstand large deformation and impact without being destroyed.
In our study each experiment was repeated four times under the same conditions, and the specific mechanical parameters obtained are shown in Table 3. The interactions between graphene and the LDPE matrix restrain the movement and slippage of the LDPE chain, and increase the tensile strength of the LPGNs. Graphene easily becomes wrinkled due to its high surface energy. When an external force is applied to the LPGNs, the wrinkles can adapt to the external force by folding themselves rather than moving strongly in the micro-scale. Therefore, this load transfer property of graphene increases the structural stability of the LPGNs. Elongation at break decreases with an increase in tensile strength, because toughness and strength are often the opposite.41 Another reason for the poor elongation at break is that graphene may cause some defects and partly break the LDPE molecular chain. In our research, tensile strength and elongation at break became poor when the graphene content exceeded 1 wt%. Too much graphene introduces defects in the matrix. The mechanical properties of the polymer are also related to its crystallinity. High crystallinity enhances the intermolecular force, thus tensile strength increases. However, the elongation at break decreases. The change regularity of the mechanical properties is consistent with the increased crystallinity of the LPGNs.31
| Sample | TS (MPa) | YS (N) | EM (MPa) | EB (%) |
|---|---|---|---|---|
| LDPE-0 wt% GN | 11.24 ± 0.80 | 66.12 ± 4.70 | 82.8 ± 4.3 | 129.0 ± 8.0 |
| LDPE-0.2 wt% GN | 13.10 ± 0.20 | 77.24 ± 1.20 | 98.8 ± 4.5 | 89.5 ± 5.0 |
| LDPE-0.5 wt% GN | 13.90 ± 0.10 | 81.76 ± 0.60 | 103.6 ± 7.0 | 62.5 ± 9.0 |
| LDPE-0.8 wt% GN | 15.48 ± 0.30 | 91.06 ± 1.80 | 130.4 ± 8.8 | 47.5 ± 7.0 |
Fatigue data is used for the evaluation of materials, but it has been rarely reported in previous references. We researched the fatigue strength of LPGNs with different graphene contents. Each sample was measured three times with controlled load stress at 9 MPa, 6 MPa, and 4 MPa. Cycle times (N) are the average of the three tests, then the logarithm of N is taken, in other words, lg![[thin space (1/6-em)]](https://www.rsc.org/images/entities/char_2009.gif) N. Detailed information about N and lg
N. Detailed information about N and lg![[thin space (1/6-em)]](https://www.rsc.org/images/entities/char_2009.gif) N are shown in Tables S2 and S3.† Fatigue life (lg
N are shown in Tables S2 and S3.† Fatigue life (lg![[thin space (1/6-em)]](https://www.rsc.org/images/entities/char_2009.gif) N vs. σmax) curves (Fig. 9a) show the relationship between fatigue strength and fatigue life. Tables S2 and S3† and the fatigue life curves show that with an increase in graphene content, the fatigue life of the reinforced LDPE increases. In the case of a larger load, the increased tendency of fatigue life is more obvious by the added graphene. The addition of relatively more graphene improves the fatigue life of the LPGNs more significantly, because more graphene in the composites have a more apparent blocking effect in the fatigue crack propagation process.
N vs. σmax) curves (Fig. 9a) show the relationship between fatigue strength and fatigue life. Tables S2 and S3† and the fatigue life curves show that with an increase in graphene content, the fatigue life of the reinforced LDPE increases. In the case of a larger load, the increased tendency of fatigue life is more obvious by the added graphene. The addition of relatively more graphene improves the fatigue life of the LPGNs more significantly, because more graphene in the composites have a more apparent blocking effect in the fatigue crack propagation process.
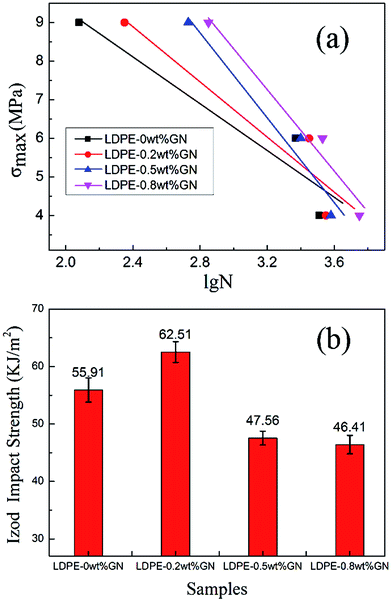 | ||
| Fig. 9 (a) Fatigue life curves of neat LDPE and LPGNs with different graphene contents. (b) Impact strength of neat LDPE and LPGNs with different graphene contents. | ||
Impact property is also an important index to evaluate the brittleness and ductile degree of materials. Compared with neat LDPE, the Izod impact strength of LDPE-0.8 wt% GN decreased by 26%, which resulted from the reduced ductility of the composite by the addition of graphene (Fig. 9b). Meanwhile, the crystallinity LDPE-0.8 wt% GN is relatively high, which leads to brittleness and causes a lower impact strength. It is interesting that LDPE-0.2 wt% GN has the highest impact strength. This is because the crystallinity of LDPE-0.2 wt% GN is lower than LDPE-0.5 wt% GN and LDPE-0.8 wt% GN, and graphene is distributed more homogeneously in the composite when the graphene content is low at 0.2 wt%. Therefore, when the composite meets a sudden impact, the strong and tough graphene filler transfers the strain to the LDPE matrix and the unfolded graphene sheets absorb some of the energy by changing their morphology.33
4 Conclusion
We report a simple, environment-friendly, and easily amplified method to prepare graphene enhanced LDPE. Graphene was incorporated into LDPE by pre-dispersion and melt compounding. The obtained graphene/LDPE nanocomposites (LPGNs) show high crystallinity, good thermal stability, increased mechanical properties, and flame retardance. The crystallinity and thermal stability of the LPGNs are significantly increased by the addition of 0.8 wt% graphene. The Te and Tr increased by 58 °C and 96 °C, respectively. Besides, this work studied the effect of crystallinity on the higher Tm, better tensile strength and higher storage modulus of the LPGNs. The high storage modulus and loss modulus of the LPGNs demonstrate that graphene improves the comprehensive viscoelasticity of LDPE. When the content of graphene is 0.8 wt%, the tensile strength, elastic modulus and fatigue life of the LPGNs are significantly improved. This specially designed procedure provides a new approach to prepare graphene/thermoplastic polymer composites.Acknowledgements
The authors are grateful to Prof. Qi-Feng Li for his help with the DMA testing. We acknowledge the financial support from the National Science Foundation of China (No. 51402324, 51402325, 51302281), and the Natural Science Foundation of Shanxi Province (2015021077, 2013011012-7).References
- H. J. Salavagione, G. Martinez and G. Ellis, Macromol. Rapid Commun., 2011, 32, 1771–1789 CrossRef CAS PubMed.
- H.-D. Huang, S.-Y. Zhou, P.-G. Ren, X. Ji and Z.-M. Li, RSC Adv., 2015, 5, 80739–80748 RSC.
- A. U. Chaudhry and V. Mittal, Polym. Eng. Sci., 2013, 53, 78–88 CAS.
- S. Ran, Z. Guo, L. Han and Z. Fang, Polym. Int., 2014, 63, 1835–1841 CrossRef CAS.
- M.-T. Le and S.-C. Huang, Materials, 2015, 8, 5526–5536 CrossRef.
- Y. Qian, H. Wu, D. Yuan, X. Li, W. Yu and C. Wang, J. Appl. Polym. Sci., 2015, 132, 42724–42734 Search PubMed.
- S. Chen, S. Lv, G. Hou, L. Huo and J. Gao, J. Appl. Polym. Sci., 2015, 132, 42637–42648 Search PubMed.
- F. Wang, Y. Zhang, B. B. Zhang, R. Y. Hong, M. R. Kumar and C. R. Xie, Composites, Part B, 2015, 83, 66–74 CrossRef CAS.
- P. P. Kundu, J. Biswas, H. Kim and S. Choe, Eur. Polym. J., 2003, 39, 1585–1593 CrossRef CAS.
- J. Du, L. Zhao, Y. Zeng, L. Zhang, F. Li, P. Liu and C. Liu, Carbon, 2011, 49, 1094–1100 CrossRef CAS.
- K. S. Novoselov, A. K. Geim, S. V. Morozov, D. Jiang, Y. Zhang, S. V. Dubonos, I. V. Grigorieva and A. A. Firsov, Science, 2004, 306, 666–669 CrossRef CAS PubMed.
- A. H. Castro Neto, F. Guinea, N. M. R. Peres, K. S. Novoselov and A. K. Geim, Rev. Mod. Phys., 2009, 81, 109–162 CrossRef CAS.
- A. A. Balandin, S. Ghosh, W. Z. Bao, I. Calizo, D. Teweldebrhan, F. Miao and C. N. Lau, Nano Lett., 2008, 8, 902–907 CrossRef CAS PubMed.
- C. Lee, X. D. Wei, J. W. Kysar and J. Hone, Science, 2008, 321, 385–388 CrossRef CAS PubMed.
- H. Fukushima, L. T. Drzal, B. P. Rook and M. J. Rich, J. Therm. Anal. Calorim., 2006, 85, 235–238 CrossRef CAS.
- A. Yu, P. Ramesh, M. E. Itkis, E. Bekyarova and R. C. Haddon, J. Phys. Chem. C, 2007, 111, 7565–7569 CAS.
- C. W. M. Hyunwoo Kim, Polymer, 2009, 50, 3797–3809 CrossRef.
- H. Hu, X. Wang, J. Wang, L. Wan, F. Liu, H. Zheng, R. Chen and C. Xu, Chem. Phys. Lett., 2010, 484, 247–253 CrossRef CAS.
- S. Stankovich, D. A. Dikin, G. H. B. Dommett, K. M. Kohlhaas, E. J. Zimney, E. A. Stach, R. D. Piner, S. T. Nguyen and R. S. Ruoff, Nature, 2006, 442, 282–286 CrossRef CAS PubMed.
- X. Wang, Y. Hu, L. Song, H. Yang, W. Xing and H. Lu, J. Mater. Chem., 2011, 21, 4222–4227 RSC.
- D. Cai and M. Song, J. Mater. Chem., 2010, 20, 7906–7915 RSC.
- Y.-J. Park, S. Y. Park and I. In, J. Ind. Eng. Chem., 2011, 17, 298–303 CrossRef CAS.
- Y. Wang, H. F. Zhan, Y. Xiang, C. Yang, C. M. Wang and Y. Y. Zhang, J. Phys. Chem. C, 2015, 119, 12731–12738 CAS.
- D. Yan, H.-B. Zhang, Y. Jia, J. Hu, X.-Y. Qi, Z. Zhang and Z.-Z. Yu, ACS Appl. Mater. Interfaces, 2012, 4, 4740–4745 CAS.
- S. Cheng, X. Chen, Y. G. Hsuan and C. Y. Li, Macromolecules, 2012, 45, 993–1000 CrossRef CAS.
- T. Kuila, S. Bose, C. E. Hong, M. E. Uddin, P. Khanra, N. H. Kim and J. H. Lee, Carbon, 2011, 49, 1033–1037 CrossRef CAS.
- C.-M. Chen, Q. Zhang, M.-G. Yang, C.-H. Huang, Y.-G. Yang and M.-Z. Wang, Carbon, 2012, 50, 3572–3584 CrossRef CAS.
- T. Ramanathan, A. A. Abdala, S. Stankovich, D. A. Dikin, M. Herrera-Alonso, R. D. Piner, D. H. Adamson, H. C. Schniepp, X. Chen, R. S. Ruoff, S. T. Nguyen, I. A. Aksay, R. K. Prud'homme and L. C. Brinson, Nat. Nanotechnol., 2008, 3, 327–331 CrossRef CAS PubMed.
- M. A. Rafiee, J. Rafiee, Z. Wang, H. Song, Z.-Z. Yu and N. Koratkar, ACS Nano, 2009, 3, 3884–3890 CrossRef CAS PubMed.
- S. Claramunt, A. Varea, D. Lopez-Diaz, M. M. Velazquez, A. Cornet and A. Cirera, J. Phys. Chem. C, 2015, 119, 10123–10129 CAS.
- M. He, H. Zhang, W. Chen and X. Dong, Polymer Physics, FuDan Press, Shang Hai, 2013 Search PubMed.
- Z. Q. Li, C. J. Lu, Z. P. Xia, Y. Zhou and Z. Luo, Carbon, 2007, 45, 1686–1695 CrossRef CAS.
- P. Wei and S. Bai, RSC Adv., 2015, 5, 93697–93705 RSC.
- C. Zhu, Structural Analysis of Polymer, Science Press, Bei Jing, 2004 Search PubMed.
- A. M. Hindeleh and D. J. Johnson, Polymer, 1978, 19, 27–32 CrossRef CAS.
- R. Haggenmueller, J. E. Fischer and K. I. Winey, Macromolecules, 2006, 39, 2964–2971 CrossRef CAS.
- T. G. Gopakumar, J. A. Lee, M. Kontopoulou and J. S. Parent, Polymer, 2002, 43, 5483–5491 CrossRef CAS.
- B. Yeom, Y. J. Yu, H. A. McKellop and R. Salovey, J. Polym. Sci., Part A: Polym. Chem., 1998, 36, 329–339 CrossRef CAS.
- J. S. Bunch, S. S. Verbridge, J. S. Alden, A. M. van der Zande, J. M. Parpia, H. G. Craighead and P. L. McEuen, Nano Lett., 2008, 8, 2458–2462 CrossRef CAS PubMed.
- R. E. Wetton, R. D. L. Marsh and J. G. Vandevelde, Thermochim. Acta, 1991, 175, 1–11 CrossRef CAS.
- Z. Chen and H. Lu, J. Mater. Chem., 2012, 22, 12479–12490 RSC.
Footnote |
| † Electronic supplementary information (ESI) available. See DOI: 10.1039/c6ra15702e |
| This journal is © The Royal Society of Chemistry 2016 |

