Honglei Li,
Shichao Zhang*,
Xin Wei,
Puheng Yang,
Zhixu Jian and
Juan Meng
School of Materials Science and Engineering, Beihang University, Beijing 100191, PR China. E-mail: csc@buaa.edu.cn; Fax: +86 01082339319; Tel: +86 01082338148
First published on 15th August 2016
Lithium-rich layered Li1.2Ni0.13Co0.13Mn0.54O2 cathode materials have been successfully fabricated by a glucose-assisted combustion method combined with a calcination treatment. The effect of the amount of glucose fuel on the properties of the prepared materials is investigated by X-ray diffraction, scanning electron microscopy, X-ray photoelectron spectroscopy and electrochemical measurements. The results show that the nano-sized cathode material obtained at a fuel ratio of φ = 1 exhibits uniform fine well-crystallized particles with the largest specific surface area, leading to excellent cyclic capability and rate performance. It delivers the highest initial discharge capacity of 280.5 mA h g−1 with a capacity retention of 84% after 50 cycles at 0.1C (25 mA g−1). Besides, after cycling at an increasing rate from 0.2C to 3C, the electrode retained 90.3% (230.2 mA h g−1) of the initial discharge capacity when the rate was recovered back to 0.2C.
Li-rich layered cathode materials, mostly described as a solid solution between layered Li2MnO3 and LiMO2 (M = Ni, Co, Mn, etc.), have attracted much attention for their high specific capacity, increased energy density and relatively lower cost compared with layered LiCoO2.4–6 For example, 0.5 Li2MnO3·0.5 LiMn1/3Ni1/3Co1/3O2, which is equivalent to Li1.2Ni0.13Co0.13Mn0.54O2, can deliver a large capacity exceeding 250 mA h g−1 with an average operating voltage of about 3.5 V (vs. Li/Li+).7–9 However, there are still several intrinsic problems such as (1) oxygen release during first charge, (2) high first cycle irreversible capacity loss (IRC), (3) substantial voltage decay and (4) poor rate capability mainly induced by the insulating Li2MnO3 component, which have hindered the real application of Li-rich cathode materials.10–12
It is well understood that the synthetic route is a main factor for the electrochemical performance of the cathode materials.13–16 Low temperature combustion synthesis (LCS), based on a highly exothermic oxidation–reduction reaction between metal salts and organic fuels,16,17 has been successfully used to synthesize various cathode materials for LIBs, such as LiMn2O4,18 LiMn1.5Ni0.5O4,17,19,20 LiNi1/3Co1/3Mn1/3O2,21 LiVO3,22 etc. The obtained powder shows nanometric particle size and improved electrochemical performance. Recently, several reports have been concerned with this method to prepare Li-rich cathode materials. Different carbonaceous compounds, such as alcohol,23 sucrose,24 gelatin25 and mannitol,26 have been used as fuels. However, the effect of organic fuel amount on the morphology, crystallinity and electrochemical property of the product has not been investigated comprehensively.
In this paper, the Li-rich cathode materials Li1.2Ni0.13Co0.13Mn0.54O2 were successfully prepared via a glucose-assisted combustion synthesis followed by calcination. Herein, nitrate serves as oxidizer, while glucose plays the role of fuel and complexing agent. The structure, morphology, particle size distribution and electrochemical properties of the Li1.2Ni0.13Co0.13Mn0.54O2 compounds synthesized with different fuel-to-oxidizer ratios were thoroughly investigated.
1.2LiNO3 + 0.13Ni(NO3)2 + 0.54Mn(NO3)2 + 0.13Co(NO3)2 + nC6H12O6 → Li1.2Ni0.13Co0.13Mn0.54O2 + gases evolved |
![]() | ||
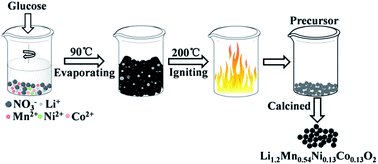
Fig. 1 Schematic illustration of glucose-assisted combustion method for Li1.2Ni0.13Co0.13Mn0.54O2 materials. |
According to this equation, the combustion process should be a redox type of reaction, in which nitrates act as oxidant and glucose acts as fuel. Furthermore, the atoms H, C, Li, Ni, Co and Mn are considered with valencies +1(H), +4(C), +1(Li), +2(Ni), +2(Co) and +2(Mn), respectively. The oxygen atom is considered as an oxidizing agent with a valency of −2 and nitrogen atom is taken as neutral with a valency of 0. Therefore, the oxidizing valency of LiNO3 is −5, that of Ni(NO3)2, Mn(NO3)2 and Co(NO3)2 is −10, while the reducing valency of the fuel glucose is +24. And the fuel-to-oxidizer ratio (φ) is defined as the ratio between the total valencies of the fuels and nitrate oxidizers of the components.17,20,27
During the synthesis, stoichiometric amount of LiNO3, Ni(NO3)2·6H2O, Mn(NO3)2 and Co(NO3)2·6H2O according to the element ratio of Li1.2Ni0.13Co0.13Mn0.54O2 were sufficiently dissolved in distilled water to form nitrate solution, and 5% excess LiNO3 was added to compensate for possible loss during calcination. Then different amount of glucose was added with organic fuel to oxidizer ratios (φ) of 0.75, 1.0, 1.25 and 1.5. The mixtures were stirred and evaporated at 90 °C to obtain a swelled gel, and then ignited at 200 °C in air. The combustion reaction lasted for about 2–3 min to obtain brown precursors named as S75-P, S100-P, S125-P, S150-P, respectively. Finally, the brown ash was calcined orderly at 450 °C for 3 h, 900 °C for 12 h in ambient atmosphere and subsequently cooled naturally in the furnace to get the layered Li1.2Ni0.13Co0.13Mn0.54O2. The synthesized oxides were named as S75, S100, S125 and S150 for short.
The working electrode was prepared by a slurry coating procedure. The slurry was formed by mixing Li1.2Ni0.13Co0.13Mn0.54O2, carbon black and polyvinylidene fluoride (PVDF) with a weight ratio of 8:
1
:
1 and was coated on to an aluminum foil. After drying in an oven at 120 °C for 8 h, the sample was pressed and weighed. The loading of the active material was controlled between 3 and 4 mg cm−2, with thickness of about 20 μm. The CR2025 coin-type cells were assembled inside a glove box full of high-purity argon, using 1 M LiPF6 in 1
:
1 ethylene carbonate (EC)/dimethyl carbonate (DMC) as electrolyte. Cells were cycled galvanostatically at various C rates for the charge–discharge tests using LAND CT 2001A system between 2.0 and 4.8 V vs. Li/Li+ at room temperature. Here, 1C rate means a discharge of the cell in 1 h, corresponding to a current density of 250 mA g−1. Cyclic voltammograms were measured on an electrochemical workstation (CHI 660D) between 2.0 and 4.8 V (vs. Li/Li+) with a scanning rate of 0.1 mV s−1. Electrochemical impedance spectra (EIS) measurements were performed in the frequency range of 100 kHz to 0.01 Hz with ac amplitude of 10 mV.
![]() | ||
Fig. 2 XRD patterns of the samples: (a) GCS-prepared precursors and (b) calcined products at different fuel ratios. |
Fig. 2b shows the XRD patterns of the calcined products obtained after a heat treatment. All the samples at various fuel ratios display a well-defined hexagonal α-NaFeO2 layered structure with a space group of Rm, while the weak superlattice peaks between 20° and 25° are characteristics of the monoclinic Li2MnO3 phase with a LiMn6 cation ordering in the transition metal layers, corresponding to the space group of C2/m.30,31 Notably, no obvious peak characteristic of Li2CO3 could be found, which means an absolute reaction with transition metal oxides during the calcination. Meanwhile, all diffraction peaks are narrow, indicating a high crystallinity structure. The determined structure parameters of the samples prepared with different fuel ratios are further examined. The lattice parameter ratios of c/a can be taken as an indicator of the hexagonal ordering.23,32 As given in Table 1, all samples show a high c/a ratio (larger than 4.9), which implies an explicit layered structure. Furthermore, the peak intensity ratio of I(003)/I(104) is widely used to indicate the cation mixing in the layered LiMO2 (M = Ni, Co, Mn) structure. And it is suggested that the cation mixing is negligible when the value of I(003)/I(104) is larger than 1.2.33,34 It can be found that the c/a and I(003)/I(104) ratios for samples S100 and S125 are slightly larger than those for sample S75 and S150, indicating a higher crystal orientation and a lower cation mixing.
a (Å) | c (Å) | c/a | I(003)/I(104) | Mean size (nm) | BET (m2 g−1) | |
---|---|---|---|---|---|---|
S75 | 2.8576 | 14.2199 | 4.9762 | 1.4248 | 596 | 1.4 |
S100 | 2.8489 | 14.2179 | 4.9907 | 1.7669 | 414 | 5.4 |
S125 | 2.8519 | 14.2240 | 4.9876 | 1.7690 | 518 | 3.2 |
S150 | 2.8555 | 14.2156 | 4.9783 | 1.4079 | 614 | 1.1 |
Fig. 3 displays the morphology and particle size distribution of samples obtained at different fuel ratios. It can be found that all samples are composed of nanoparticles with clear and smooth surface, indicating good crystallization. More detailed information shows evident distinction in particle size for the materials prepared with different fuel ratios. The sample S75 and S150 show relatively wide particle size range of 100–1500 nm and 100–1200 nm respectively. Meanwhile, sample S100 demonstrates the narrowest distribution ranging from 100–600 nm. As shown in Table 1, the mean particle size of the sample at different fuel ratios follows an order of S150 ≈ S75 > S125 > S100. BET analysis is carried out to investigate the further information of the sample surface areas. As shown in Table 1, sample S100 exhibits the highest BET surface area of 5.4 m2 g−1. And the specific surface areas are 1.4 m2 g−1, 3.2 m2 g−1 and 1.1 m2 g−1 for sample S75, S125, S150, respectively. Moreover, the BET surface area decreases with the fuel ratio increases from 1.0 to 1.5, which is ascribed to serious aggregation after an incomplete combustion in the fuel-rich condition with more carbonaceous residues left. Typically, nanosized particles with a high specific surface area can reduce the Li+ diffusion distance and offer better contacts between electrode and electrolyte.23,35
![]() | ||
Fig. 3 SEM image of the Li1.2Ni0.13Co0.13Mn0.54O2 samples at different fuel ratios: (a) S75; (b) S100; (c) S125; (d) S150. Insets are the particle size distributions of the corresponding samples. |
Fig. 4 shows Co 2p, Ni 2p and Mn 2p XPS spectra of the Li1.2Ni0.13Co0.13Mn0.54O2 samples at different fuel ratios. The oxidation valence states of the transition metal ions are further determined. It can be detected that four signals for Co 2p and Ni 2p spectra, including two main peaks and two corresponding satellite peaks. The binding energies of Co 2p3/2 for all samples are around 780 eV with satellite peaks around 790 eV. Moreover, binding energies for Co 2p1/2 level are around 795.5 eV with satellite peaks around 805 eV, conforming that the main chemical valence state is Co3+ for Li1.2Ni0.13Co0.13Mn0.54O2 samples.36–38 For Ni 2p spectra, the main line for Ni 2p3/2 and Ni 2p1/2 locates around 855 eV and 872.5 eV, and two corresponding satellite peaks are around 861.5 eV and 880 eV, respectively. All of this indicates that Ni ions for all samples are in an oxidation state of +2.14,39 According to Mn 2p spectra shown in Fig. 4c, Mn4+ is the majority constituent for all samples at different fuel ratios with respect to the peaks around 642.5 eV (Mn 2p3/2) and 654 eV (Mn 2p1/2). However, there are two other peaks in Mn 2p spectra for sample S125 and S150: one peak around 653.3 eV and the other around 641.6 eV. These data suggest that a certain amount of Mn3+ exists on the surface of the sample prepared at fuel ratios of 1.25 and 1.5.15,28,40 The incomplete oxidized manganese ions can be attributed to the decomposition of Li2CO3 and carbonaceous residues during the calcination process, in which the released gas CO2 could reduce the local oxygen partial pressures and thereby resulted in the presence of Mn3+.26,28 However, the trivalent manganese ions are also known to suffer from Jahn–Teller distortion and dissolution in the electrolyte, which may further destroy crystal structure and impact the cycle stability.41
![]() | ||
Fig. 4 XPS spectra of (a) Co 2p, (b) Ni 2p and (c) Mn 2p for Li1.2Ni0.13Co0.13Mn0.54O2 samples at different fuel ratios. |
![]() | ||
Fig. 5 (a) First and (b) second charge–discharge curves at 0.1C in a voltage range of 2.0 to 4.8 V for all samples. |
Fig. 6 depicts the cycle performance of the Li1.2Ni0.13Co0.13Mn0.54O2 electrodes at different rates. As shown in Fig. 6a, after 50 charge–discharge cycles, samples S75, S100, S125, and S150 deliver high discharge capacities of 202, 235.6, 211.8 and 192.6 mA h g−1, respectively, with the corresponding capacity decay rates of 17.3%, 16%, 21.6%, and 27.6%. However, the discharge curves of all Li1.2Ni0.13Co0.13Mn0.54O2 electrodes move to lower voltage plateaus with successive cycling, as shown in Fig. S2 (ESI†). The origin of such voltage decay could be related to the gradual change of layered structure to a spinel-like structure during cycling.34,47 Due to its high crystallinity and structural integrity, the sample S100 suffers a relatively slower drop in the discharge midpoint voltage which decreases from 3.52 V to 3.23 V after 50 cycles. The cycle performance performed at 1C is shown in Fig. 6b. There is an activation process appearing for about 10 cycles before achieving the maximum of discharge capacity for all electrodes, followed by a gradual capacity fading upon cycling. The maximal discharge capacities for sample S75, S100, S125 and S150 are 186.6, 213.9, 205.8 and 195.7 mA h g−1, respectively. Moreover, a discharge capacity of 182.6 mA h g−1 is retained for sample S100 after 100 cycles. And the retained discharge capacities are 111.6, 152.5 and 125.8 mA h g−1 for sample S75, S125 and S150, respectively. It is obvious that S100 exhibits the highest discharge capacity with excellent cyclic stability both at 0.1C and 1C due to its perfect layered structure. Comparatively, the serious capacity decay suffered by sample S125 and S150 are mainly attributed to the dissolution of the Mn3+ on the surface of the sample during charge–discharge process. This mechanism can be explained as: Mn3+ → Mn4+ + Mn2+. The dissolution will seriously destroy the oxide surface and further form unsatisfactory SEI films. Besides, the relatively lower chemical valence state of manganese ions aggravates the Jahn–Teller distortion during the cycling process which also affects the cycle stability.23,32 This result is accordant with the previous discussion of XPS spectra.
![]() | ||
Fig. 6 Cycle performance for all samples at (a) 0.1C and (b) 1C in the voltage range of 2.0 to 4.8 V. |
Fig. 7 exhibits the rate capability of Li1.2Ni0.13Co0.13Mn0.54O2 electrodes at current rates of 0.2–3C (1C = 250 mA g−1) between 2.0 and 4.8 V at room temperature. It is clearly observed that the sample S100 synthesized with a fuel ratio of φ = 1 exhibits a superior rate capability than the others. And the cathode delivers average discharge capacities of 254.8, 229.3, 201.2, 172.9 and 150.22 mA h g−1 at 0.2C, 0.5C, 1C, 2C and 3C, respectively. About 90.3% (230.2 mA h g−1) of the initial discharge capacity can be recovered back at 0.2C. The excellent rate capability is probably attributed to the well-formed layered structure. Moreover, small particle size with a high specific surface area can offer shorter Li+ migration distance and better contacts between the active electrode and electrolyte, which can effectively enhance the kinetics of Li1.2Ni0.13Co0.13Mn0.54O2 cathode and contribute to an improved rate capability.35 Furthermore, S125 and S150 exhibit a relatively better rate capability. This result can be ascribed to the increased conductivity and Li+ ion diffusion coefficient for the presence of mixed valence state Mn4+ and Mn3+ ions.26,28,33
CV tests were performed to further investigate the redox reaction during the charge–discharge processes. As shown in Fig. 8, all the electrodes exhibit similar shape with two anodic peaks at about 4.0 V and 4.7 V in the initial positive scanning. The peak at low voltage is associated with the oxidation of Ni2+ to Ni4+ and Co3+ to Co4+, while the second peak is assigned to the extraction of Li+ and O2− from Li2MnO3 component, corresponding to the activation of Li2MnO3 and the formation MnO2.48,49 The CV features of the second cycle show obvious differences as compared with the first one. The strong activation peak at ∼4.7 V disappears or reduces in the second cycle, which is corresponding to the large irreversible capacity of the initial cycle. And new broad peaks appear at ∼3.9 V, corresponding to the oxidation of Ni2+ and Co3+ ions.50 Though the presence of Mn3+ for S125 and S150 has been observed through the XPS analysis, there is no obvious oxidation peak of Mn3+ in the first oxidation process, which may indicate that small amounts of Mn3+ only exist on the surface with no intrinsic change.15 Furthermore, it is obvious that the CV curves of the S100 are symmetrical and sharp, implying a superior kinetics behavior for the insertion/extraction of lithium during cycling process.
![]() | ||
Fig. 8 CV curves of the Li1.2Ni0.13Co0.13Mn0.54O2 samples at different fuel ratios: (a) S75; (b) S100; (c) S125; (d) S150 for the initial two cycles (scan rate: 0.2 mV s−1, voltage range: 2.0–4.8 V). |
Electrochemical impedance spectroscopy (EIS) experiments were carried out to investigate the electrochemical properties of the Li1.2Ni0.13Co0.13Mn0.54O2 electrodes at the charge state of 4.5 V in the initial cycle. Nyquist plots and equivalent circuits of all samples are shown in Fig. 9. In general, the spectra are composed of two well-defined semicircles in the high and medium frequency ranges and a slope line in the low-frequency range. The small intercept in high frequency corresponds to the solution resistance (Rs). The first semicircle in the higher frequency range represents the impedance (Rf) of Li+ ion diffusion through the surface film. The second semicircle at lower frequency is assigned to the charge transfer resistance (Rct) at the electrode/electrolyte interface. The slop line in low frequency range refers to the Warburg impedance (Zw), which is related to Li+ ion diffusion in the bulk electrode material.32,51 Furthermore, the calculated values of the Rs, Rf and Rct for all electrodes are presented in Table 2.
![]() | ||
Fig. 9 EIS spectra and equivalent circuits of Li1.2Ni0.13Co0.13Mn0.54O2 samples in the initial cycle at the charge state of 4.5 V. |
Sample | Rs (Ω) | Rf (Ω) | Rct (Ω) |
---|---|---|---|
S75 | 0.53 | 184.4 | 627.4 |
S100 | 1.00 | 120.2 | 141.9 |
S125 | 1.32 | 143.8 | 204.2 |
S150 | 0.91 | 179.6 | 355.4 |
As listed in Table 2, Rs values for all samples at the initial cycle are so small (∼1 Ω), which indicates that the effect of solution resistance is neglectable compared with that of Rf and Rct. The value of Rf is ascribed to the solid electrolyte interface film (SEI film) resulted from the reaction between active material and electrolyte on the electrode surface. A larger value of Rf may be destructive to electrode and hinder the migration of Li+ during the deintercalation and intercalation process.12 The parameter Rct plays a dominant role in the charge transfer process, which is associated with the delithiated process from the Li2MnO3-like region in this work. It is obvious that sample S100 shows the lowest values of Rf (120.2 Ω) and Rct (141.9 Ω), indicating an enhanced kinetics of the Li+ through the SEI film and a relatively easier activation of Li2MnO3 compound, which is corresponding to its largest first discharge capacity and superior rate capability.
Footnote |
† Electronic supplementary information (ESI) available. See DOI: 10.1039/c6ra15639h |
This journal is © The Royal Society of Chemistry 2016 |