DOI:
10.1039/C6RA15531F
(Paper)
RSC Adv., 2016,
6, 77818-77829
Improved dispersibility of nano-graphene oxide by amphiphilic polymer coatings for biomedical applications
Received
15th June 2016
, Accepted 8th August 2016
First published on 9th August 2016
Abstract
The poor dispersibility and stability of graphene and its derivatives in aqueous media is an influential limitation in the biological applications of graphene based nanomaterials. The aim of this study is to improve the solubility and dispersibility of reduced graphene oxide (rGO) in cell culture media and serum using three amphiphilic polymers (polystyrene-co-polyacrylic acid (PS-PAA), polystyrene-co-poly4-vinylpyridine (PS-P4V) and phospholipid-polyethylene glycol (PL-PEG)) as first layer coating materials. A cationic cell penetrating peptide, octaarginine (R8), is incorporated as a second layer on the selected formulation to enhance the cell internalization capability of the stabilized rGO. Chemical, physical and biological properties of the double-layer coated (DLC)-rGO are fully characterized. The cellular uptake of fluorescein isothiocyanate (FITC)-labeled DLC-rGO is evaluated using confocal microscopy. None of the polymer-functionalized rGO samples show cell toxicity. While the amount of immobilized PL-PEG on the rGO surface is less than PS-PAA and PS-P4V, much higher dispersibility is observed than with other copolymers. Furthermore, the R8 coated rGO-PL-PEG shows great cell internalization ability after 4 h incubation with MCF-7 cells. It is concluded that DLC-rGO could have great potential to be used as a nanocarrier in the biomolecular delivery of biological materials such as drugs and genes.
1 Introduction
Graphene based nanomaterials, a flat monolayer of carbon atoms tightly packed into a two-dimensional honeycomb lattice, have recently attracted considerable attention in various biomedical applications including biosensors, tissue engineering, gene and drug delivery, cancer therapy and bioimaging.1 Although there is a great promise of graphene in biological applications, utilization of graphene nano-sheets particularly as delivery vehicles will largely depend on their dispersibility and biostability.2 Stability in biological environments is a prerequisite for the exploration of the biomedical applications of nanomaterials.3 Unfortunately, both graphene and oxidized graphene derivatives exhibit poor stability in phosphate-buffered saline (PBS) and cell culture medium which is associated with the hydrophobic nature of the conjugated sp2 carbon network.4 Considering the graphene chemical structure, the poor colloidal stability and dispersibility of graphene and reduced graphene oxide (rGO) in aqueous media and polar solvents arise from lack of hydrophilic interaction between the graphene basal plane and polar molecules like water. Although oxidation of graphene to graphene oxide (GO) could almost improve dispersibility and colloidal stability of GO nano-sheets due to oxygenated functional group interactions with water molecules, the stability could not last longer in the presence of ions (e.g. in PBS solution) or proteins (e.g. cell culture serum).2 Ions or proteins electrostatically interact with graphene oxide surface functional groups and consequently the nano-sheets tend to precipitate.3 Aggregation of graphene nano-sheets would result in an inefficient interaction with biomolecules, inadequate cellular uptake, and reduced delivery efficiency.5 Furthermore, biocompatibility of graphene based materials is considerably affected by nano-sheets agglomeration and precipitation.6 So, introduction of hydrophilic functionalities which could provide a steric hindrance effect on the graphene nano-sheets surface to avoid undesired protein interaction would increase graphene stability in the biological media.7
One of the recent challenges is to improve stabilization of graphene and its derivatives by covalent or non-covalent functionalization for enhanced efficiency in biomedical applications such as biomolecules delivery.2 It has been shown that PEGylation of graphene oxide with branched PEG could greatly modify GO stability and dispersibility in order to deliver anticancer drugs into the cells without any agglomeration.8 Liu et al. showed that modification of GO with PEG would increase its stability in the presence of serum proteins and phosphate buffer salts.9 Yang et al. reported a direct correlation between the surface coating of PEGylated GO and biodistribution in mice.10 The PEG stabilized reduced graphene oxide (rGO) has also shown a great ability to deliver short strand RNA (ssRNA) to cancer cell rather than bare rGO which is susceptible to aggregation in cell culture media.11 Improving the stability of PEI-GO as a nano-carrier by PEGylation has shown to improve its transfection ability for siRNA.12 Cheng et al. have demonstrated that a highly dispersible PEGylated PEI-grafted graphene/Au composite has lower cytotoxicity compared to PEI-GO at the same time as excellent blood compatibility and transfection ability.13 It is apparent that increased stability of GO-based formulations would lead to advances in carrying biological payloads e.g. genes, proteins and drugs.
Although, the covalent functionalization method has been widely used, non-covalent functionalization of graphene with hydrophobic interactions is the most effective and nondestructive method as enables the modification of graphene without alteration of its chemical structure.14 The covalent functionalization could disrupt the conjugated structure of graphene, leading to changes of its physical properties and make the synthesis difficult.15 In recent studies, amphiphilic polymers that are commonly composed of both hydrophilic and hydrophobic segments have employed as stabilizing agents for dispersion of graphene nano-sheets.16 In this way the hydrophobic segments of amphiphilic polymers could interact with graphitic structure of graphene nano-sheets.17 While many reports are available on covalent functionalization of graphene sheets, there has not been much investigation yet on the use of amphiphilic polymers as stabilizing agent for graphene-based materials.
Here, a series of single-layer coated (SLC)-rGO nano-sheets was fabricated by immobilizing three different amphiphilic polymers (Scheme 1) including polystyrene-co-polyacrylic acid (PS-PAA), polystyrene-co-poly 4-vinylpyridine (PS-P4V) and phospholipid-polyethylene glycol (PL-PEG). After comprehensive characterization, the dispersibility and stabilizing ability of the three samples were assessed comparatively. A positively charged cell penetrating peptide (CPP) was used as the second layer coating on the selected sample with the highest dispersibility and tested for cell internalization experiment as a potent nano-carrier for biomedical applications.
 |
| Scheme 1 A representation of structure and main functional groups of amphiphilic polymers and octaarginine peptide. | |
2 Experimental
2.1 Materials
All the reagents used for GO and rGO synthesis as well as solvents were purchased from Sigma Aldrich (Canada). PS-P4V (MW 2.7k-b-2.8k) and PS-PAA (MW 1.8k-b-6.0k) were bought from Polymer Source (Montreal). PL-PEG-NH2 (PEG MW 2 kDa) was provided from Avanti Polar Lipids, Inc (US). Fluorescamine, FITC and 4′,6-diamidino-2-phenylindole (DAPI) were purchased from Sigma Aldrich (Canada). MCF-7 breast cancer cell line provided from ATCC, (Manassas, US) and MTS proliferation kit bought from Promega, Madison (US). Dulbecco's modified Eagle's Medium (DMEM) and fetal bovine serum (FBS) were supplied by Invitrogen (Canada).
2.2 Preparation of functionalized nano-carrier
2.2.1 Synthesis of nano-GO. Graphene oxide nano-sheets were synthesized using Hummers' method as previously described.18 For more exfoliation and size reduction of GO nano-sheets, they were treated by concentrated base. In a way that 1.2 g of sodium hydroxide (NaOH) was added to 10 mL of GO solution (1 mg mL−1) followed by sonication for 3 h (Microson™, XL2000, 100W, USA). The pH was adjusted to 1 by addition of concentrated hydrochloric acid (HCl). The solution was then filtered and washed three times with deionized (DI) water and ultra-small nanoparticles were re-dispersed in DI water at concentration of 1 mg mL−1.
2.2.2 Synthesis of nano-rGO. As prepared GO was reduced to rGO sheets using hydrazine monohydrate as a common reagent. Briefly, 0.05% v/v of hydrazine monohydrate was added to 15 mL of nano-GO (1 mg mL−1). The solution was heated up to 80 °C for 4 h which caused darkening of the color from a translucent yellow to an opaque black color. The rGO was gradually precipitated out as a black solid. The product was washed by DI water 5 times using centrifugation filtration units (Amicon, 30 kDa) and freeze dried.
2.2.3 Layer by layer functionalization of nano-rGO.
2.2.3.1 Single-layer coated (SLC) rGO. To immobilize the amphiphilic polymers on the rGO samples, 2 mg of nano-rGO was partially dispersed in 8 mL of DI water under ultrasonication process (5 min). From each amphiphilic polymer solution, 2 mL (3 mg mL−1) was mixed with dispersed rGO (PS-P4V and PS-PAA in dimethylformamide (DMF) and PL-PEG-NH2 in DI water). The mixture was dispersed under the bath sonication for 3 h. The suspension was then washed 5 times by filtration (Amicon filters-30 KDa) to remove excess non-bonded polymers. Finally, the ultracentrifugation (50Ti, Beckman Coulter, USA) at 20
000 rpm for 1 h was used to obtain the most stable supernatants; named single-layer coated reduced graphene oxide (SLC-rGO) for further functionalization step.
2.2.3.2 Double-layer coated (DLC) rGO. A positively charged-peptide, octaarginine (R8), was used to prepare double-layer coated rGO samples. The R8 solution was added into the SLC-rGO solution at the final concentration of 1 mM and the mixture was sonicated for 1 h. The final products were obtained by filtration and centrifugation as the same procedure as described above and named double-layer coated rGO (DLC-rGO).
2.3 Characterization of nano-carriers
2.3.1 Structural characterization. FT-IR spectra of samples were recorded by a Nicolet 6700 FT-IR spectrometer within the range of 3500–500 cm−1 at a resolution of 4 cm−1. UV-Vis spectra of GO, rGO as well as single and double-layer coated rGOs suspended in DI water were obtained in the range of 190–600 nm in UV-Vis spectrophotometer (Cary-100 bio, Varian Inc) using 1 cm quartz cuvettes. The morphology and size of coated samples were evaluated by an atomic force microscope (AFM, Nanoscope III Multimode, VEECO) in tapping mode. The single sheet morphology of GO before and after treatment with base was characterized by a transmission electron microscopy (TEM, Philips169 CM200) operated at 200 kV. For TEM, 5 μL of sample solution was deposited on a carbon-coated copper grid and allowed to dry for 10 min. Raman spectra were recorded from 200 to 2000 cm−1 on a Renishaw 2000 Confocal Raman Microprobe (Rhenishaw Instruments, England) using a 514.5 nm argon ion laser. Thermal gravimeter analysis (TGA) was performed on the samples using TGA Q500 (TGA instruments Ltd, UK). Freeze dried samples were loaded in the sample holder and heated up to 700 °C under nitrogen atmosphere at a rate of 20 °C min−1. The weight loss and derivative weight were recorded continuously. Finally, the size and surface charges of the coated rGOs were evaluated using size and zeta potential analyzer (Brookhaven Instruments Corporation, USA).
2.3.2 Fluorescamine assay. Fluorescamine (FL-amine) assay is a sensitive fluorescence-based calorimetric assay to detect primary amine functional groups. FL-amine dye, a heterocyclic dione, reacts with primary amines to form a fluorescent product.19 The fluorescence of a sample solution with FL-amine is proportional to the quantity of free amine groups. Briefly, phosphate buffer (pH 7.4, 80 μL) and 20 μL of sample solution were mixed followed by addition of 32 μL FL-amine solutions (3 mg mL−1 in acetonitrile) to the mixture. Excitation wavelength was set at 400 nm. The fluorescence emission was recorded rapidly after the addition of reagent to the samples at 480 nm using SpectraMax i3 Multi-Mode Microplate Reader (Molecular devices). For estimation of peptide molarity in each sample, standard curve was plotted based on R8 solution in different molar ratio.
2.3.3 Stability and dispersibility assessments. The ability of amphiphilic polymers to disperse rGO in aqueous solution after the first layer of coating was assessed by ultracentrifugation (20
000 rpm, 1 h) of the samples. The concentration of stable supernatants was determined using UV-Vis spectrophotometer. Stability of single and double-layer coated rGOs in cell culture media in the presence of 10% serum was observed after 48 h incubation at room temperature.
2.4 Functional characterization of optimized nano-carriers
2.4.1 Cell culture and MTS assay. The MCF-7 breast cancer cells were cultured in DMEM supplemented with 10% FBS in a humidified incubator with 5% CO2 at 37 °C. The cytotoxicity of SLC-rGOs was evaluated by 3-(4,5-dimethylthiazol-2-yl)-5-(3-carboxymethoxyphenyl)-2-(4-sulfophenyl)-2H-tetrazolium (MTS) assay using the Cell Titer 96® Aqueous Non-Radioactive Cell Proliferation MTS Assay kit. Briefly, triplicates of 1 × 10⁴ cells were seeded in a 96-well plate and cultured for 24 h followed by treatment with SLC-rGO samples at 50 μg mL−1 (37 °C). The MTS assay was performed based on the manufacturer protocol. The MTS was reduced to formazan by mitochondrial enzyme dehydrogenase in viable cells. The absorbance of formazan in cell culture was measured at 490 nm using Victor3 Multilabel Counter (Perkin Elmer, USA). The amount of formazan is directly proportional to the number of viable cells. The viability of SLC-rGO treated cells was calculated as the percentage of viable cells compared to untreated cells as control.
2.4.2 DLC-rGO cell internalization. In order to visualize nano-sheet cellular uptake, the DLC-rGO sample was labeled with FITC.20 Briefly, DLC-rGO was diluted in PBS solution at a concentration of 100 μg mL−1. 20 μL of FITC stock solution (4 mg mL−1 in ethanol) was added into 200 μL of samples. The mixture was briefly sonicated followed by incubation at room temperature overnight. The excess unbound FITC solution was removed by filtration column (30 kDa).For cellular uptake assay, the MCF-7 cells were seeded in 96-well plate at density of 2 × 10⁴ cells per well in 200 μL medium. The cells were incubated with FITC-labeled DLC-rGO for 24 h, then washed and observed under a fluorescence microscope. The penetration of FITC-loaded rGO-PLPEG-R8 into the MCF-7 cells was visualized by fluorescent microscopy (Nikon, Eclipse, Te2000-4, Japan).
For more detailed investigation of cellular internalization, the transfected cells with selected sample were visualized under laser confocal microscope after nucleus staining. The DLC-rGO treated cells were fixed with 0.3% glutaraldehyde in PBS for 5 minutes and stained with Hoechst® (0.5 g mL−1 in PBS) for 15 minutes. Confocal images were taken with a Zeiss LSM 510 microscope (Carl Zeiss, Jena, Germany) using ×60 oil-immersion objectives and captured and post-processed using Zeiss LSM 510 software.
2.5 Statistical analysis
Statistical analysis was carried out using SPSS software (v 17.0; IBM New York, NY, USA) when statistical differences were detected, a t-student comparison test was performed. Data are reported as mean ± SD at a significance level of p < 0.05.
3 Results and discussion
3.1 Synthesis and characterization of nano-rGO
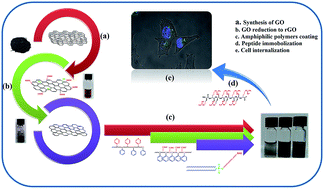
The preparation of amphiphilic polymer-functionalized rGO is shown in Scheme 2. First, nano-GO was obtained by chemical oxidation of graphite, followed by sonication and filtration according to our previous study.18 In order to reduce nano-sheets size and to create more exfoliation, the GO sample was treated with strong base. The reduction of nano-GO by hydrazine monohydrate formed nano-rGO. The functionalization step with different amphiphilic polymers was performed based on hydrophobic interactions with basal planes of rGO nano-sheets. The most dispersed and stable sample was coated with second layer positively-charged peptide (R8) to achieve a stable DLC-rGO nano-carrier.
 |
| Scheme 2 The schematic representative of single layer coated rGO (SLC-rGO). | |
The chemical characterization of as prepared GO and the reduction reaction to rGO was performed by FT-IR, UV-Vis spectroscopy and Raman spectroscopy (Fig. 1). The bonds at 1060 (C–O), 1250 (C–O–C), 1365 (C–OH), and 1720 cm−1 (C
O COOH and –CH
O) assigned to the GO surface oxygenated functional groups (Fig. 1a).21 After the reduction of GO to rGO, the intensity of peaks between 900 and 1500 cm−1 decreased significantly and carboxyl peak in rGO was diminished.22 Furthermore, the peak at 3500 cm−1 (stretching mode of OH) became significantly weaker due to the removal of the hydroxyl groups. These observations confirm that most oxygen functionalities of the pristine GO were eliminated.
 |
| Fig. 1 FTIR (a) UV-Vis (b) Raman shift (c) and TGA (d) spectra of GO and rGO. | |
The reduction of GO to rGO was monitored by UV-Vis spectroscopy. Upon reduction of GO nano-sheets, the brownish aqueous solution darkened and the reduced sheets were aggregated and subsequently precipitated. As shown in Fig. 1b, a characteristic absorption peak at 230 nm (attributed to π–π* transitions of aromatic C
C bonds) and a shoulder peak around 300 nm (attributed to n–π* transitions of C
O bonds) were observed for nano-GO.18 However, after GO reduction, the peak at 230 nm shifted to larger wavelength (258 nm) and the observed shoulder peak at 300 nm was soften.23
The structural changes which was occurred during the chemical reduction of GO to rGO are also reflected in their Raman spectra (Fig. 1c). For both GO and rGO the spectra showed two strong peaks at 1330 and 1597 cm−1 corresponding to the D and G bands of graphene, respectively. However, in rGO spectra D/G ratio showed an increase compared to that of GO. This would suggest a decrease in the average size of sp2 domains upon reduction of the exfoliated GO. This could be due to the formation of new smaller and more graphitic domains in GO before the reduction.22 A higher D/G ratio for rGO could also confirm the successful reduction of GO.
Thermogravimetric analysis (TGA) is a complementary technique that can reveal the composition and thermal stability changes of the sample. As shown in Fig. 1d, a major mass loss at 180 °C occurs for the GO that presumably reflect pyrolysis of the oxygen-containing functional groups. As rGO did not show significant mass up to 700 °C,24 it is an indication of successful reduction of the GO and significant increase in thermal stability of the rGO.22
The morphological analysis using AFM and TEM indicated that as prepared GO presented sheet-like morphology with the average size of 250–400 nm (Fig. 2a and d). The TEM images of GO showed a wrinkled sheet-like structure. The thickness of unmodified GO was estimated 1–1.5 nm according to the height profile of AFM images which is corresponded to 1–2 layer of graphene sheets (Fig. 2a). The base treatment resulted in smaller exfoliated GO nano-sheets with the mean thickness of ∼0.8 nm that indicates the formation of single-layered sheets (Fig. 2b and e). It has been previously shown that the oxidation/base treated of graphene would form a single-sheet morphology with reduced size.18 The reduction reaction of the GO did not affect morphology of nano-sheets significantly. Therefore, the AFM and TEM were not able to characterize the rGO due to the aggregation and precipitation of nano-sheets after the reduction (Fig. 2c). A representative SEM image of the dry rGO powder is shown in Fig. 2f. As it can be seen the nano-sheets were appeared highly agglomerated with a fluffy morphology.25
 |
| Fig. 2 The AFM images of as prepared GO (a) base-treated GO (b) and rGO (c). The TEM image of as-prepared GO (d) and base-treated GO (e). The arrows show a GO single nano-sheet. The SEM image of aggregated rGO nano-sheets (f). | |
Based on DLS analysis, rGO showed a smaller size and narrower distribution rather than base-treated GO. It should be noted that the size analysis of rGO was performed immediately after strong sonication due to the fast aggregation of rGO nano-sheets. Increasing zeta potential value from −45 to −25 mV (Table 1) and drastic decrease of solubility was also confirmed the proper reduction of GO.
Table 1 Zeta potential and DLS analyses of SLC-rGO and DLC-rGO samples in comparison with rGO
Sample |
Zeta (mV) |
DLS (nm) |
PDI |
rGO |
−25 ± 1.80 |
146 ± 4.6 |
0.015 |
rGO-PS-PAA |
−65 ± 1.73 |
360 ± 4.4 |
0.009 |
rGO-PS-P4V |
−38.62 ± 2.03 |
406 ± 6.8 |
0.031 |
rGO-PL-PEG |
−20.55 ± 1.73 |
188 ± 3.2 |
0.255 |
rGO-PLPEG-R8 |
+42.61 ± 2.02 |
246.7 ± 2.7 |
0.170 |
3.2 Synthesis and characterization of polymer-functionalized rGO
3.2.1 SLC-rGO. The amphiphilic molecules have a unique structure with both hydrophilic and hydrophobic segments. They are usually used as a surfactant to disperse nanoparticles in polar or non-polar solvents. The reduction process has significant effect on the both solubility and stability of GO. Hydrophobic nature of rGO that originated from the presence of graphitic domains would decrease its dispersion in polar solvents and aqueous media.25 The application of amphiphilic molecules would cause absorption of these interfacial molecules via hydrophobic interactions and reconfiguration of the rGO in solution to a new equilibrium state with lower energy. The effectiveness of the approach would largely depend on the strength of the interaction between the polymer and nano-sheet surface, as well as the stabilization of dispersed nano-sheets by the steric hindrance and/or charge repulsion provided by the polymers.2 In this study, three different polymers including PL-PEG-NH2, PS-PAA and PS-P4V were used to test their effect on the dispersion of the rGO. The binding and stabilization mechanism in each polymer being used here for coating of the rGO is different. The PL-PEG-NH2 contains a hydrophobic lipid part that binds to rGO through hydrophobic interactions while the water-soluble PEG-NH2 segment provides steric hindrance and positive charge for stabilization of the rGO in water solution (Scheme 1).26 The PS-PAA and PS-P4V contain poly-aromatic rings that could stick to rGO by π–π stacking. For PS-PAA, the PAA segment provides steric hindrance and negative charge for stabilization27 while in PS-P4V the pyridine ring act as a hydrogen bonding acceptor and provides hydrophilic interaction with water.28 For all three amphiphilic polymers with unique molecular architecture it was anticipated that they would attach to the basal plane of rGO by strong hydrophobic interactions. The selected amphiphilic polymers were used for rGO functionalization under the same sonication condition. The result showed a clear, dark rGO–polymer solution from all the three different polymers (Fig. 3).
 |
| Fig. 3 A representation of dispersibility test of rGO nano-sheets after sonication in presence of amphiphilic polymers. The colloidal stability of rGO-PLPEG-R8 after 48 h incubation with cell culture media (a) and after 48 h incubation in PBS at room temperature (b). | |
Surface coating of rGO by amphiphilic polymers was confirmed by FT-IR spectroscopy (Fig. 4). The typical peaks of each polymer's backbone were detectable in SLC-rGO samples spectra. In the rGO-PLPEG sample, two peaks at 1100 and 2850 cm−1 were observed which can be ascribed to PEG segments (–CH2–), respectively. In rGO-PS-P4V sample, the absorption peak at 994 cm−1 was corresponded to pyridine groups.29 The PS characteristic peaks were detected at 1500 and 1250 related to aromatic C
C and C–H deformation vibration, respectively. The characteristic peak of COOH (1620 cm−1) was pronounced in rGO-PS-PAA spectra at the same time as the peaks of PS blocks at 1500 and 1250 cm−1.30 However, the intensity of these peaks was decreased due to the interaction with rGO basal plane.
 |
| Fig. 4 The FTIR spectra of amphiphilic polymer coated rGO samples (a, b and c). The UV-Vis spectra of SLC-rGOs compared to rGO (d). The TGA of pure amphiphilic polymers (e) and polymer coated rGO samples (f). | |
The UV-Vis spectrum of the polymer-coated rGO which was dispersed in water presented similar features as that of polymers itself (Fig. 4d). Besides, the rGO characteristic peak around 260 nm was also detectable in all three spectra which is an indication for the attachment of polymers to the rGO surface.
The TGA curves for the polymer-functionalized rGO were shown in Fig. 4. Pure polymers, PS-PAA, PS-P4V and Pl-PEG-NH2 had weight losses of 95%, 100% and 98% in nitrogen atmosphere at 700 °C, respectively (Fig. 4e), whereas functionalized rGO showed a different pathway which indicates that polymers were immobilized on the rGO nano-sheets (Fig. 4f). The content of polymers in the SLC-rGO samples was calculated to be around 50, 54 and 40 wt% for rGO-PS-PAA, rGO-PS-P4V and rGO-PL-PEG, respectively. This result provides evidence that PS-P4V more predominantly was immobilized on the surface of rGO nano-sheets rather than two other polymers. The two co-polymers with polystyrene blocks showed more absorption on the rGO surface rather than PL-PEG. This could demonstrate that interactions mediated by π–π stacking were more dominant than phospholipid (PL) chain hydrophobic interactions with basal plane of nano-sheets. The rGO-PS-P4V sample showed more weight loss and polymer immobilization on the rGO surface as compared to the rGO-PS-PAA. This could be correlated to the association of pyridine ring in π–π interaction that resulted in a more polymer chains stacking on the rGO basal plane.
The size and surface charges of the functionalized rGO samples were evaluated using size and zeta potential analyzer. Owing to the distinct functional groups in the polymers including amine groups in PL-PEG-NH2, –COO– in PAA, and partial negative charge of NH in pyridine ring, the polymers-functionalized rGO samples displayed different surface charges. Zeta potential analysis indicated that rGO-PS-PAA had zeta potential of −65 ± 1.73 mV due to the highly anionic PAA blocks in the polymer structure; rGO-PS-P4V showed zeta potential of −38.62 ± 2.03 mV because of the partial negatively charged NH group in pyridine; and rGO-PL-PEG-NH2 had negative charge of −20.55 ± 1.73 mV due to NH2 functionality of PEG chains (Table 1). These functional groups in polymers help to stabilize dispersed polymer-functionalized rGO in aqueous solution. As expected the DLS analysis showed a significant size increase following the coating of rGO with the amphiphilic polymers particularly in the rGO-PS-PAA and rGO-PS-P4V samples (Table 1). Based on the DLS analysis which represents nano-sheets average hydrodynamic size, the nano-sheet size showed significant increases after immobilization of amphiphilic polymers. Regarding the higher MW for PS-P4V and PS-PAA rather than PL-PEG, the size increase was much more significant for these two PS-based polymers (406 ± 6.8 nm for rGO-PS-P4V and 360 ± 4.4 nm for rGO-PS-PAA compared to rGO-PL-PEG (188 ± 3.2 nm)). Considering the rGO average size (146 ± 4.6 nm) reported by DLS, the average increase in nano-sheet thickness at hydrated state could be estimated around 260 nm, 214 nm and 42 nm for PS-P4V, PS-PAA and PL-PEG, respectively. However, to measure the thickness alteration in dried state, the AFM would be a more precised technique.
3.3 Stability of polymer-functionalized samples (SLC-rGOs)
The as prepared SLC-rGOs were used in ultra-centrifugation (20
000 rpm, 30 min) in order to assess their dispersion ability. All three formulations showed a higher stability in DI water compared with bare rGO nano-sheets (Fig. 3). The concentration of rGO in supernatant was estimated using UV-Vis spectroscopy at 260 nm after the removal of precipitations. The PL-PEG showed greater capability to disperse rGO rather than two other formulations (Fig. 3) where the rGO estimated concentration was around 0.7, 0.5 and 0.2 mg mL−1 for rGO-PLPEG, rGO-PS-PAA and PS-P4V respectively. The concentration of stable part after centrifugation at the same condition indicated rGO-PS-P4V provided less stability rather than two other formulations. However TGA showed that this polymer has the maximum immobilization on the surface of rGO. The higher dispersibility which was observed for the rGO-PL-PEG and rGO-PS-PAA could be correlated to their steric hindrance and high negative charge of COO−, respectively. In the rGO-PS-P4V, however, it seems that the hydrogen bonding provided by the NH groups is not enough to disperse rGO in aqueous media. The dispersibility of rGO-PL-PEG in aqueous solutions was largely supported by hydrophilic PEG.
For biomedical applications, functionalized rGOs need to be stable in physiological fluids, such as PBS or serum containing media, therefore, the stability of SLC-rGO samples were investigated by incubation in PBS (0.01 M, pH 7.4) and growth media containing 10% FBS for 48 h at 37 °C. The stability of SLC-rGOs was also tested by the size measurements through DLS (Table 2). All the samples showed a slight size increase after 1 h incubation in cell culture media compared to DI water which could be due to the protein absorption from the serum. After 48 h of incubation in cell culture media no significant size changes was detected for any of the three coated samples compared to bare rGO nano-sheets, which indicated a good colloidal stability for polymer coated rGOs.
Table 2 DLS particle size analysis of the samples after incubation in cell culture medium and PBS for 48 h
Sample |
Effective diameter (nm) in DMEM |
Effective diameter (nm) in PBS |
After 1 h incubation |
After 48 h incubation |
After 1 h incubation |
After 48 h incubation |
rGO-PS-PAA |
391 ± 3.6 PD = 0.008 |
405 ± 8.1 PD = 0.013 |
366 ± 2.7 |
373 ± 7.2 |
rGO-PS-P4V |
450 ± 9.4 PD = 0.104 |
468 ± 11.2 PD = 0.371 |
430 ± 6.3 |
443 ± 9.2 |
rGO-PLPEG |
198 ± 7.1 PD = 0.022 |
216 ± 8.5 PD = 0.018 |
194 ± 6.8 |
204 ± 5.5 |
rGO-PLPEG-R8 |
255.1 ± 7.7 |
259.4 ± 4.3 |
248.2 ± 3.1 |
253.6 ± 6.7 |
3.4 Cytotoxicity of SLC-rGO
The cytotoxicity of rGO–polymers was examined by MTS assay using MCF-7 cells. The cells were treated with 50 μg mL−1 of each different rGO–polymer for 24 and 48 h. The PBS was used as a control. The results showed no toxicity for rGO-PL-PEG and rGO-PS-PAA samples (viability of 100%) while a minor toxicity was detected for rGO-PS-P4V (viability of 86 ± 3% at 24 h and 82 ± 5% at 48 h). It can be concluded that all the three formulations were not toxic and are suitable for biomedical applications (Fig. 5).
 |
| Fig. 5 Histogram represents cell viability assessment based on MTS assay for SLC-rGOs and rGO. All samples compared to control (non-treated cells) *p < 0.005. | |
3.5 Selection of optimized nano-carrier formulation
Among all SLC-rGO samples, rGO-PL-PEG showed the highest rGO dispersibility and hydrocolloid stability in the presence of serum proteins. Furthermore, the high biocompatibility and minimum size of this sample makes it the best option to be used as nano-carrier in the present study. Therefore this sample was selected as for further characterization and second layer immobilization.
As a second layer, rGO-PLPEG was coated by a highly cationic cell penetrating peptide octaarginine (R8) to introduce positive charges and facilitate cell internalization. Based on our pervious study, conjugation of octaarginine to graphene oxide could provide nano-sheet cell penetrating ability.31 Furthermore, R8 could interact with negatively charged genes; and facilitate their loading on graphene nano-sheets as delivery vehicle to cells. Here, we examined R8 loading on the rGO-PLPEG by physical electrostatic adsorption as a second layer for further cell internalization assay.
3.6 Characterization of DLC-rGO
The peptide functionalized rGO-PLPEG was characterized by UV-Vis spectroscopy (Fig. 6). Compared to rGO-PLPEG spectra, the UV-Vis spectrum of DLC-rGO showed a characteristic peak at ∼208 nm which is correlated to R8 guanidine groups. The R8 functionalized sample showed both main peaks of rGO-PLPEG and R8 around 260 and 200 nm, respectively. The small shift which is detected for these peaks is attributed to the interaction between peptide and nano-sheets.
 |
| Fig. 6 UV-Vis spectra of DLC-rGO sample compared to SLC-rGO. | |
The zeta potential measurement was carried out on the peptide functionalized rGO-PLPEG. The results showed that introduction of R8 into the stabilized rGO formulation caused a significant increase in the zeta potential from −20.55 ± 1.73 to +42.61 ± 2.02 mV which is an indication for the addition of positively charged R8 to the structure (Table 1). It was believed that the R8 could significantly interact with rGO-PLPEG structure. The DLS analysis also confirmed significant increase in size of peptide functionalized structure from 188 ± 3.2 to 246.7 ± 2.7 nm.
In order to quantify the R8 peptides molarity which was incorporated in the R8-functionalized rGO structure, FL-amine assay was used. The FL-amine would react with amino groups of R8 in aqueous solution and form a fluorescent component which can be detected at 480 nm emission (excitation at 400 nm) and quantify using a standard curve (Fig. 7). The amount of bonded R8 peptide (μmol mg−1) was calculated. The molarity of R8 which was absorbed as second layer estimated around 1.2 μmol mg−1 which is much higher than covalently conjugated R8 to GO which is reported previously.31 It is therefore expected that the stabilized rGO nano-sheet should have the high ability to internalize into the cells.
 |
| Fig. 7 A schematic representation of fluroescamine assay for peptide quantification. Up: fluorescence emission spectra of fluorescamine reagent (black) and fluorescamine reagent interact with peptide (red); Down: the relative calibration curve of peptide solution. | |
The hydrocolloid stability of DLC-rGO formulation was also assessed in PBS and cell culture media (DMEM + 10% FBS). The DLS result showed no significant size change after 48 h of incubation at room temperature (Table 2). It seems that the addition of R8 to the rGO-PLPEG structure did not affect the stability state of suspended nano-sheets. Although the zeta potential dramatically increase to positive values, the PEG steric hindrance as well as charge repulsion between cationic amine groups could hold up hydrocolloid stability of the structure.
3.7 Cell internalization
Considering versatile applications of graphene-based biomaterials in nano-delivery systems (e.g. genes, drugs, and proteins), the cell internalization ability of selected formulation was evaluated by incubation of FITC-labeled DLC-rGO with MCF-7 cells for 12 h. As it can be seen in Fig. 7, after 12 h of exposure of FITC-labeled DLC-rGO with MCF-7 cells, green dots could be clearly observed inside the cytoplasm. However, as expected the peptide functionalized nano-carrier (rGO-PLPEG-R8) facilitated cellular uptake and the more pronounced signals were observed in MCF7 cells as compared to the rGO-PLPEG (Fig. 8a). This observation could also be an indication of stability of the peptide layer in cell culture media even after cell internalization. For investigation of the intracellular distribution of labeled nano-sheets, we utilized confocal microscope imaging. Fig. 8 shows the confocal fluorescence images of MCF-7 after 1 h incubation with rGO-PLPEG-R8-FITC (Fig. 9a) and 4 h (Fig. 9b). As it can be seen clearly, the FITC-labeled nano-sheets were detectable inside the cells at 1 h. The intracellular fluorescence intensity increased after 4 h of incubation, indicating that the nano-sheets internalization into MCF-7 cells was enhanced and mainly localized near nucleus area. This is consistent with previous studies that report the localized fluorescence distribution inside cells is due to the endocytosis of rGO nano-sheets by cells.32 These results demonstrate that the functionalized-rGO can quickly and effectively be delivered into the cells.
 |
| Fig. 8 MCF-7 cell internalization of FITC-labeled nano-carriers: rGO-PLPEG (a) and rGO-PLPEG-R8 (b) after 12 h. | |
 |
| Fig. 9 Confocal microscope images of DLC-rGO nano-sheets uptake by MCF-7 cell after 1 h incubation (a) and 4 h (b). | |
4 Conclusions
Preparation of aqueous stable and biocompatible graphene-based nano-sheets is of great importance for its intensively growing biomedical applications. The modification of graphene using non-covalent strategies have advantages over covalent routs since different functionalities can be introduced simply by physical interactions such as electrostatic attractions π–π stacking as well as hydrophobic interactions. Moreover, this approach will facilitate the synthesis of graphene-based nanoparticles. Although much work has been devoted toward synthesis and characterization of graphene-based nano-carriers, there is not much report on the non-covalent synthesis of graphene nano-sheets coated by amphiphilic polymers and cell penetrating peptides. In this study, we demonstrated a simple and effective method to prepare stabilized rGO based nano-sheets by taking advantage of the amphiphilic polymers capable of hydrophobic interaction with graphene basal plane. The results showed that PL-PEG have a great ability to disperse rGO. Both of the PS-based copolymers showed much higher immobilization on the rGO basal plane which suggests the effectiveness of π–π interactions compared to phospholipid hydrophobic interactions. The double-layer coated rGO (rGO-PLPEG-R8) showed very efficient MCF-7 cell internalization therefore, it could potentially be used as a nano-carrier for delivery of biomolecules particularly genetic materials (pDNA, siRNA). It is concluded that the layer-by-layer assembly could be a promising approach for production of graphene nano-sheets suitable for biological applications where a well dispersed and hydrocolloidally stable graphene nano-sheet is needed.
Conflict of interest
The authors declare no commercial or financial conflict of interest.
Acknowledgements
The authors wish to acknowledge the scientific help and guidance of Hojatollah Vali. We also gratefully acknowledge the technical assistants of Samira Taherkhani for confocal imaging.
References
- H. Y. Mao, S. Laurent, W. Chen, O. Akhavan, M. Imani, A. A. Ashkarran and M. Mahmoudi, Chem. Rev., 2013, 113, 3407–3424 CrossRef CAS PubMed.
- B. J. Hong, O. C. Compton, Z. An, I. Eryazici and S. T. Nguyen, ACS Nano, 2011, 6, 63–73 CrossRef PubMed.
- C. D. Walkey and W. C. Chan, Chem. Soc. Rev., 2012, 41, 2780–2799 RSC.
- J. Kim, L. J. Cote, F. Kim, W. Yuan, K. R. Shull and J. Huang, J. Am. Chem. Soc., 2010, 132, 8180–8186 CrossRef CAS PubMed.
- K. Yang, L. Feng, X. Shi and Z. Liu, Chem. Soc. Rev., 2013, 42, 530–547 RSC.
- A. M. Pinto, I. C. Gonçalves and F. D. Magalhães, Colloids Surf., B, 2013, 111, 188–202 CrossRef CAS PubMed.
- X. Tan, L. Feng, J. Zhang, K. Yang and S. Zhang, ACS Appl. Mater. Interfaces, 2013, 5, 1370–1377 CAS.
- X. Sun, Z. Liu, K. Welsher, J. T. Robinson, A. Goodwin, S. Zaric and H. Dai, Nano Res., 2008, 1, 203–212 CrossRef CAS PubMed.
- Z. Liu, J. T. Robinson, X. Sun and H. Dai, J. Am. Chem. Soc., 2008, 130, 10876–10877 CrossRef CAS PubMed.
- K. Yang, S. Zhang, G. Zhang, X. Sun, S.-T. Lee and Z. Liu, Nano Lett., 2010, 10, 3318–3323 CrossRef CAS PubMed.
- L. Zhang, Z. Wang, Z. Lu, H. Shen, J. Huang, Q. Zhao, M. Liu, N. He and Z. Zhang, J. Mater. Chem. B, 2013, 1, 749–755 RSC.
- L. Feng, X. Yang, X. Shi, X. Tan, R. Peng, J. Wang and Z. Liu, Small, 2013, 9, 1989–1997 CrossRef CAS PubMed.
- F.-F. Cheng, W. Chen, L.-H. Hu, G. Chen, H.-T. Miao, C. Li and J.-J. Zhu, J. Mater. Chem. B, 2013, 1, 4956–4962 RSC.
- V. Georgakilas, M. Otyepka, A. B. Bourlinos, V. Chandra, N. Kim, K. C. Kemp, P. Hobza, R. Zboril and K. S. Kim, Chem. Rev., 2012, 112, 6156–6214 CrossRef CAS PubMed.
- K. P. Loh, Q. Bao, P. K. Ang and J. Yang, J. Mater. Chem., 2010, 20, 2277–2289 RSC.
- X. Qi, K. Y. Pu, H. Li, X. Zhou, S. Wu, Q. L. Fan, B. Liu, F. Boey, W. Huang and H. Zhang, Angew. Chem., Int. Ed., 2010, 49, 9426–9429 CrossRef CAS PubMed.
- J. Shen, Y. Hu, C. Li, C. Qin and M. Ye, Small, 2009, 5, 82–85 CrossRef CAS PubMed.
- R. Imani, S. H. Emami and S. Faghihi, J. Nanopart. Res., 2015, 17, 1–15 CrossRef CAS.
- A. H. Nguyen, J. McKinney, T. Miller, T. Bongiorno and T. C. McDevitt, Acta Biomater., 2015, 13, 101–110 CrossRef CAS PubMed.
- Y.-J. Lu, K.-C. Wei, C.-C. M. Ma, S.-Y. Yang and J.-P. Chen, Colloids Surf., B, 2012, 89, 1–9 CrossRef CAS PubMed.
- D. R. Dreyer, S. Park, C. W. Bielawski and R. S. Ruoff, Chem. Soc. Rev., 2010, 39, 228–240 RSC.
- S. Stankovich, D. A. Dikin, R. D. Piner, K. A. Kohlhaas, A. Kleinhammes, Y. Jia, Y. Wu, S. T. Nguyen and R. S. Ruoff, Carbon, 2007, 45, 1558–1565 CrossRef CAS.
- C. Cheng, S. Nie, S. Li, H. Peng, H. Yang, L. Ma, S. Sun and C. Zhao, J. Mater. Chem. B, 2013, 1, 265–275 RSC.
- S. Park, J. An, I. Jung, R. D. Piner, S. J. An, X. Li, A. Velamakanni and R. S. Ruoff, Nano Lett., 2009, 9, 1593–1597 CrossRef CAS PubMed.
- Y. Shang, D. Zhang, Y. Liu and C. Guo, Bull. Mater. Sci., 2015, 38, 7–12 CrossRef CAS.
- Z. Liu, S. M. Tabakman, Z. Chen and H. Dai, Nat. Protoc., 2009, 4, 1372–1382 CrossRef CAS PubMed.
- Y. Kang and T. A. Taton, J. Am. Chem. Soc., 2003, 125, 5650–5651 CrossRef CAS PubMed.
- S. Mössmer, J. P. Spatz, M. Möller, T. Aberle, J. Schmidt and W. Burchard, Macromolecules, 2000, 33, 4791–4798 CrossRef.
- Q. Li, B. Sun, I. A. Kinloch, D. Zhi, H. Sirringhaus and A. H. Windle, Chem. Mater., 2006, 18, 164–168 CrossRef CAS.
- A. C. Greene, J. Zhu, D. J. Pochan, X. Jia and K. L. Kiick, Macromolecules, 2011, 44, 1942–1951 CrossRef CAS PubMed.
- R. Imani, S. H. Emami and S. Faghihi, Phys. Chem. Chem. Phys., 2015, 17, 6328–6339 RSC.
- H. Kim and W. J. Kim, Small, 2014, 10, 117–126 CrossRef CAS PubMed.
|
This journal is © The Royal Society of Chemistry 2016 |
Click here to see how this site uses Cookies. View our privacy policy here.