Thermal decomposition kinetics of light polycyclic aromatic hydrocarbons as surrogate biomass tar

Chao Gaia, Yuping Dong*b, Shuai Yangb, Zhaoling Zhangc, Jingcui Liangc and Jingdong Lic
aResearch Center for Eco-Environmental Sciences, Chinese Academy of Sciences, 18 Shuangqing Road, Beijing 100085, PR China
bSchool of Mechanical Engineering, Shandong University, 17923 Jingshi Road, Jinan 250061, PR China. E-mail: dongyp@sdu.edu.cn; Tel: +86 531 88392199
cShandong Baichuan Tongchuang Energy Company Ltd, Jinan 250101, PR China

Received 15th June 2016 , Accepted 12th August 2016

First published on 12th August 2016


Abstract

Thermal decomposition of the two light polycyclic aromatic hydrocarbons (PAHs) naphthalene and anthracene as tar model compounds was investigated with a lab-scale fluidized bed reactor. Pyrolysis kinetics for the four main gaseous products, namely hydrogen, methane, ethylene and propane, were evaluated. Experimental results indicated that naphthalene with two fused benzene rings was easier to be decomposed than anthracene with three fused benzene rings. The apparent activation energies of hydrogen, methane, ethylene and propane for naphthalene were 33.9 kJ mol−1, 51.7 kJ mol−1, 49.1 kJ mol−1 and 27.2 kJ mol−1, respectively. The apparent activation energies of hydrogen, methane, ethylene and propane for anthracene were 148.0 kJ mol−1, 52.2 kJ mol−1, 86.4 kJ mol−1 and 63.8 kJ mol−1, respectively. The most probable reaction mechanisms describing the evolution profiles of individual gas components from the pyrolysis of the two PAHs were three-dimensional diffusion for hydrogen, methane, and propane, as well as chemical reaction for ethylene.

1 Introduction

Increasing greenhouse gas levels worldwide from anthropogenic activities like the combustion of fossil fuels for power/heat generation is one of the major contributors to climate change. It necessitates a turning to renewable energy sources in terms of wind, solar photovoltaic, and biomass.1,2 As a carbon-neutral renewable source, biomass can be converted to renewable biofuels with various conversion approaches.3,4 Gasification can convert precursory biomass into syngas, which is viewed as one of the most promising ways to utilize abundant biomass. However, tar is an inevitable byproduct during the gasification process.5,6 This represents a wasting of energy, reducing gas calorific value and gasification efficiency, as well as affecting the stable and safe operation of the gasification equipment. Consequently, the efficient removal or conversion of biomass tar has become one of the key issues in large-scale biomass gasification processes. Tars can be removed by physical and thermal cracking (non-catalytic or catalytic) measures. Thermal cracking is a technically and economically interesting approach for gas cleaning, which has received increasing attention.7,8 To investigate in detail the mechanism of thermal cracking of biomass tar, it is essential to simplify the reaction process by applying suitable surrogate biomass tar and precise lab-scale reactors.

The composition of tar is extremely complex in terms of phenolic, alkylated aromatic and polycyclic aromatic hydrocarbons (PAHs).9–11 To overcome the complexity of tar, researchers have conducted extensive studies on several tar model compounds in terms of phenolic compounds (e.g., phenol, cresols) and alkylated aromatic compounds (e.g., toluene, xylene, styrene).12 Previous studies showed that phenolic and aromatic compounds are easy to be degraded with increased temperatures. Gil et al.13 investigated the steam gasification of wood, who reported a 50% reduction of toluene when the temperature was raised from 700 to 900 °C. Brage et al.14 observed an almost complete reduction of phenol with an increase of temperature from 700 to 900 °C. However, the light PAH compounds such as naphthalene and anthracene are harder to thermally crack than phenolic and aromatic tar compounds.15 In addition, various gasification studies16,17 indicate that PAHs are the major components at relatively high temperatures (700–900 °C). According to Han et al.,12 the relative contents of naphthalene and anthracene in tar are usually above 9% and 3%. Coll et al.18 investigated the reactivity of five tar model compounds during the gasification process, and it was observed that naphthalene was the most suitable compound for use as a tar model compound during biomass gasification. Besides, soot formation during the catalytic cracking of tar should be paid special attention because the formed soot may deposit on the active sites of the inner pore surface of the catalyst, leading to the deactivation of the catalyst and decreasing the tar removal efficiency. According to Tesner et al.,19 the sooting tendencies for naphthalene and anthracene were both far higher than those for other components (e.g., aromatics, aliphatics) in biomass tar. Therefore, we used naphthalene and anthracene as tar model compounds in this work.

Different heating strategies have been applied to study the decomposition behavior of tar model compounds. To date, thermal cracking kinetics of tar model compounds has been investigated using different heating reactors such as thermogravimetric analyzer,20,21 fixed-bed reactor,22 continuous flow packed-bed reactor23 and tubular flow reactor.24 In this study, the pyrolysis behavior of the tar model compounds was investigated using a novel lab-scale fluidized bed reactor (FBR).25,26 The facility can strengthen the heat transfer and mass transfer of gas–solid reaction via the fluidized bed. Additionally, it can send the materials into the reactor instantaneously when the temperature within the reactor has been heated to a desired level, which can minimize the inhibition of diffusion.27 In this study, the thermal decomposition behavior of the two light PAH compounds naphthalene and anthracene as model compounds of biomass tar was studied using the FBR. The product distribution and evolution of non-condensed gas products as a function of temperature were investigated in the FBR. Pyrolysis kinetics of the two light PAHs were further determined. The most probable reaction models for major gaseous products during the decomposition of the two tar model compounds were further proposed.

2 Experimental section

2.1 Materials

Two light PAHs, naphthalene and anthracene, were chosen as model compounds of biomass tar. They were purchased from Sigma-Aldrich and used without further purification. Their properties are illustrated in Table 1.
Table 1 Polycyclic aromatic hydrocarbons applied in the pyrolysis experiment
Compound CAS # Formula Structure MW Purity Supplier
Naphthalene 91-20-3 C10H8 image file: c6ra15513h-u1.tif 128 98% Sigma-Aldrich
Anthracene 120-12-7 C14H10 image file: c6ra15513h-u2.tif 178 98% Sigma-Aldrich


2.2 Reactor system

Pyrolysis experiments of naphthalene and anthracene were conducted using a lab-scale fluidized bed reaction system, which is shown in Fig. 1. It is mainly composed of a quartz FBR, a sample-feeding device and process controlling system. The lab-scale quartz FBR is the key part of the system. The diameter of the reactor is 290 mm, and the height is 373 mm. The reaction zone's inner diameter is 20 mm and the height is 42 mm, which is similar to that of a thermogravimetric analyzer. The reaction zone has two uniform plates with evenly distributed holes for gas distribution. The sample is sent to the reaction zone via the sample-feeding device, which is driven by an electromagnetic valve that can inject the sample into the reactor within 0.1 s by a pulse. The pulsed gas originates from a compressed gas stream at 0.2 MPa via a tube with an inner diameter of 3 mm. The process mass spectrometer can measure the relative content of produced gas online. The temperatures of the electric furnace and reactor are controlled by a computer. Besides, the computer monitors the flow rate of the fluidizing gas, the pressures at the inlet and outlet of the reactor, actions of sample-feeding system and the output data from the process mass spectrometer.
image file: c6ra15513h-f1.tif
Fig. 1 Schematic of the lab-scale fluidized bed reaction system.

2.3 Experimental procedure

In this study, quartz sand with a mesh range of 65 to 80 was selected as the fluidizing medium. At the start of each test, 3.0 g of quartz sand was loaded into the FBR. 10 ± 0.1 mg solid sample was placed at the end of the inlet pipe of the sample-feeding system. The gas-tightness of the whole reaction system was inspected. Then the fluidizing gas, Ar (99.99% purity), was fed to the reactor to fluidize the materials in the reactor. Afterwards, the reactor was heated to preset temperatures. Then the pulse valve of the sample-feeding system was switched on to inject the sample into the reaction zone, which initiated the pyrolysis reaction.

According to Jess28 and Fuentes-Cano et al.,29 the thermal cracking of PAHs resulted in hydrocarbons with smaller carbon numbers, and intermediates such as toluene, indene or indane were formed to only a limited extent. In this study, the major non-condensable gases derived from pyrolysis of PAHs, including hydrogen (H2) as well as light hydrocarbons (C1–C3) such as methane (CH4), ethylene (C2H4) and propane (C3H8) were analyzed. Olefins (>C4) were negligible in this work. To determine the yield (in terms of mass against precursor feedstock) of each permanent gas, the gaseous products were all sampled for the entire reaction time and then analyzed by a Micro-GC 3000 (gas chromatograph) equipped with a TCD (thermal conductivity detector) and two columns (5A and GDX-104). The oven temperature was 60 °C, and the temperature for the TCD was 150 °C. The carrier gas was argon, and a standard gas mixture was applied to calibrate the yield of non-condensable gas. The sum of the individual gas yields was regarded as the total gas yield. The inner surface of the reactor was observed to be coated with a layer of soot during the tests, which is formed during the pyrolysis of larger PAHs.30 It was determined by weighing the FBR before and after the experiments.

The decomposition temperatures of naphthalene and anthracene ranged from 700 °C to 900 °C with 50 °C intervals. In this study, several preliminary tests were conducted to determine the minimum fluidization rate and optimum flow rate of the carrier gas. It was observed that the minimum fluidization rate for the quartz sand was 220 mL min−1. Furthermore, increasing the gas flow rate from 220 to 500 mL min−1 gradually increased the total gas yield, while a small variation of the total gas yield was observed when the flow rate was higher than 500 mL min−1. Consequently, to ensure the complete fluidization of the quartz sand, the flow rate of the carrier gas was maintained at a level of 500 mL min−1 in this study.

2.4 Kinetic approaches

Pyrolysis of a tar model compound is a complex physical and chemical process, including mass transfer and polymerization/depolymerization. The homogeneous reaction of the thermal decomposition of the two PAHs at different reaction temperatures is described as:
 
dx/dt = k(T) × f(x) (1)
where T is the reaction temperature, t is the reaction time, f(x) is the differential reaction model, and x is the conversion fraction of each gas component, which can be calculated through:
 
image file: c6ra15513h-t1.tif(2)
where t0 is the start time of pyrolysis reaction, te is the end time of pyrolysis reaction, C is the rate of volume for all gas components, and Ci is the rate of the volume fraction for the gas component i. It should be noted that a conversion fraction of 100% corresponds to the highest gas yield at the end of the reaction, and the time spent for increasing conversion fraction from 0 to 100% is defined as the reaction finishing time.

In eqn (1), k(T) is the rate constant of reaction and it is determined by the Arrhenius equation:6,31

 
k(T) = A[thin space (1/6-em)]exp(−Ea/RT) (3)
where Ea is the apparent activation energy, A is the pre-exponential factor, T is the thermodynamic temperature, and R is the gas constant, 8.314 J (mol K)−1.

Taking the logarithm of both sides of eqn (1) and (3) results in eqn (4) and (5), respectively:

 
image file: c6ra15513h-t2.tif(4)
 
image file: c6ra15513h-t3.tif(5)

Substituting eqn (5) into (4) gives:

 
image file: c6ra15513h-t4.tif(6)

At different temperatures, the points of ln(dx/dt) versus 1/T can be fitted to a straight line, and the apparent activation energy can be deduced from the slope which corresponds to −Ea/R.

Substituting eqn (3) into (1) gives:

 
dx/dt = A[thin space (1/6-em)]exp(−E/RT) × f(x) (7)

Carrying out the integration of both sides of eqn (7) in reaction time (t) under a certain temperature (T) gives a result that can be further integrated into eqn (8),

 
image file: c6ra15513h-t5.tif(8)
where G(X) is the integral reaction model. If the curve of G(X) versus t is linear, then k(T) is the slope, and G(X) with the highest linear correlation coefficient is the most probable reaction mechanism. Afterwards, a number of curves of x versus t at different temperatures could be obtained, and then we can get a set of values of k(T). Based on eqn (5), plots of ln[thin space (1/6-em)]k(T) versus 1/T can generate a straight line with a slope of −Ea/R to determine the apparent activation energy again. Then the proposed kinetic model for pyrolysis of the two PAHs can be determined based on the closeness of the values of apparent activation energies.

3 Results and discussion

3.1 Product yields

In the pyrolysis step, the two light PAHs undergo fast decomposition to products in different phases. Fig. 2 illustrates the product distribution during the pyrolysis of naphthalene and anthracene in the FBR at temperatures from 700 to 900 °C. Mass balance analyses indicate that a substantial fraction, 70–90 wt%, of the two PAHs was cracked into non-condensed gas, while 2–10 wt% of the two PAHs were converted to soot. The gas yields for the thermal cracking of the two PAHs are much higher than those of a fixed bed reactor, accompanied with a lower amount of solid carbonaceous residue (soot) formed during the pyrolysis process. This provides evidence of higher heating rate and more efficient mass-transfer in the FBR.
image file: c6ra15513h-f2.tif
Fig. 2 Product distribution for the thermal decomposition of naphthalene and anthracene at different temperatures.

Under identical temperature, the soot yield of naphthalene was slightly higher than that of anthracene. Tesner et al.19 developed sooting tendency factors (N0/N0(CH4), where N0 refers to the number of soot particles in 1 g of soot) as a means to compare the soot formation during pyrolysis of different PAHs. The reported sooting tendency for naphthalene (110) was higher than that for anthracene (102). This provides quantitative evidence suggesting that more soot will be formed during the pyrolysis of naphthalene than during that of anthracene, which is verified by the mass balance analyses in this work. Additionally, a rapid increase of soot yield was observed at 800 °C for naphthalene (from 4.4 to 8.7%) and at 850 °C for anthracene (from 3.2 to 7.9%). This implies that a transition temperature for soot formation of naphthalene is 800 °C while the polymerization of anthracene occurs at a higher temperature (850 °C).

The mass balance was not closed. Around 1–17 wt% of naphthalene and 6–25 wt% of anthracene could not be quantitatively determined (Fig. 2). Some soot precursor species derived from the thermal cracking of PAHs may account for the incomplete balance. Besides, some PAHs may have left from the reactor without reaction because naphthalene and anthracene are quite volatile at higher temperatures.32 A certain amount of PAHs may also be adsorbed on the soot. Sánchez et al.33 reported that the amount of PAHs adsorbed on the soot during the pyrolysis of PAHs was much larger than that adsorbed on the reactor wall or retained in the outlet gas. As shown in Fig. 2, increasing the temperature promoted soot formation and inhibited undetected compounds. Therefore, it could be speculated that some PAHs adsorbed on the soot may be converted to soot as the temperature is increased. Follow-up experiments should take into account the PAHs adsorbed on both the soot and reactor walls.

The gas produced during the cracking process accounted for approximately 70–90 wt% of the two PAHs, and the evolutions of gas composition as a function of cracking temperature are illustrated in Fig. 3. The gaseous products produced from the two PAHs were predominantly ethylene and propane with trace amounts of methane and hydrogen. The yields of various gaseous products have different variations as a function of temperature. As shown in Fig. 3, the yields of propane for the two PAHs both underwent a process of a fall after a rise. This suggests that a further increase of temperature promotes the decomposition of propane to form methyl and ethyl radicals.34 The methyl radical is the main source for methane production, which is very active and can react with hydrogen or ethylene to form methane.35 Therefore, the continuously increased methane yield shown in Fig. 3 suggests that the reaction between ethylene and methyl radicals from propane to form methane is favored during the decomposition of the two PAHs at higher temperatures. It accounts for the decrease of ethylene and propane at higher temperatures. Besides, ethylene is an important precursor of PAHs and soot, which can undergo simultaneous dehydrogenation in the gas phase to generate PAHs and soot via the hydrogen abstraction acetylene addition (HACA) route.36,37 In this work, the decreased yield of ethylene as a function of temperature (Fig. 3) is consistent with the increased soot (Fig. 2) for the two PAHs, implying that more ethylene produced from the decomposition of the two PAHs is converted to soot at higher temperatures. This observation is in accordance with the findings of Sánchez et al.,38 who investigated the pyrolysis of ethylene and observed that soot formation was enhanced for ethylene pyrolysis with increased temperature.


image file: c6ra15513h-f3.tif
Fig. 3 Evolution of gas composition during thermal cracking of naphthalene and anthracene as a function of temperature.

Increasing the cracking temperature from 700 to 900 °C caused a gradual increase of hydrogen for the two PAHs. The decomposition of PAH in tars is usually explained by a dehydrogenating polymerization process accompanied with an aromatization growth,39 notwithstanding that a comprehensive knowledge of this process is currently not available due to the complexity of reactions that occur during biomass pyrolysis. During the cracking of PAHs, hydrogen is mostly generated from the dehydrogenation process (pCxHyqCnHm + rH2; where n < x and m < y), which reflects the extent of the tar polymerization reaction. In this work, the hydrogen yields derived from the two PAHs both increased gradually with increased temperature, although hydrogen accounted for a smaller fraction of the total gas yield. Similar to that described by Anis et al.,40 an increase of hydrogen yield with increased temperature during the pyrolysis of toluene was also observed. This provides evidence implying that the polymerization of naphthalene and anthracene occurs during the thermal decomposition process, and it is promoted by increased temperature. Huang et al.41 employed a density functional theory to study the decomposition pathway of aromatic hydrocarbons during the coal pyrolysis process. It was reported that the hydrogen atoms play an important role in the initiation of benzene decomposition. In tar pyrolysis, the role of hydrogen is more like a hydrogen transfer intermediate, which contributes to the decomposition of heavy tar compounds into lighter tar molecules and polymerizes smaller tar species into larger tar components.28

3.2 Gas evolution profiles of pyrolysis of naphthalene and anthracene

During the pyrolysis of naphthalene and anthracene in the FBR, the release characteristics of individual gas components, including H2, CH4, C2H4 and C3H8, at the preset temperatures of 700–900 °C were determined and are shown in Fig. 4 and 5, respectively. As expected, for the same non-condensed gas, the time for the reaction to finish was greatly decreased with increasing cracking temperature. This is a kinetic effect, where a higher temperature promotes the reaction rate of the thermal cracking of these tar compounds to generate gaseous products. Additionally, at a certain cracking temperature, it can be seen that the reaction rate at the initial stage is the highest for each individual gas. This is because the tar model compounds were sent into the reaction zone at the required reaction temperature instead of room temperature.
image file: c6ra15513h-f4.tif
Fig. 4 Evolution of conversion fractions versus reaction time at different temperatures for the thermal decomposition of naphthalene.

image file: c6ra15513h-f5.tif
Fig. 5 Evolution of conversion fractions versus reaction time at different temperatures for the thermal decomposition of anthracene.

Some differences could be observed for the pyrolysis process of the two model compounds in the FBR. At higher temperatures, the time for the reaction to finish for each individual gas from the same model compound is not very different. For example, at a temperature of 900 °C, the reaction finishing time of the four gaseous products from pyrolysis of naphthalene was all around 15–20 s, which was lower than that of anthracene (approximately 40 s for each gas component). The chemical structures for the two tar model compounds are different, although they are both PAHs. This provides evidence implying that during the thermal cracking of PAHs, it takes more time to break down three fused benzene rings into small molecules than it does to break down compounds with two fused benzene rings. However, at lower temperatures, the time for the reaction to finish for different gas components is different. For the pyrolysis of naphthalene, the reaction finishing time of CH4 and C2H4 was longer than that of H2 and C3H8, while the reaction finishing time of H2 and C2H4 was longer than that of CH4 and C3H8 for anthracene. This indicates that during the pyrolysis process of naphthalene and anthracene, the releasing pathways of different gas components should be different, especially for C2H4, which will be analyzed in the next section.

3.3 Pyrolysis kinetics of naphthalene and anthracene

Apparent activation energies for the main gas components during the pyrolysis of naphthalene and anthracene in the FBR were first calculated and are shown in Table S1. According to the literature,42,43 the nineteen most common reaction models for thermal cracking of biomass tar were applied in this study to fit the evolution profiles of individual gas components during the pyrolysis of naphthalene and anthracene, which is available in the ESI (Table S2). Among the nineteen models, five reaction models with best linearity were selected and plotted (Fig. S1 and S2). The corresponding apparent activation energies and fitting accuracy calculated are illustrated in Tables S3 and S4. Among the five probable reaction models selected, the most probable reaction model describing the kinetic process was determined based on the closest values of apparent activation energy deduced from Tables S1–S4. Table 2 illustrates the proposed reaction models and kinetic parameters for individual gas components during the thermal cracking of the two PAHs in the FBR.
Table 2 Proposed reaction models and kinetic parameters for individual gas components during the thermal cracking of naphthalene and anthracene
PAH Gas Ea (kJ mol−1) Reaction mechanism G(X)
Naphthalene Hydrogen 33.9 Three-dimensional diffusion (A–J) [(1 + x)1/3 − 1]2
Methane 51.7 Three-dimensional diffusion (Jander) [1 − (1 − x)1/3]2
Ethylene 49.1 Chemical reaction (n = 2) (1 − x)−1 − 1
Propane 27.2 Three-dimensional diffusion (Jander) [1 − (1 − x)1/3]2
Anthracene Hydrogen 148.0 Three-dimensional diffusion (Jander) [1 − (1 − x)1/3]2
Methane 52.2 Three-dimensional diffusion (Jander) [1 − (1 − x)1/3]2
Ethylene 86.4 Chemical reaction (n = 1) −ln(1 − x)
Propane 63.8 Three-dimensional diffusion (G–B) 1 − 2x/3 − (1 − x)2/3


A reaction with lower apparent activation energy requires less energy to break down the chemical bonds between atoms and hence the reaction rate is faster, accompanied with a shorter residence time. During the pyrolysis of naphthalene, the apparent activation energies of CH4 (51.7 kJ mol−1) and C2H4 (49.1 kJ mol−1) were higher than those of H2 (33.9 kJ mol−1) and C3H8 (27.2 kJ mol−1). In terms of the pyrolysis of anthracene, the apparent activation energies of H2 (148.0 kJ mol−1) and C2H4 (86.4 kJ mol−1) were higher than those of CH4 (52.2 kJ mol−1) and C3H8 (63.8 kJ mol−1). The values of apparent activation energy for individual gas components were consistent with the corresponding reaction finishing time observed in Fig. 4 and 5. This provides evidence suggesting that compared to the thermal decomposition of anthracene, the dehydrogenating process is more favored for naphthalene. Apparent activation energies of the thermal decomposition of other tar model compounds in the literature were reported in the range of 63–72 kJ mol−1 for naphthalene,29 150–156 kJ mol−1 for benzene,44 and 197–281 kJ mol−1 for toluene.45 It is difficult, however, to make direct comparisons between the activation energies reported in the literature and those calculated in this work, as tar precursor species, reactor scales and operation conditions all influence the thermal decomposition pathway of the tar model compounds.

In this work, for the same gas component, the apparent activation energy for the pyrolysis of naphthalene was lower than that for anthracene. This further verifies that for the two tar model compounds, the thermal cracking of naphthalene with two-membered rings is easier than that of anthracene with three-membered rings. For the reaction of PAHs with atmospheric oxidants (e.g. OH), Keyte et al.46 reported that 3-ring PAHs are more stable than 2-ring structures at higher temperatures. Brubaker et al.47 studied the kinetics of the 4-ring fluoranthene and concluded that it would form a more stable OH-adduct than 2- or 3-ring structures. Liu et al.48 also observed that a five-membered ring was easier to decompose than a six-membered ring. Taking into account the differences in the experimental facilities and reaction conditions, the result in this work coincides with those of previous literature.

As shown in Table 2, the reaction mechanism of three-dimensional diffusion could describe most individual gas components during the pyrolysis of the two PAHs in the FBR, including hydrogen, methane, and propane. The production of hydrogen from naphthalene and anthracene followed three-dimensional diffusion (A–J) and three-dimensional diffusion (Jander), respectively. The generation of propane from naphthalene, via three-dimensional diffusion (Jander), was also slightly different from that from anthracene via three-dimensional diffusion (G–B). As shown in Fig. 3, the critical temperature of the rapid increase in hydrogen concentration for naphthalene (800 °C) was different from that for anthracene (850 °C). The turning point of the propane yield produced from the decomposition of naphthalene and anthracene as a function of temperature was 800 and 850 °C, respectively. This implies that tar polymerization reactions and decomposition of propane during the pyrolysis of naphthalene and anthracene are favored by different temperatures. Therefore, the hydrogen and propane generated from naphthalene follow different reaction models from that of anthracene.

The release of ethylene for the two tar model compounds was described by the mechanism of chemical reaction with different reaction orders (n = 2 for naphthalene and n = 1 for anthracene), which is totally different from the other three gaseous products. It is likely that during the thermal decomposition of the two PAHs, the reaction pathway for ethylene is greatly different from that for other gaseous products. During the decomposition of the two PAHs, the ethylene may be aromatized via a reversible Diels–Alder reaction, which occurs between a conjugated diene and a substituted alkene to generate a substituted cyclohexene system. Literature indicated that the thermal decomposition pathways of PAHs are dependent on the type of PAH radical sites in terms of zigzag, free-edge, and armchair.48,49 To provide a theoretical basis for the decomposition pathways of PAHs, a detailed density functional theory investigation is recommended for further study.

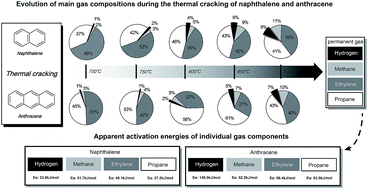
It should be noted that, in this study, two simple tar model compounds were used. Therefore, the thermal decomposition behavior and kinetic analysis of the two PAHs provide realistic results (shown in Fig. 6). We know that in real situations, biomass tar is not only a mixture of the two PAHs applied, but it is a complex mixture of various organic compounds. The components of tars can be divided into different classes by various aspects in terms of molecular weight, formation temperature and the number of rings of tar compounds.50,51 The interactions among the reaction intermediates produced from those tar components will greatly affect the reaction pathway of the thermal cracking of the PAHs.12 Some of the types of chemical interactions at the molecular level are still unknown. Furthermore, there are some differences between the laboratory-scale reactor applied in this study and a pilot-scale reactor. For example, the laboratory-scale reactor can provide very high heat and mass transfer rates that can rarely be achieved using industrial reactors. The microscale studies gave little thought to the secondary cracking reactions due to the short reaction time, which occur in industrial reactors. Consequently, a detailed investigation of thermal decomposition characteristics of real tar at the pilot scale may provide new insights into the reaction mechanisms of tar reduction, which is recommended for future study.


image file: c6ra15513h-f6.tif
Fig. 6 Thermal decomposition behavior and kinetic analysis of naphthalene and anthracene in lab-scale fluidized bed reaction system.

4 Conclusions

Thermal decomposition kinetics of two light PAHs as tar model compounds, naphthalene and anthracene, were studied using a novel lab-scale FBR. The results revealed that naphthalene with two-membered rings was easier to decompose than anthracene with three-membered rings during the thermal cracking of biomass tar. More soot was formed for naphthalene than for anthracene under identical decomposition temperature. The main gaseous products generated from the two PAHs were ethylene and propane with smaller amounts of methane and hydrogen. Dehydrogenating polymerization plays a key role in the thermal decomposition of the two PAHs and in soot formation. The results imply that for the thermal decomposition of PAHs derived from biomass pyrolysis/gasification, the critical temperatures affecting the distribution of gaseous products as well as soot yield for naphthalene and anthracene are 800 °C and 850 °C, respectively. Besides, a detailed analysis of the chemical composition of the soot may help us investigate the reaction mechanism of soot formation during the thermal cracking of PAHs, which is recommended for future study.

Acknowledgements

Financial support for this study that has been provided by the National Key Foundation for Exploring Scientific Instrument (2011YQ120039) is gratefully acknowledged.

References

  1. D. M. Alonso, J. Q. Bond and J. A. Dumesic, Catalytic conversion of biomass to biofuels, Green Chem., 2010, 12, 1493–1513 RSC.
  2. V. S. Sikarwar, M. Zhao, P. Clough, J. Yao, X. Zhong, M. Z. Memon, N. Shah, E. J. Anthony and P. S. Fennell, Energy Environ. Sci., 2016 10.1039/c6ee00935b.
  3. A. Arregi, G. Lopez, M. Amutio, I. Barbarias, J. Bilbao and M. Olazar, RSC Adv., 2016, 6, 25975–25985 RSC.
  4. G. Gordillo, K. Annamalai and N. Carlin, Renewable Energy, 2009, 34, 2789–2797 CrossRef CAS.
  5. J. R. Kastner, S. Mani and A. Juneja, Fuel Process. Technol., 2015, 130, 31–37 CrossRef CAS.
  6. G. Taralas and M. G. Kontominas, J. Anal. Appl. Pyrolysis, 2006, 76, 109–116 CrossRef CAS.
  7. Z. Abu EI-Rub, E. A. Bramer and G. Brem, Review of catalysts for tar elimination in biomass gasification processes, Ind. Eng. Chem. Res., 2004, 43, 6911–6919 CrossRef.
  8. D. Mei, V. M. Lebarbier, R. Rousseau, V. A. Glezakou, K. O. Albrecht, L. Kovarik, M. Flake and R. A. Dagle, ACS Catal., 2013, 3, 1133–1143 CrossRef CAS.
  9. R. Shu, Q. Zhang, Y. Xu, J. Long, L. Ma, T. Wang, P. Chen and Q. Wu, RSC Adv., 2016, 6, 5214–5222 RSC.
  10. A. M. Fraind and J. D. Tovar, J. Phys. Chem. B, 2010, 114, 3104–3116 CrossRef CAS PubMed.
  11. H. Zhou, C. Wu, J. A. Onwudili, A. Meng, Y. Zhang and P. T. Williams, RSC Adv., 2015, 5, 11371–11377 RSC.
  12. J. Han and H. Kim, Renewable Sustainable Energy Rev., 2008, 12, 397–416 CrossRef CAS.
  13. J. Gil, J. Corella, M. P. Aznar and M. A. Caballero, Biomass Bioenergy, 1999, 17, 389–403 CrossRef CAS.
  14. C. Brage, Q. Yu, G. Chen and K. Sjöström, Biomass Bioenergy, 2000, 18, 87–91 CrossRef CAS.
  15. Q. Sun, S. Yu, F. Wang and J. Wang, Fuel, 2011, 90, 1041–1048 CrossRef CAS.
  16. C. Font Palma, Appl. Energy, 2013, 111, 129–141 CrossRef CAS.
  17. J. N. Putro, F. E. Soetaredjo, S. Y. Lin, Y. H. Ju and S. Ismadji, RSC Adv., 2016, 6, 46834–46852 RSC.
  18. R. Coll, J. Salvado, X. Farriol and D. Montane, Fuel Process. Technol., 2001, 74, 19–31 CrossRef CAS.
  19. P. A. Tesner and S. V. Shurupov, Combust. Sci. Technol., 1997, 126, 139–151 CrossRef CAS.
  20. J. F. Saldarriaga, R. Aguado, A. Pablos, M. Amutio, M. Olazar and J. Bilbao, Fuel, 2015, 140, 744–751 CrossRef CAS.
  21. C. Gai, Y. Dong and T. Zhang, Bioresour. Technol., 2013, 127, 298–305 CrossRef CAS PubMed.
  22. C. Brage, Q. Yu and K. Sjöström, Fuel, 1996, 75, 213–219 CrossRef CAS.
  23. S. Mani, J. R. Kastner and A. Juneja, Fuel Process. Technol., 2013, 114, 118–125 CrossRef CAS.
  24. G. Taralas, M. G. Kontominas and X. Kakatsios, Energy Fuels, 2003, 17, 329–337 CrossRef CAS.
  25. F. Guo, Y. Dong, Z. Lv, P. Fan, S. Yang and L. Dong, Energy Convers. Manage., 2016, 108, 201–218 Search PubMed.
  26. Y. Mao, Y. Dong, B. Wang, J. Chang, J. Yu, Y. Zhang, Y. Huo and C. Sun, RSC Adv., 2015, 5, 82845–82852 RSC.
  27. J. Yu, C. Yao, X. Zeng, S. Geng, L. Dong, Y. Wang, S. Gao and G. Xu, Chem. Eng. J., 2011, 168, 839–847 CrossRef CAS.
  28. A. Jess, Fuel, 1996, 75, 1441–1448 CrossRef CAS.
  29. D. Fuentes-Cano, A. Gómez-Barea, S. Nilsson and P. Ollero, Chem. Eng. J., 2013, 228, 1223–1233 CrossRef CAS.
  30. A. W. Palumbo, J. C. Sorli and A. W. Weime, Appl. Energy, 2015, 157, 13–24 CrossRef CAS.
  31. S. R. Chandrasekaran and P. K. Hopke, Bioresour. Technol., 2012, 125, 52–58 CrossRef CAS PubMed.
  32. J. Aihara, Phys. Chem. Chem. Phys., 1999, 1, 3193–3197 RSC.
  33. N. E. Sánchez, A. Callejas, A. Millera, R. Bilbao and M. U. Alzueta, Energy, 2012, 43, 30–36 CrossRef.
  34. Z. P. Tang, A. J. Li, Z. W. Zhang, X. Ma, W. Wang, J. M. Fang and R. C. Bai, Ind. Eng. Chem. Res., 2014, 53, 17537–17546 CrossRef CAS.
  35. K. Norinaga and O. Deutschmann, Ind. Eng. Chem. Res., 2007, 46, 3547–3557 CrossRef CAS.
  36. H. Wang and M. Frenhlach, Combust. Flame, 1997, 110, 173–221 CrossRef CAS.
  37. D. B. Murphy, R. W. Carroll and J. E. Klonowski, Carbon, 1997, 35, 1819–1823 CrossRef CAS.
  38. N. E. Sánchez, A. Callejas, Á. Millera, R. Bilbao and M. U. Alzueta, Energy Fuels, 2012, 26, 4823–4829 CrossRef.
  39. A. M. Mastral and M. S. Callén, Environ. Sci. Technol., 2000, 34, 3051–3057 CrossRef CAS.
  40. S. Anis, Z. A. Zainal and M. Z. A. Bakar, Bioresour. Technol., 2013, 136, 117–125 CrossRef CAS PubMed.
  41. X. Huang, D. Cheng, F. Chen and X. Zhan, Int. J. Hydrogen Energy, 2012, 37, 18040–18049 CrossRef CAS.
  42. E. Ranzi, M. Corbetta, F. Manenti and S. Pierucci, Chem. Eng. Sci., 2014, 110, 2–12 CrossRef CAS.
  43. M. Puig-Amavat, J. C. Bruno and A. Coronas, Renewable Sustainable Energy Rev., 2010, 14, 2841–2851 CrossRef.
  44. P. A. Simell, N. A. K. Hakala and H. E. Haario, Ind. Eng. Chem. Res., 1997, 36, 42–51 CrossRef CAS.
  45. S. Anis and Z. A. Zainal, Bioresour. Technol., 2014, 151, 183–190 CrossRef CAS PubMed.
  46. I. J. Keyte, R. M. Harrison and G. Lammel, Chem. Soc. Rev., 2013, 42, 9333–9391 RSC.
  47. W. W. Brubaker and R. A. Hites, J. Phys. Chem. A, 1998, 102, 915–921 CrossRef CAS.
  48. P. Liu, H. Lin, Y. Yang, C. Shao, C. Gu and Z. Huang, J. Phys. Chem. A, 2014, 118, 11337–11345 CrossRef CAS PubMed.
  49. M. Celnik, A. Raj, R. West, R. Patterson and M. Kraft, Combust. Flame, 2008, 155, 161–180 CrossRef CAS.
  50. N. K. Kaisalo, M. L. Koskinen-Soivi, P. A. Simell and J. Lehtonen, Fuel, 2015, 153, 118–127 CrossRef CAS.
  51. L. P. L. M. Rabou, R. W. R. Zwart, B. J. Vreugdenhil and L. Bos, Energy Fuels, 2009, 23, 6189–6198 CrossRef CAS.

Footnote

Electronic supplementary information (ESI) available. See DOI: 10.1039/c6ra15513h

This journal is © The Royal Society of Chemistry 2016
Click here to see how this site uses Cookies. View our privacy policy here.