A T–Hg2+–T metallo-base pair-mediated dual amplification fluorescent strategy for the selective and sensitive detection of Hg2+

Haiping Weia, Lei Wangb, Xiaowen Xua, Jing Zhua and Wei Jiang*a
aKey Laboratory for Colloid and Interface Chemistry of Education Ministry, School of Chemistry and Chemical Engineering, Shandong University, 250100 Jinan, P. R. China. E-mail: wjiang@sdu.edu.cn; Fax: +86 531 88564464; Tel: +86 531 88363888
bSchool of Pharmaceutical Sciences, Shandong University, 250012 Jinan, P. R. China

Received 8th June 2016 , Accepted 20th July 2016

First published on 21st July 2016


Abstract

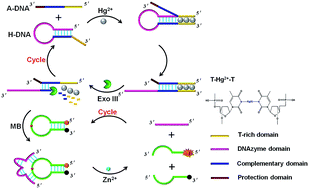
The mercuric ion is a highly toxic contaminant and causes severe harm to the environment and human health. Herein, a T–Hg2+–T metallo-base pair-mediated dual amplification fluorescent strategy was proposed for the selective and sensitive detection of Hg2+ based on a target cycle and DNAzyme cycle. First, Hg2+ selectively bound with T–T mismatches in H-DNA and A-DNA to form stable T–Hg2+–T metallo-base pairs. This initiated the strand displacement between H-DNA and A-DNA to obtain the Hg2+-mediated partial double-stranded structure, with a blunt 3′-terminus of the opened H-DNA (donated as the Hg-complex). Next, under the action of Exo III, the Hg-complex was digested to release DNAzyme, A-DNA and Hg2+. The released Hg2+ could bind with another A-DNA and H-DNA, and the target cycle started anew, eventually generating numerous DNAzymes. DNAzymes then catalyzed the cleavage of a molecular beacon (MB) to generate free fluorophores. Upon cleavage, DNAzymes were released and continuously hybridized with another MB to trigger a second DNAzyme cycle. Finally, numerous fluorophores were liberated, resulting in a significantly amplified signal. The strategy showed a good linear relationship in the range from 2.0 × 10⁻¹⁰ mol L−1 to 1.0 × 10⁻⁸ mol L−1, with a detection limit of 7.2 × 10⁻¹¹ mol L−1. The proposed strategy exhibited remarkable selectivity towards Hg2+ against other metal ions. Furthermore, this strategy was successfully applied to detect Hg2+ in real water samples. The proposed strategy provided a reliably quantitative candidate for potential application in environmental monitoring and biotoxicity analysis.

1. Introduction

The mercuric ion (Hg2+) is a serious environmental pollutant and accumulates in vital organs through the food chain and even damages the nervous system, kidneys and other organs due to its high toxicity and bioaccumulation.1–4 Therefore, accurate quantification of Hg2+ is crucial for environmental monitoring and biotoxicity analysis. Traditional methods including atomic absorption spectroscopy (AAS) and inductively coupled plasma mass spectroscopy (ICP-MS) have been developed for routine Hg2+ detection.5–9 To avoid the sophisticated instrument requirement and complicated sample preparation, some other methods have been built on the basis of electrochemical, colorimetric and fluorescent techniques.10–12 Among these methods, fluorescent methods have attracted broad attention due to their good accuracy and high sensitivity.13–15

Small organic molecule-based fluorescent methods have been developed for Hg2+ detection by changing the structure of organic molecule upon binding to Hg2+ for the enhanced signals.14,15 However, the similar metal ions, such as Ag+ and Zn2+, may initiate the same process, leading to the poor selectivity of Hg2+ detection and the limitation in practical application. Recently, Hg2+ against other metal ions specifically inserts into the T–T mismatches in duplex DNA to form stable T–Hg2+–T metallo-base pairs, reported by Ono and coworkers, offering a selective approach for Hg2+ binding.16–18 On the basis of this finding, highly selective Hg2+ detection methods have been developed by using the interaction between two T-rich probes and Hg2+ to directly obtain a detectable fluorescent signals.19–24 But the further improvement in analytical performances, especially the sensitivity, is still an urgent need to satisfy the requirement of Hg2+ detection in environmental monitoring and biotoxicity analysis.

To improve the sensitivity, enzyme-assisted signal amplification strategies are introduced into Hg2+ detection methods. Among them, the Exo III-assisted target cycle has been employed to detect Hg2+ because Exo III has catalytic activity on T–Hg2+–T metallo-base pairs and do not require the specific recognition sequence.25–28 In these strategies, Exo III hydrolyzes the duplex DNA containing T–Hg2+–T metallo-base pairs and meanwhile Hg2+ is released for a new cycle. However, the Exo III-assisted hydrolysis process destroys the whole structure of probes, which does not trigger a second cycle for the higher sensitivity. In 2013, Liang and coworkers reported that Hg2+ can selectively bind with the T–T mismatches to form T–Hg2+–T metallo-base pairs, which serves as a “metallo-toehold” to trigger the strand displacement reaction.29 On the basis of this finding, we hypothesized that the proper probes can be designed to obtain the Hg2+-mediated partial single-stranded structure, which can be retained for a new cycle under the action of Exo III. So, the T–Hg2+–T metallo-base pairs, serving as a “metallo-toehold”, could provide a powerful tool to build the multiple amplification strategy for the Hg2+ detection.

In this work, we proposed a T–Hg2+–T metallo-base pairs-mediated dual amplification strategy for the selective and sensitive detection of Hg2+ based on target cycle and DNAzyme cycle. Assistant DNA probes (A-DNA) with T-rich, complementary and protection domains are brought into proximity to hairpin DNA probes (H-DNA) with overhanging T-rich domain by the formation of T–Hg2+–T metallo-base pairs. And the T–Hg2+–T metallo-base pairs initiate the stranded displacement reaction between H-DNA and A-DNA to open the DNAzyme-blocked hairpin structure, forming the Hg2+-mediated partial double-stranded structure (donated as Hg-complex). Under the action of Exo III, the Hg-complex is digested to release DNAzyme, A-DNA and Hg2+. The released Hg2+ can bind with another A-DNA and H-DNA to start target cycle, eventually generating numerous DNAzymes. DNAzymes then catalyze the cleavage of molecular beacon (MB) and continuously hybridize with another MB to trigger a second DNAzyme cycle. The dual amplification strategy is built and achieves the selective and sensitive detection of Hg2+ in real water samples. Therefore, the proposed method provides reliably quantitative candidate for practical applications in environmental monitoring and biotoxicity analysis.

2. Experimental section

2.1. Materials and apparatus

The oligonucleotides used in this work were synthesized and purified by Sangon Inc. (Shanghai, China) and the sequences were listed in Table S1. Thermodynamic parameters and secondary structures of all oligonucleotides were calculated using IDT web tool (http://www.idtdna.com/calc/analyzer). Standard mercury in 2–5% nitric acid was purchased from J&K Scientific Ltd. (Beijing, China). Exonuclease III (Exo III) was purchased from Thermo Fisher Scientific Ltd. (Shanghai, China). Other reagents and chemicals used in this work were of analytical grade. All the solutions were prepared by standard methods with ultrapure water (>18.25 MΩ cm). Tap water was obtained from our laboratory. Lake water was collected from Baiyun Lake (Jinan, China). River water was taken from Yellow River (Jinan, China). The waste water was obtained from sewage treatment plant.

The fluorescence spectra were measured by Hitachi F-7000 fluorescence spectrometer (Hitachi. Ltd., Tokyo, Japan) with slits for excitation and emission both of 5.0 nm at the excitation of 494 nm. The fluorescence emission intensity at 520 nm was used to evaluate the performance of the proposed strategy. The polyacrylamide gels were imaged by GelDoc™ XR+ imaging system (Bio-RAD Laboratories Inc. USA). The pH was acquired on a Lei Ci PHS-3C pH-meter (Shanghai, China). Thermo Fisher Scientific X Series 2 inductively coupled plasma mass spectrometer (Thermo Fisher Scientific Ltd., Bremen, Germany) was used for analysis. The ultrapure water was obtained from a ULPURE UPH system (Xi'an, China).

2.2. Assays of polyacrylamide gel electrophoresis

To form the hairpin structure, H-DNA was denatured at 95 °C for 5 min and then slowly cooled down to room temperature in TM buffer (5.0 × 10⁻² mol L−1 Tris, 5.0 × 10⁻³ mol L−1 Mg(NO3)2, pH 8.50). For a typical polyacrylamide gel electrophoresis, the reaction mixture containing 3.0 × 10⁻⁷ mol L−1 H-DNA, 2.5 × 10⁻⁷ mol L−1 A-DNA, 1.0 × 10⁻⁶ mol L−1 Hg2+ and 50 U Exo III was prepared in TM buffer, respectively. The 15% polyacrylamide gels (PAGE) were freshly prepared in house. Before loading, the reacted samples were mixed with loading buffer with a volume ratio of 5[thin space (1/6-em)]:[thin space (1/6-em)]1. The PAGE were carried out in 1 × TBE (8.9 × 10⁻² mol L−1 Tris, 8.9 × 10⁻² mol L−1 boric acid, 2.0 × 10⁻³ mol L−1 EDTA, pH 8.30) at a constant voltage of 300 V for about 45 min at 15 °C. After separation, the PAGE containing samples were stained with ethidium bromide and imaged by GelDoc™ XR+ imaging system.

2.3. Assays for Hg2+ detection

To prepare the hairpin structures of H-DNA and MB, H-DNA and MB were denatured at 95 °C for 5 min and then slowly cooled down to room temperature in TM buffer, respectively. For a typical Hg2+ detection assay, the reaction mixture containing the prepared H-DNA, A-DNA, various concentrations of Hg2+, and TM buffer was incubated at 37 °C for 60 min to form the T–Hg2+–T metallo-base pairs. The Exo III was added to the above solution to catalyze the hydrolysis reaction. After standing at 37 °C for 120 min, the mixture was heated to 85 °C for 15 min to inactivate the Exo III and gradually cooled down to the room temperature. Then the prepared MB, 1.0 × 10⁻⁴ mol L−1 of Zn2+ and 10 × HEPES buffer (0.25 mol L−1 HEPES, 1.0 mol L−1 NaNO3, pH 7.00) were added into the above solution and the mixture was incubated at 37 °C for 30 min. The fluorescence emission spectra were measured under the proper conditions. The negative control contained identical reagents in positive control except Hg2+. All experiments were repeated three times.

2.4. Preparation of environmental water samples

The tap water, lake water, river water and waste water were filtered through a 0.22 μm membrane to remove the insoluble impurities, respectively. The tap water, lake water and river water were spiked with a certain concentration of Hg2+. 5% nitric acid was added to all the samples, and after 24 h the samples were high temperature and high pressure sterilization for 25 min. Then the samples were cooled down to room temperature and diluted 5 times in TM buffer. The prepared samples were then analyzed using the dual amplification strategy and the ICP-MS method, respectively.

3. Results and discussion

3.1. Principle of the dual amplification strategy

The principle of the proposed strategy for Hg2+ detection was illustrated in Scheme 1. Two DNA probes are rationally designed as H-DNA and A-DNA for satisfactory results, respectively. H-DNA contains the overhanging T-rich domain (in gold) and blocked DNAzyme domain (in rose). A-DNA includes T-rich domain (in gold), complementary domain (in blue) and protection domain (in coffee). Both the T-rich domains in H-DNA and A-DNA serve as recognition elements to selectively bind with Hg2+. Blocked DNAzyme is used for the subsequent DNAzyme cycle. The complementary domain initiates the strand displacement reaction and the protection domain in A-DNA assists the target cycle by Exo III, respectively. In the absence of the target, the two probes cannot interact with each other due to the three T–T mismatches in T-rich domains. There is nearly no free DNAzymes to generate signals. However, in the presence of Hg2+, Hg2+ can selectively bind with the T–T mismatches in T-rich domains of H-DNA and A-DNA to form stable T–Hg2+–T metallo-base pairs. This initiates the strand displacement reaction between H-DNA and A-DNA to obtain Hg-complex. In addition of Exo III, it can catalyze the stepwise removal of mononucleotides from the blunt 3′-terminus of the opened H-DNA in Hg-complex. As a result, Hg2+ is released and binds with another A-DNA and H-DNA to trigger target cycle, producing numerous DNAzymes. The obtained DNAzymes are able to hybridize with the added MB and repeatedly catalyze the cleavage of the MB in the presence of cofactor Zn2+ for DNAzyme cycle. Finally, numerous fluorophores are liberated, resulting in the significantly amplified signal. Therefore, the dual amplification strategy based on target cycle and DNAzyme cycle for Hg2+ detection can be successfully achieved.
image file: c6ra14910c-s1.tif
Scheme 1 Thematic illustration of the dual amplification fluorescent strategy based on target cycle and DNAzyme cycle for the selective and sensitive detection of Hg2+.

3.2. Feasibility and magnification of the proposed strategy

To test the feasibility and magnification of this strategy, the fluorescence emission spectra were investigated under various conditions. As shown in Fig. 1A, by comparing curve c and curve e, a 60% growth of fluorescent intensity was observed because the present Hg2+ could form the T–Hg2+–T metallo-base pairs to open DNAzymes for cycle cleavage. When target cycle was introduced to detection assays, the fluorescent intensity was a dramatic enhancement (curve f) compared with the negative signal (curve d). The 350% growth of signal indicated that the signals was significantly enhanced by the dual amplification strategy. Comparing to the signal growth of experimental results, the fluorescent signal was significantly enhanced by the Exo III-assisted target cycle. In the absence of H-DNA or A-DNA in the system respectively, however, the fluorescence responses (curve a and curve b) were a little lower than the negative control condition (curve d), which confirmed that the enhanced signals were obtained by the interaction between the Hg2+ and the thymine bases in H-DNA and A-DNA. In addition, the native polyacrylamide gel electrophoresis (PAGE) assay was used to verify the proposed strategy. As shown in Fig. 1B, the band of H-DNA or A-DNA in the system was visible (lane 1 and lane 2), respectively. The H-DNA and A-DNA in the system without Hg2+ did not produce new bands (lane 3), indicating that the interactions between H-DNA and A-DNA were extremely difficult. However, in the presence of target (lane 4), a new band showed the generation of H-DNA fragment and the A-DNA. These results indirectly suggested that Exo III could catalyze the hydrolysis of the Hg-complex to release the Hg2+ for target cycle.30
image file: c6ra14910c-f1.tif
Fig. 1 (A) Typical fluorescence emission spectra of the dual amplification strategy under different conditions: (a) A-DNA + Hg2+ + Exo III + MB, (b) H-DNA + Hg2+ + Exo III + MB, (c) A-DNA + H-DNA + MB, (d) A-DNA + H-DNA + Exo III + MB, (e) A-DNA + H-DNA + Hg2+ + MB, (f) A-DNA + H-DNA + Hg2+ + Exo III + MB. Conditions: CA-DNA = 1.0 × 10⁻⁷ mol L−1, CH-DNA = 1.2 × 10⁻⁷ mol L−1, Exo III = 50 U, CMB = 1.8 × 10⁻⁷ mol L−1, CHg2+ = 5.0 × 10⁻⁸ mol L−1. (B) Polyacrylamide gel electrophoresis (15%) analysis of the digestion capacity of Exo III. Lane 1: H-DNA + Hg2+ + Exo III. Lane 2: A-DNA + Hg2+ + Exo III. Lane 3: H-DNA + A-DNA + Exo III. Lane 4: H-DNA + A-DNA + Exo III + Hg2+. Conditions: CA-DNA = 2.5 × 10⁻⁷ mol L−1, CH-DNA = 3.0 × 10⁻⁷ mol L−1, Exo III = 50 U, CHg2+ = 1.0 × 10⁻⁶ mol L−1.

3.3. Optimization of the experimental conditions

The key point of the proposed strategy is the formation of duplex structure between H-DNA and A-DNA containing T–Hg2+–T metallo-base pairs and neighboring Watson–Crick pairs. Thus, the specific formation of T–Hg2+–T metallo-base pairs relates to the neighboring bases.31 On the basis of this point, six kinds of probes with different number of G/C bases in T-rich domains of H-DNA and A-DNA were rationally designed and investigated to achieve the optimal design. As shown in Fig. 2, with the increasing of the number of G/C bases, the positive fluorescence intensity significantly grew because Hg-complex could be more easily formed and the positive fluorescence intensity reached equilibrium after the number of G/C bases was more than six. For with the negative control, the signals slightly enhanced when the amount of G/C bases from three to six, while they effectively rose from six to eight, due to the formation of hydrogen bond in T-rich domains between H-DNA and A-DNA. In consideration of the above conditions, the T-rich domains with six G/C bases of H-DNA and A-DNA obtained the largest difference of the positive from negative fluorescence intensities (FF0). Hence, H-DNA and A-DNA with six G/C bases in T-rich domains were selected in our experiment design.
image file: c6ra14910c-f2.tif
Fig. 2 The effect of the G/C number in T-rich domains of A-DNA and H-DNA on fluorescence intensities. The light gray bars show the responses of the negative systems (F0). The dark gray bars represent the responses of the positive systems (F). Conditions: CA-DNA = 1.0 × 10⁻⁷ mol L−1, CH-DNA = 1.2 × 10⁻⁷ mol L−1, Exo III = 50 U, CMB = 1.8 × 10⁻⁷ mol L−1, CHg2+ = 5.0 × 10⁻⁸ mol L−1.

The experimental conditions have a great influence on the performance and results of the strategy, including the pH value and ionic strength of the buffer, the concentrations of DNA probes and MB, and the amount of Exo III. According to the simple variable method, the experimental parameters were investigated using the difference of the positive from negative fluorescence intensities (fluorescence increase, FF0) as standard to optimal the proper analytical parameters. The typical results of the corresponding conditions were demonstrated in Fig. S1–S6.

The formation of T–Hg2+–T metallo-base pairs in the duplex depended on the pH value.31 As shown in Fig. S1, with the change of pH value from 7.00 to 8.50, fluorescence increase gradually grew because the hydrogen ions were replaced from the thymine by Hg2+, resulting in the coordination N–Hg bonds.32 When the pH value was greater than 8.50, the signals slightly decreased due to the formation of Hg2+-related precipitation on high pH value conditions. The pH value of 8.50 was selected as the optimal parameter. The ionic strength has a strong impact on the stability of Watson–Crick base pairs.31 As shown in Fig. S2, fluorescence increase gradually grew and became almost leveled off at the concentration of 4.0 × 10⁻³ mol L−1 Mg2+. The 5.0 × 10⁻³ mol L−1 Mg2+ was used in the following experiment. The concentrations of DNA probes have a crucial effect on the amount of Hg-complex. According to the results (Fig. S3 and S4), fluorescence increase gradually grew and nearly stayed the same after the concentration of 8.0 × 10⁻⁸ mol L−1 A-DNA and 1.0 × 10⁻⁷ mol L−1 H-DNA, respectively. So, 1.0 × 10⁻⁷ mol L−1 A-DNA and 1.2 × 10⁻⁷ mol L−1 H-DNA were chosen as following experiment conditions. The dual amplification strategy strongly relied on the reaction of Exo III. As shown in Fig. S5, fluorescence increase gradually grew and reached leveled off when the amount of the Exo III was 40 U. Therefore, 50 U was employed as the proper amount of Exo III. As the key point of output signals, the concentration of MB was studied. As shown in Fig. S6, with the MB concentration increasing, fluorescence increase gradually grew and leveled off at 1.5 × 10⁻⁷ mol L−1. So, 1.8 × 10⁻⁷ mol L−1 MB was found to be the proper experiment condition.

3.4. Sensitivity and selectivity of the proposed strategy

Under the optimal experimental conditions, the assays with different concentrations of Hg2+ were measured to obtain the detection linear range and the sensitivity. The fluorescence spectra of various concentrations of Hg2+ were demonstrated in Fig. 3A. The fluorescence intensity was obviously enhanced with the increasing concentration of target. As shown in Fig. 3B, the difference of the positive and negative fluorescence intensities exhibited an excellent linear correlation with the concentrations of Hg2+ in the range from 2.0 × 10⁻¹⁰ mol L−1 to 1.0 × 10⁻⁸ mol L−1 (R = 0.998). According to the 3δ rule, the detection limit for Hg2+ was as low as 7.2 × 10⁻¹¹ mol L−1, which was better or comparable to the reported fluorescent amplification strategies for Hg2+ detection.25–28 Moreover, the proposed strategy was probe-assisted homogeneous reaction, which was more easy for Hg2+ to bind with the probes. The high sensitivity of our strategy was achieved on the basis of target cycle and DNAzyme cycle.
image file: c6ra14910c-f3.tif
Fig. 3 (A) Fluorescence emission spectra at different concentrations of Hg2+: (a) 0, (b) 2.0 × 10⁻¹⁰ mol L−1, (c) 1.0 × 10⁻⁹ mol L−1, (d) 2.5 × 10⁻⁹ mol L−1, (e) 5.0 × 10⁻⁹ mol L−1, (f) 7.5 × 10⁻⁹ mol L−1, (g) 1.0 × 10⁻⁸ mol L−1. (B) The linear relationship between fluorescence increase and the Hg2+ concentration. Conditions: CA-DNA = 1.0 × 10⁻⁷ mol L−1, CH-DNA = 1.2 × 10⁻⁷ mol L−1, Exo III = 50 U, CMB = 1.8 × 10⁻⁷ mol L−1.

The selectivity of the proposed strategy for Hg2+ detection was evaluated by investigating fluorescence increase of the system in Hg2+, other metal ions, including K+, Ba2+, Zn2+, Ni2+, Co2+, Pb2+, Cr3+ and Ag+, and the mixed. Fig. 4 presents the histograms of FF0 with other ions (5.0 × 10⁻⁷ mol L−1), Hg2+ (5.0 × 10⁻⁸ mol L−1) and the mixed. The system of Hg2+ exhibited a remarkable signal, whereas other metal ions system obtained lower fluorescence increase, indicating the strategy for Hg2+ detection exhibited excellent selectivity against other mental ions due to the specific formation of T–Hg2+–T. Furthermore, the signal of the mixed was comparable with the signal of only Hg2+. The results indicated the strategy had the potential for environmental water samples.


image file: c6ra14910c-f4.tif
Fig. 4 Fluorescence increase of the reaction systems in the presence of other mental ions, Hg2+ and the mixed. Conditions: CA-DNA = 1.0 × 10⁻⁷ mol L−1, CH-DNA = 1.2 × 10⁻⁷ mol L−1, Exo III = 50 U, CMB = 1.8 × 10⁻⁷ mol L−1.

3.5. Detection of Hg2+ in environmental water samples

The application of the proposed strategy for Hg2+ detection was tested by investigating the recoveries of Hg2+ in spiked tap water, lake water and river water samples. The spiked concentration met the detection standard of the US Environmental Protection Agency for the maximum allowable level of Hg2+ in drinking water (1.0 × 10⁻⁸ mol L−1). As shown in Table S2, the precision and recovery of the proposed strategy were satisfactory. Afterwards, the amount of Hg2+ in waste water was quantified by the dual amplification strategy and the results were listed in Table S2. To ensure the accuracy and reliability of the proposed strategy, the concentrations of Hg2+ in water samples were tested by the inductively coupled plasma mass spectroscopy (ICP-MS). The data demonstrated that there is no obvious difference between the data using the dual amplification strategy and ICP-MS method. The results confirmed that the proposed strategy could exactly quantify the content of Hg2+ and successfully applied to Hg2+ analysis in water samples.

4. Conclusions

In summary, a simple dual amplification fluorescent strategy was proposed for the selective and sensitive detection of Hg2+ based on target cycle and DNAzyme cycle. The T–T mismatches were introduced into the system to bind Hg2+ against other mental ions, realizing the high selectivity towards Hg2+. Through the effective combination of target cycle and DNAzyme cycle, the strategy showed high sensitivity for Hg2+ with a detection limit of 7.2 × 10⁻¹¹ mol L−1, which was better or comparable to the reported fluorescent amplification strategies for Hg2+ detection. Moreover, the strategy was successfully applied to measure the spiked Hg2+ in tap, lake and river water samples, and Hg2+ in waste water samples with excellent precision and accuracy, which are comparable to the ICP-MS method. The results indicated the proposed strategy provided a robust tool to quantify the Hg2+ for practical applications in environmental monitoring and biotoxicity analysis.

Acknowledgements

This work was supported by the National Natural Science Foundation of China (Grant No. 21375078, and 21475077).

Notes and references

  1. G. Aragay, J. Pons and A. Merkoci, Chem. Rev., 2011, 111, 3433–3458 CrossRef CAS PubMed.
  2. N. N. Bu, C. X. Tang, X. W. He and X. B. Yin, Chem. Commun., 2011, 47, 7689–7691 RSC.
  3. D. W. Huang, C. G. Niu, M. Ruan, X. Wang, G. M. Zeng and C. H. Deng, Environ. Sci. Technol., 2013, 47, 4392–4398 CrossRef CAS PubMed.
  4. G. C. Zhu and C. Y. Zhang, Analyst, 2014, 139, 6326–6342 RSC.
  5. R. Kunkel and S. E. Manahan, Anal. Chem., 1973, 45, 1465–1468 CrossRef CAS PubMed.
  6. C. F. Harrington, S. A. Merson and T. M. D. D'Silva, Anal. Chim. Acta, 2004, 505, 247–254 CrossRef CAS.
  7. P. Jitaru and F. C. Adams, J. Chromatogr. A, 2004, 1055, 197–207 CrossRef CAS PubMed.
  8. J. M. Powell, W. D. Boomer and R. J. McVicars, Anal. Chem., 1986, 58, 2864–2867 CrossRef.
  9. S. B. Han, M. Zhu, Z. B. Yuan and X. Li, Biosens. Bioelectron., 2001, 16, 9–16 CrossRef CAS PubMed.
  10. E. Coronado, R. J. Galan-Mascaros, C. Marti-Gastaldo, E. Palomares, R. J. Durrant, R. Vilar, M. Gratzel and K. M. Nazeeruddin, J. Am. Chem. Soc., 2005, 127, 12351–12356 CrossRef CAS PubMed.
  11. H. N. Kim, M. H. Lee, H. J. Kim, J. S. Kim and J. Yoon, Chem. Soc. Rev., 2008, 37, 1465–1472 RSC.
  12. K. T. Krawczyk, M. Moszczynska and M. Trojanowicz, Biosens. Bioelectron., 2000, 15, 681–691 CrossRef.
  13. J. Ma, Y. H. Chen, Z. Hou, W. Jiang and L. Wang, Biosens. Bioelectron., 2013, 43, 84–87 CrossRef CAS PubMed.
  14. Y. K. Yang, K. J. Yook and J. Tae, J. Am. Chem. Soc., 2005, 127, 16760–16761 CrossRef CAS PubMed.
  15. H. Zheng, Z. H. Qian, L. Xu, F. F. Yuan, L. D. Lan and J. G. Xu, Org. Lett., 2006, 8, 859–861 CrossRef CAS PubMed.
  16. A. Ono and H. Togashi, Angew. Chem., Int. Ed., 2004, 43, 4300–4302 CrossRef CAS PubMed.
  17. Y. Miyake, H. Togashi, M. Tashiro, H. Yamaguchi, S. Oda, M. Kudo, Y. Tanaka, Y. Kondo, R. Sawa, T. Fujimoto, T. Machinami and A. Ono, J. Am. Chem. Soc., 2006, 128, 2172–2173 CrossRef CAS PubMed.
  18. Y. Tanaka, S. Oda, H. Yamaguchi, Y. Kondo, C. Kojima and A. Ono, J. Am. Chem. Soc., 2007, 129, 244–245 CrossRef CAS PubMed.
  19. L. Deng, Z. X. Zhou, J. Li, T. Li and S. J. Dong, Chem. Commun., 2011, 47, 11065–11067 RSC.
  20. H. Wang, Y. X. Wang, J. Y. Jin and R. H. Yang, Anal. Chem., 2008, 80, 9021–9028 CrossRef CAS PubMed.
  21. Y. X. Wang, J. S. Li, J. Y. Jin, H. Wang, H. X. Tang, R. H. Yang and K. M. Wang, Anal. Chem., 2009, 81, 9703–9709 CrossRef CAS PubMed.
  22. M. Li, Q. Y. Wang, X. D. Shi, A. L. Hornak and N. Q. Wu, Anal. Chem., 2011, 83, 7061–7065 CrossRef CAS PubMed.
  23. J. Du, M. Y. Liu, X. H. Lou, T. Zhao, Z. Wang, Y. Xue, J. L. Zhao and X. Y. Xu, Anal. Chem., 2012, 84, 8060–8066 CrossRef CAS PubMed.
  24. Y. F. Zhang, Q. Yuan, T. Chen, X. B. Zhang, Y. Chen and W. H. Tan, Anal. Chem., 2012, 84, 1956–1962 CrossRef CAS PubMed.
  25. Q. B. Wang, W. Wang, J. P. Lei, N. Xu, F. L. Gao and H. X. Ju, Anal. Chem., 2013, 85, 12182–12188 CrossRef CAS PubMed.
  26. Y. L. Wei, W. J. Zhou, Y. Y. Xu, Y. Xiang, R. Yuan and Y. Q. Chai, RSC Adv., 2014, 4, 39082–39086 RSC.
  27. Y. L. Zhang, L. N. Tang, F. Yang, Z. Y. Sun and G. J. Zhang, Microchim. Acta, 2015, 182, 1535–1541 CrossRef CAS.
  28. Y. Zhou, X. J. Xing, D. W. Pang and H. W. Tang, RSC Adv., 2015, 5, 12994–12999 RSC.
  29. W. Ding, W. Deng, H. Zhu and H. Liang, Chem. Commun., 2013, 49, 9953–9955 RSC.
  30. F. Xuan, X. T. Luo and I. M. Hsing, Anal. Chem., 2013, 85, 4586–4593 CrossRef CAS PubMed.
  31. J. Zhu, L. Wang and W. Jiang, Chem. Commun., 2015, 51, 2903–2906 RSC.
  32. Y. Takezawa and M. Shionoya, Acc. Chem. Res., 2012, 45, 2066–2076 CrossRef CAS PubMed.

Footnote

Electronic supplementary information (ESI) available: DNA sequences and supporting figures. See DOI: 10.1039/c6ra14910c

This journal is © The Royal Society of Chemistry 2016
Click here to see how this site uses Cookies. View our privacy policy here.