
Facile synthesis of hierarchical pore foam catalysts with Brønsted–Lewis acid sites for the one-pot conversion of cellulose to 5-hydroxymethylfurfural†
Yating Shenab,
Yunlei Zhangab,
Enwei Zhuab,
Yao Chenc,
Pei Jina,
Meng Liua,
Yongsheng Yan*ab and
Chunxiang Li*ab
aInstitute of Green Chemistry and Chemical Technology, China. E-mail: yysxszyz@126.com; lcx@ujs.edu.cn; Fax: +86 511 88791800; Tel: +86 511 88791800
bSchool of Chemistry and Chemical Engineering, Jiangsu University, Zhenjiang, 212013, China
cSchool of the Environment and Safety Engineering, Jiangsu University, Zhenjiang 212013, China
First published on 11th August 2016
Abstract
Herein, hierarchical pore foam catalysts (HPFCs) containing Brønsted–Lewis acidic sites and with hierarchical porous properties were synthesized, and their catalytic performance was applied to convert cellulose into HMF through a one-pot reaction. Sulfated ZrO2 nanostructures (SZs) were synthesized through grafting ZrO2 onto the surface of mesoporous silica nanoparticles, and superacid was further introduced onto the surface of the ZrO2 shells through sulfuric acid treatment and calcination. The representative SZs firstly acted as stabilizers in the synthesis of oil-in-water (O/W) Pickering high internal phase emulsions (Pickering HIPEs). After a subsequent ion-exchange process, Brønsted acidic sites were located on the surface of HPFCs. The resulting HPFCs exhibit advantageous properties for catalysis, such as favorable meso–macro porosity, strongly acidic surfaces, and structural stability. Compared with other catalysts (e.g., one without superacid and mesopores (HPFCs-1) and another (HPFCs-2) without mesopores), HPFCs-3 manifested more efficiently (42%) the production of 5-hydroxymethylfurfural (HMF) from cellulose. This study develops a promising method for the fabrication of specific functional solid catalysts, which can be applied to the value-added conversion of abundant cellulose.
1. Introduction
With growing concerns regarding global warming and declining reserves of easily accessible fossil fuels, the production of renewable chemicals and fuels from renewable biomass has attracted worldwide interest for the purpose of nurturing sustainable societies and the next chapter of human civilization.1–5 Cellulose, a polymer composed of glucose units, is a most abundant and nonfood biomass resource, and a versatile precursor to biodegradable plastics and fuels.6,7 Among these chemicals, 5-hydroxymethylfurfural (HMF) plays a leading role in bio-based energy,8 because its derivatives hold vast potential. And these could eventually match the array of compounds derived from petroleum.9 Therefore, the efficient utilization of cellulose for the production of the key intermediate HMF is critical in biomass studies, for both fundamental science and industrial applications.Among the routes for converting cellulose into HMF, transformation via catalysis has been reported to be one of the most attractive chemical processing methods. In consideration of the multiple steps involved in the direct transformation of cellulose into HMF, which are shown in the Scheme 1, namely hydrolysis, isomerization, and finally dehydration to HMF,10 the catalyst plays a vital role in the catalytic conversion of cellulose to HMF, as reaction rates, product yields and selectivity are also highly dependent on the catalyst characteristics.11–15 Over the past few decades, many catalysts have been used in the production of HMF, such as mineral acids, amino acids, enzymes, boric and boronic acids, and metal ions.16–20 Qi et al. reported a two-step process for converting cellulose into HMF.21 Specifically, the cellulose was hydrolyzed into glucose, catalyzed by a strong acidic cation exchange resin in the first step, then CrCl3 was used to catalyze the hydrolysis products into 5-HMF after the resin was separated from the system. Although these homogeneous catalysts possess excellent performance, the separation of catalysts and product purification are major challenges. Recently, our team combined the heterogeneous catalysts HIPEs-Cr(III) and HIPEs-SO3H for the conversion of cellulose, glucose and fructose into HMF.22 This result verified the effect of Brønsted acidic sites on cellulose-to-glucose hydrolysis and fructose-to-HMF dehydration, and Lewis acidic sites optimized glucose-fructose conversion. Therefore, compared with multiple reactions, one-pot synthesis is an attractive methodology with respect to energy conservation and time-saving.23–27 To this end, intense research activity should focus on exploring efficient catalytic systems for the one-pot synthesis of HMF directly from renewable cellulose.
 | ||
| Scheme 1 The catalytic mechanism for converting cellulose into HMF. | ||
One strategy for integrating the multi-step conversion into a one-pot synthesis is employing catalysts possessing all the desired characters for each step, which will fulfill the sequential conversions involved in cellulose-to-HMF transformation. Correspondingly, solid superacid catalysts, containing Brønsted acidic sites and Lewis acidic sites, have attracted extensive attention in the field of catalysis for converting biomass into HMF. Since Hino et al. first authenticated the presence of superacidic properties on sulfate-modified ZrO2 surfaces,28 the syntheses of these types of materials have been intensely studied. For example, mesoporous catalysts were synthesized by grafting and sulfonating zirconia conformal monolayers onto SBA-15 by Osatiashtiani and co-workers, which exhibited both Brønsted and Lewis acidity in the conversion of glucose to HMF.29 Joo et al. also demonstrated the tailored synthesis of sulfated ZrO2 hollow nanostructures with the well-defined characteristics of a well-maintained hollow morphology, an active tetragonal crystalline phase, good dispersity in liquid media, well-developed mesoporosity and a strongly acidic surface, and enhanced catalytic activity for the dehydration of fructose to HMF.30 However, it was hard for large size cellulose to diffuse deep inside the mesoporous solid through the small pore diameters, hence limiting the accessibility of active sites and losing the merits of a high surface area.31–33 In addition, it was difficult to maintain the small particle morphology in the reaction process, and the separation of catalysts from the reaction mixture was also inconvenient. These shortcomings strongly hinder the practical application of mesoporous materials in the field of cellulose transformation.
Fortunately, hierarchically bimodal meso–macroporous materials can overcome these obstacles specifically for HMF production from cellulose due to interconnected porous structures with different length scales.34,35 Namely, the presence of macropores permits the mass and bulk transfer of substances, while the smaller pores create a large internal surface area that greatly enhances the catalytic activity36. Li and co-workers successfully synthesized a series of meso–macroporous polymeric catalysts, which contained macropores and interconnecting throats, while interfacially adsorbed microgel stabilizers drove the formation of smaller pores throughout the macroporous walls after drying and sintering.37 Currently, emulsion templating as a method for preparing such hierarchical porous polymeric catalysts is popular because it offers a route to synthesizing polymer foams with controllable pore morphology and physical properties.38–40 In our previous work, catalysts with hierarchical porous structures and bi-functional sites were synthetized through a water-in-oil (W/O) high internal phase emulsion (HIPE) template with bifunctionalized mesoporous silica nanoparticles, then served in the highly efficient synthesis of value-added HMF from renewable cellulose.41 Notably, the innovation of neoteric methods for the fabrication of catalysts with hierarchically macro–mesoporous structures will be beneficial for increasing the HMF yield from cellulose through a one-pot reaction. Therefore, multi-catalysts with hierarchical porous structures and Brønsted–Lewis acids cannot fail to enhance significantly reaction rates, product yields, and selectivity. Nevertheless, there are few reports about such multifunctional polymeric solid catalysts for now, and studying the composition of these catalysts remains severe, tough and challenging.
Herein, sulfated ZrO2 nanostructures (SZs) were synthesized and played a crucial role in the manufacture of hierarchical pore foam catalysts (HPFCs), which were catalytically applied in the conversion of cellulose to HMF. ZrO2@SiO2 core–shells were synthesized by smudging a zirconium propoxide (ZrPr) layer on the charged surface of silicon sphere templates using the surface hydroxyl groups. After introducing sulfate functional groups onto the surface of ZrO2@SiO2 through immersing in a sufficient sulfuric acid solution and finally calcination, the SZs were generated. More specifically, the as-prepared SZs were first applied to stabilize O/W Pickering HIPEs. Definitively, through polymeric treatment and a subsequent ion-exchange process in a sulfuric acid solution, HPFC catalysts were produced. Different kinds of silicon spheres were used in this work to explore the influence of mesoporosity on the conversion of cellulose into HMF.
2. Experimental section
2.1 Materials and reagents
Tetraethyl orthosilicate (TEOS), cetyltrimethylammonium bromide (C16TBA), ammonium fluoride (NH4F), ammonium hydroxide (NH3·H2O), carboxymethylated cellulose (CMC), zirconium propoxide (ZrPr), ethanol, pure HMF, 1-butyl-3-methyl-imidazolium chloride ([BMIM]-Cl, >99%), cellulose, Tween 85, sulfuric acid (98%), hydrochloric acid (HCl), liquid paraffin, sodium p-styrene sulfonate (SS), acrylamide (AM), N,N-methylene-bis-acrylamide (MBA), potassium persulfate (K2S2O8), acetone, EDTA and xylenol orange were purchased from Aladdin reagent Co., Ltd (Shanghai, China). HPLC-grade methanol was purchased from Sinopharm Chemical Reagent Co, Ltd. (Shanghai, China). All other chemicals were purchased from local suppliers and used without further purification.2.2 Preparation of SZs
SZs were synthesized via three steps using a slightly modified method, as shown in Scheme 2. Firstly, C16TAB (0.455 g) and NH4F (0.75 g) were dissolved in 125 mL of deionized water in a 250 mL three-neck, round-bottom flask sufficiently after ultrasonication for 15 minutes. Soon afterwards, the homogeneous solution was heated in a water bath kettle to reach the desired temperature (80 °C), accompanied with mechanical stirring. Then, 2.25 mL of TEOS was dropped into the aforementioned solution under continuous stirring for 2 h. Mesoporous silica nanoparticles (meso-SiO2) were obtained from dispersion and differential centrifugation, washed with ethanol and 37.5% HCl three times and dried in a vacuum drying oven for 12 h. | ||
| Scheme 2 The synthesis of SZs. | ||
Secondly, nonporous silicon nanoparticles (non-SiO2) were synthesized using the following method. 6 mL of TEOS was dissolved in the homogeneous solution of 90 mL of ethanol and 10 mL of deionized water, then 3.14 mL of 25 wt% NH3·H2O was added into the uniform mixture under continuous magnetic stirring for 1 h. The products were collected, washed several times with ethanol solely and dried in a vacuum drying oven for 12 h.
Eventually, 0.1 g of silicon material (meso-SiO2 or non-SiO2) was soaked and dissolved in 5 mL of ethanol, and mixed with a solution composed of 10 mg of CMC, 20 mL of ethanol and 0.1 mL of deionized water. After stirring for 30 min, the desired amount of ZrPr (1.0 mL) in ethanol (4.5 mL) was injected with a syringe at a rate of 0.25 mL min−1, and the mixture was stirred at 600 rpm for 20 h at room temperature. The precipitate was isolated using centrifugation and washed with ethanol. Afterwards, the as-prepared ZrO2@SiO2 core–shell particles (typically 0.2 g) were dispersed in an aqueous solution of H2SO4 (0.1 mol L−1, 5 mL) and stirred for 1 h. The resulting samples were isolated using centrifugation, washed with deionized water and ethanol, and dried under vacuum. The dried ZrO2@SiO2 samples were calcined at the desired temperature for 2 h in air to obtain the sulfated zirconia samples (meso-SZs or non-SZs).
2.3 Fabrication of HPFCs
The HPFCs were synthesized through the following procedures, as shown in Scheme 3. Firstly, the as-prepared SZs (0.3 g), SS (1.2 g), AM (0.41 g), K2S2O8 (0.043 g), MBA (0.31 g), and Tween 85 (0.08 g) were dissolved in distilled water (5.0 mL) in a 100 mL three-neck flask and ultrasonicated for 15 min for homogenization purposes. Secondly, 22.67 mL of the internal oleic phase (liquid petrolin) was gradually dripped into the aqueous phase under continuous stirring. Then, the obtained O/W Pickering HIPE was dumped into a vitreous ampoule and polymerized in a water bath at 60 °C. After 12 h, the polymerized Pickering HIPE was washed extensively with acetone with a Soxhlet extractor, then dried at 80 °C for 12 h in a vacuum oven.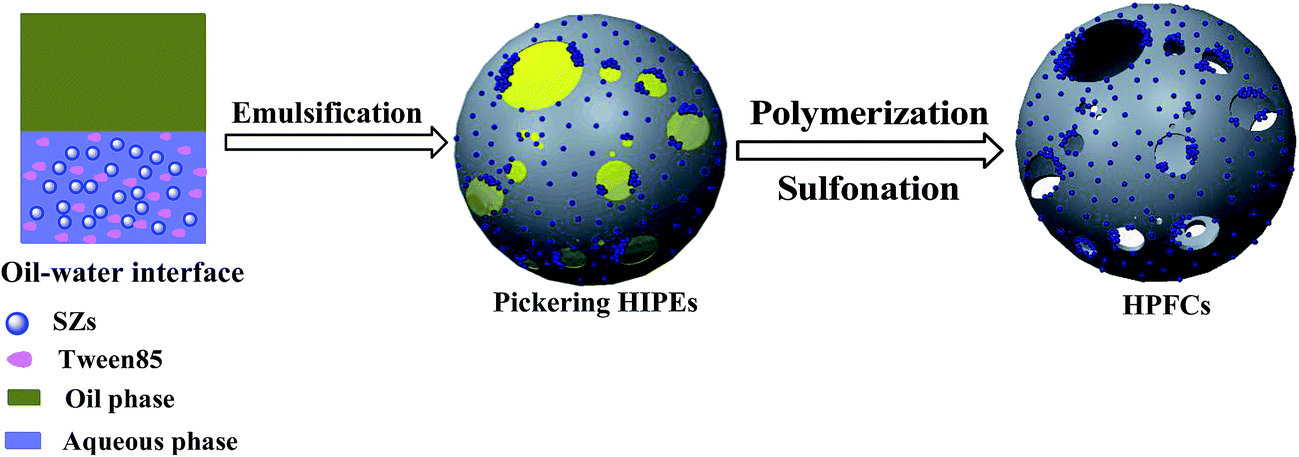 | ||
| Scheme 3 The synthesis of HPFCs and the conversion of cellulose into HMF. | ||
In order to obtain Brønsted acidic sites, the poly(Pickering HIPE) was further ion-exchanged in a sulfuric acid solution. The poly(Pickering HIPE) (0.5 g) was dispersed into 50 mL of 1.0 mol L−1 sulfuric acid solution. After stirring for 24 h at room temperature, the sample was washed with a large amount of deionized water until the filtrate was neutral, and dried at 80 °C for 24 h in a vacuum drying oven.
2.4 Catalytic testing
Due to the rigid chemical structure, insolubility in many conventional solvents and difficulties in the depolymerization of cellulose,42 ionic liquid [BMIM]-Cl was employed as the most ideal green solvent for transforming cellulose, owing to it being nonvolatile, nonflammable, highly polar, and easy to separate from reactants and products43. Firstly, cellulose (0.1 g) and [BMIM]-Cl (2.0 g) were mixed in a 25 mL graduated Pyrex glass tube and preheated at a designed temperature for 30 min under digital magnetic stirring in an oil bath to create a homogeneous system. In the reaction step, the catalyst was added into the mixture while maintaining heating and stirring at 1200 rpm under the optimized conditions. All the reaction steps were repeated three times and the average yields of HMF were calculated.Next, the reaction products were diluted to a metered volume with deionized water in a 100 mL volumetric lucifugal flask. Finally, liquid samples were diluted 50 times with deionized water, and analyzed using a 1200 Agilent HPLC equipped with an Agilent TCC18(2) column (4.6 × 250 mm, 5.0 μm) and a UV detector at 283 nm. The mobile phase was mixed water and methanol with a volume ratio of 3![[thin space (1/6-em)]](https://www.rsc.org/images/entities/char_2009.gif) :7, meanwhile the flow rate and column oven were set to 0.7 mL min−1 and 25 °C, respectively. The percentage of HMF was obtained according to the standard curve method and the standard curve is shown in Fig. S1.†
:7, meanwhile the flow rate and column oven were set to 0.7 mL min−1 and 25 °C, respectively. The percentage of HMF was obtained according to the standard curve method and the standard curve is shown in Fig. S1.†
The yield of HMF (mol%) was evaluated on a carbon basis, calculated using eqn (1):
 | (1) |
2.5 Characterization of the catalysts
The morphology of the SZs and HPFCs was analyzed via field emission scanning electron microscopy (SEM, JSM-7100F), which was carried out with an electron microscope equipped with a field emission electron gun and energy dispersive spectrometer (EDS). Infrared spectra were recorded on a Nicolet NEXUS-470 FTIR apparatus (U.S.A.), and were obtained using the KBr (1:100) pressed pellet method with a Bruker VERTEX 70 Fourier transform infrared spectrometer. X-ray photoelectron spectroscopy (XPS) spectra were recorded using a vario ELIII elemental analyzer (Elementar, Hanau, Germany), and the spectroscopy was performed on a Thermo ESCALAB 250 with Al Kα radiation at y = 901 for the X-ray source, with the binding energies calibrated using the C 1s peak at 284.9 eV. The acidic features of the samples were measured according to NH3 temperature-programmed desorption (NH3-TPD) curves, which were recorded using a thermal conductivity detector (TCD, DAS-7000SERIES, Beijing, China) and the heating range was 40–800 °C under a helium flow at a rate of 10 °C min−1 for NH3 desorption. X-ray diffraction (XRD) tests were conducted on a Bruker D8 diffractometer, using a wavelength of 1.5418 Å (Cu Kα, λ = 1.5418 Å) and an angle of 5–80 °C at 7 °C min−1. Thermogravimetric analysis (TGA) was performed with a Netzsch simultaneous thermal analyzer STA 449C (crucibles: aluminum, from Netzsch) under a nitrogen atmosphere and a heating rate of 10 °C min−1 from 30 °C to 800 °C. The Brunauer–Emmett–Teller (BET) specific surface areas, total pore volumes, and average pore widths of the catalysts were determined from the N2 adsorption and desorption isotherms, using a Micromeritics TriStar II 3020 instrument. Prior to characterization, the samples were degassed under a N2 stream for 12.0 h. The specific surface areas of the samples were calculated by applying BET theory to the nitrogen-adsorption data within the P/P0 range. Pore-size distributions were calculated from the desorption branch of the corresponding nitrogen isotherms, using the Barrett–Joyner–Halenda (BJH) method.
3. Results and discussion
3.1 Morphology of the samples
With the introduction of sulfate ions onto the surface of ZrO2@SiO2, sulfated nanostructures containing strongly acidic surfaces can be prepared. And, corresponding TEM images are exhibited in Fig. 1. Clearly, the average diameter of non-ZrO2@SiO2 (Fig. 1b) is 133 ± 5 nm, which is thicker than non-SiO2 (128 ± 5 nm), shown in Fig. 1a. This result was mainly ascribed to the successful coverage of ZrPr through the sol–gel method with CMC. Likewise, the size of meso-SiO2 (125 ± 5 nm) increased to 137 ± 5 nm after grafting with ZrO2. However, there was just a small increase for non-/meso-ZrO2@SiO2 after the sulfonation and calcination processes, as presented in Fig. 1c and f. This is due to some organics, which came from the raw materials and attached to the silica surface, being oxidized during the high-temperature calcination in air. Noteworthily, mesopores of silica were not blocked during the complex processes (Fig. 1e and f), and the mesopores ensure that the catalysts possess hierarchical pores. | ||
| Fig. 1 TEM images of non-SiO2 (a), non-ZrO2@SiO2 (b), non-SZs (c), meso-SiO2 (d), meso-ZrO2@SiO2 (e), and meso-SZs (f). | ||
Nowadays, Pickering HIPEs are stabilized by solid colloidal particles that irreversibly adsorb at the interface, and synthetic particles including modified silica particles,44–46 titania particles47 and zinc(II) oxide nanoparticles.48 In this study, catalysts with controllable physical and chemical properties were synthesised by polymerizing O/W Pickering HIPEs, which were stabilized by a low polymeric surfactant (2.0 wt%, Tween 85) and moderate SZs. Here, catalysts were synthesised with free-particles, non-SZs and meso-SZs, and named HPFCs-1, HPFCs-2 and HPFCs-3, respectively. SEM images of HPFCs-1 (A, a), HPFCs-2 (B, b) and HPFCs-3 (C, c) are presented in Fig. 2. Obviously, all the catalysts contain macropores with well-defined, open-cell and interconnecting pore throat structures, but different sizes. For HPFCs-1, the shells ranged from 9 μm to 21 μm and the size of the interconnecting pores was 2–5 μm. Dramatically, there are larger shells and smaller interconnecting pores in HPFCs-2 (0.5–3 μm, 12–27 μm) and HPFCs-3 (0.5–3 μm, 13–26 μm). These results are attributed to the larger droplet size of the emulsions stabilized by particles and surfactant than by surfactant solely, which stabilized the emulsions mechanically against the coalescing power of the particles surrounding the droplets during polymerization.49 Moreover, SZs with high energy were absorbed at the water–oil interface and hindered the formation of interconnecting pores during polymerization, or superfluous particles buried the accomplished connection holes.50 Clearly, the existence of a mass of SZs at the edge of the interconnecting pores, as exhibited in Fig. 2b and c, further proves the above theory. Notably, a large number of silica spheres in HPFCs-2 and HPFCs-3 also confirmed effectively the successful introduction of SZs.
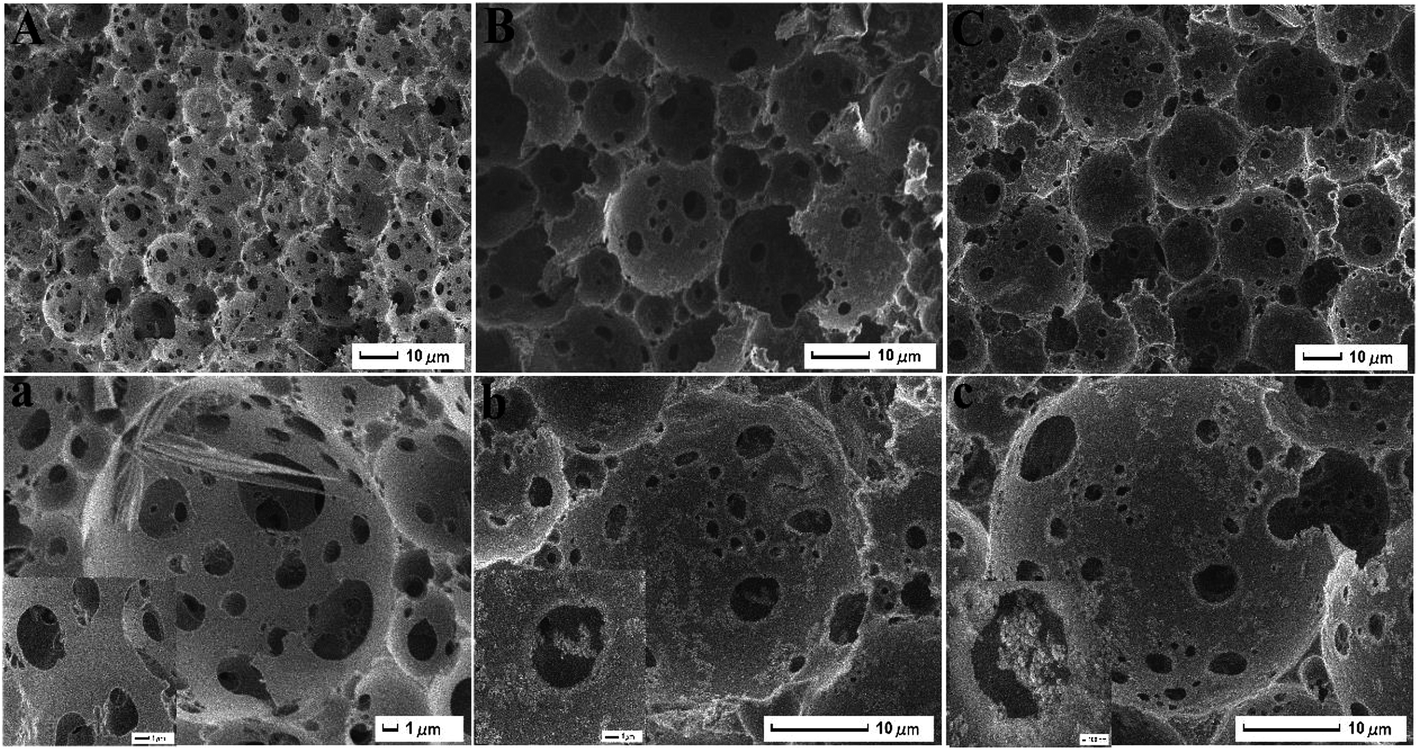 | ||
| Fig. 2 SEM images of HPFCs-1 (A, a), HPFCs-2 (B, b) and HPFCs-3 (C, c). | ||
The nitrogen adsorption–desorption isotherms and size distribution curves of meso-SiO2 (a), meso-ZrO2@SiO2 (b), meso-SZs (c), HPFCs-1 (d), HPFCs-2 (e) and HPFCs-3 (f) are shown in Fig. 3. Typical type-IV isotherms with step capillary condensation over the relative pressure range of 0.1–1.0 were obtained for all samples. The porous parameters of meso-SiO2, meso-ZrO2@SiO2, meso-SZs, HPFCs-1, HPFCs-2 and HPFCs-3 are listed in Table 1. The BET surface area (192.7.6 m2 g−1), BJH pore radius (3.9 nm) and pore volume (0.23 cm3 g−1) of meso-SiO2 were obviously higher than those for meso-ZrO2@SiO2 (143.5 m2 g−1, 2.3 nm, 0.17 cm3 g−1) and meso-SZs (144.3 m2 g−1, 2.8 nm, 0.15 cm3 g−1). These results were mainly attributed to the introduction of ZrO2, which blocked the mesopores of meso-SiO2, thereby resulting in smaller pores in meso-ZrO2@SiO2 and meso-SZs. Meanwhile, the BET surface area (109.7 m2 g−1) and pore volume (0.06 cm3 g−1) of HPFCs-3 were obviously higher than HPFCs-2 (97.6 m2 g−1, 0.05 cm3 g−1) and HPFCs-1 (45.5 m2 g−1, 0.03 cm3 g−1). This is attributed to the introduction of SZs which stacked at the edge of the macropores of HPFCs-3 and HPFCs-2, resulting in smaller pores and higher BET surface areas. And, the BJH pore radius was only detected in HPFCs-3 (19.8 nm). In short, the typical hierarchical porous structure of the polymer foams was confirmed from SEM and nitrogen adsorption–desorption isotherm analyses of HPFCs-3. Thus, the as-prepared HPFCs-3 catalyst, which possesses a hierarchically macro–mesoporous structure, was suitable for the conversion of cellulose to HMF, where the interconnected macropores would allow ready mass transfer, and the mesopores along the macroporous walls might have a specific large surface area and greatly enhance the catalytic activity.
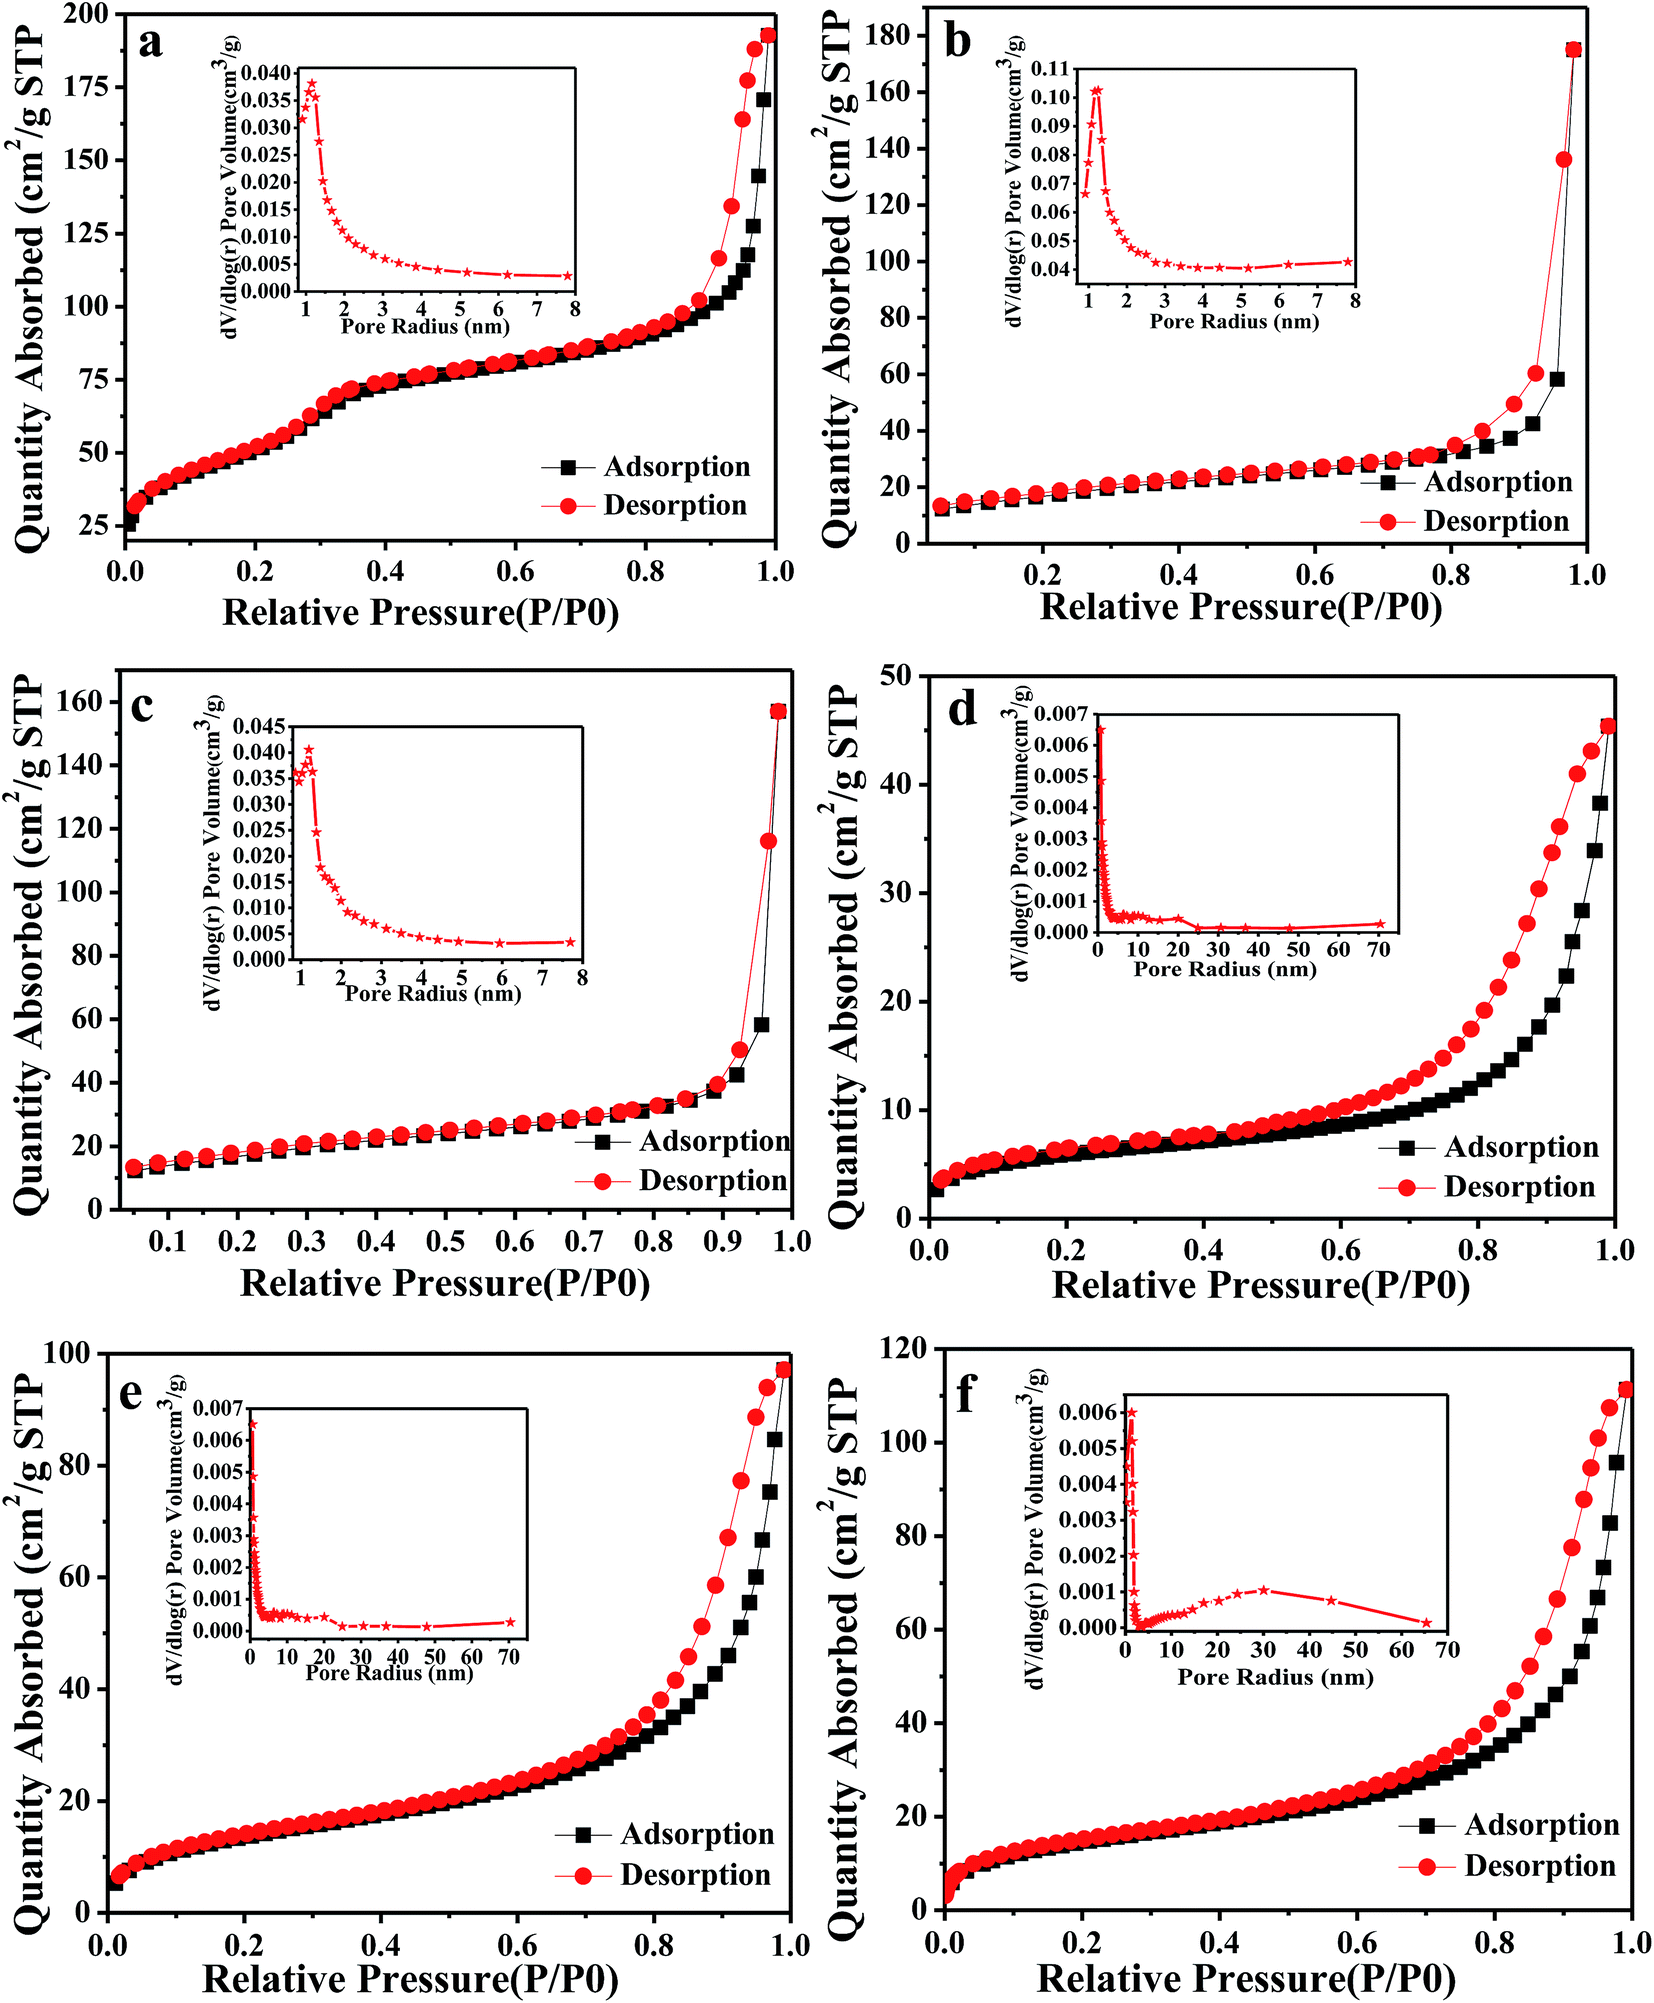 | ||
| Fig. 3 Nitrogen adsorption–desorption isotherms of meso-SiO2 (a) (inset: pore distribution), meso-ZrO2@SiO2 (b) (inset: pore distribution), meso-SZs (c) (inset: pore distribution), HPFCs-1 (d) (inset: pore distribution), HPFCs-2 (e) (inset: pore distribution), and HPFCs-3 (f) (inset: pore distribution). | ||
| Sample | SBETa (m2 g−1) | RBJHb (nm) | Vtc (cm3 g−1) |
|---|---|---|---|
| a SBET is the BET specific surface area.b RBJH is the BJH mean pore radius calculated from the desorption branches of the nitrogen sorption isotherms.c Vt is the total pore volume determined at a relative pressure of 0.99. | |||
| meso-SiO2 | 192.7 | 3.9 | 0.23 |
| meso-ZrO2@SiO2 | 143.5 | 2.3 | 0.17 |
| meso-SZs | 144.3 | 2.8 | 0.13 |
| HPFCs-1 | 45.5 | — | 0.03 |
| HPFCs-2 | 97.6 | — | 0.05 |
| HPFCs-3 | 109.7 | 19.8 | 0.06 |
3.2 Physical and chemical properties of the catalysts
The elemental compositions of the catalysts were measured using an elemental analyzer and are presented in Fig. 4d. The element N in HPFCs-1 (4.8%), HPFCs-2 (4.7%) and HPFCs-3 (5.0%) came from the monomer AM and the crosslinker MBA. The slight difference may be caused by a failure in consistent distribution in the catalysts. For HPFCs-1, the contained S (6.1%) was only represented by –SO3H groups on the surface, which originated from the other monomer, SS. And HPFCs-2 and HPFCs-3 displayed greater percentages of S: 7.3% and 7.7%, respectively. This result is mainly caused by the inserted stable particles of SZs, which contained a mass of elemental sulphur. A comprehensive qualitative detection of the elemental compositions of the HPFCs and SZs was conducted using EDS, and the results are shown in Fig. 4 and Fig. S2.† Clearly, the existence of the elements Zr and S (Fig. S2†) proved definitely the successful grafting of sulfated ZrO2 onto the surface of the silica spheres. By reading the EDS spectra of HPFCs-1 (a), HPFCs-2 (b) and HPFCs-3 (c), the elements C, O, Na, and S were discovered, which all came from the monomers of the O/W Pickering HIPEs. Moreover, the elements Zr and Si were only detected in HPFCs-2 and HPFCs-3, suggesting that the SZs have been successfully incorporated onto the structure of the catalysts. | ||
| Fig. 4 EDS images of HPFCs-1 (a), HPFCs-2 (b) and HPFCs-3 (c) and the element content of the catalysts (d). | ||
The relevant groups in the HPFCs (a) and SZs (b) were detected using FT-IR spectrometry and the corresponding FT-IR spectra are shown in Fig. 5. Clearly, the SZs display absorption peaks in the range of 400–500 cm−1, which are assigned to Zr–O stretching.52 And the characteristic peaks at 797.98 cm−1 for meso-SZs and 818.06 cm−1 for non-SZs are assigned to bidentate SO42− ions coordinated to ZrO2, indicating a strongly superacidic surface. Bands at about 1103 cm−1 for meso-SZs and 1120 cm−1 for non-SZs also appear, which may be attributed to Si–O stretching. Although the SZs were produced with high temperature resistance, the representative peaks still can be observed, reflecting the stability of the surface sulfate groups. The above peaks all appeared in the spectra of HPFCs-2 and HPFCs-3 but not HPFCs-1, indicating the successful grafting of SZs. The band at about 3200 cm−1 is assigned to O–H stretching vibrations in –COOH and phenolic –OH groups generated in the process of sulfonation. Additionally, the peak at around 1700 cm−1 for the catalysts is from asymmetric stretching vibrations of the radical group –C![[double bond, length as m-dash]](https://www.rsc.org/images/entities/char_e001.gif) O, which was derived from the polymerized monomer acrylamide and cross-linking agent methylene-bisacrylamide. The peaks at around 1030 cm−1 are attributed to C–S bonds, peaks around 1160 cm−1 belong to –SO3H groups, the peak at about 2900 cm−1 is assigned to C–H bonds, and the peak at about 1415 cm−1 is characteristic of C–N bonds, all of which were observed in the HPFCs.
O, which was derived from the polymerized monomer acrylamide and cross-linking agent methylene-bisacrylamide. The peaks at around 1030 cm−1 are attributed to C–S bonds, peaks around 1160 cm−1 belong to –SO3H groups, the peak at about 2900 cm−1 is assigned to C–H bonds, and the peak at about 1415 cm−1 is characteristic of C–N bonds, all of which were observed in the HPFCs.
 | ||
| Fig. 5 FT-IR spectra of the HPFCs (a) and SZs (b). | ||
Fig. 6 shows the XRD data for the HPFCs and SZs. Clearly, peaks were observed for the SZs (Fig. 5b) of tetragonal phase at 2θ = 30.2, 50.3, and 60.5, and at 2θ = 30.1, 50.3, and 60.1, which can be attributed to the (111), (210), and (220) planes, respectively. These results further demonstrate the successful grafting of sulfated ZrO2 onto the surface of silicic materials from the pretreatment with ZrPr and CMC, following with calcination at high temperature. Peaks could not be found in the spectrum of HPFCs-1 (Fig. 5a), on the reasonable grounds that no stable particles were present in the process of preparation. However, the peaks observed in the spectrum of HPFCs-2 (Fig. 5a) of tetragonal phase at 2θ = 30.0 and 50.5, are slightly different to the SZs, indicating a few changes in the relevant parameters of ZrO2 during the process of synthesis, emulsion and the following polymerization. Moreover, these peaks also discovered in Fig. 5a for HPFCs-3, of tetragonal phase at 2θ = 30.0 and 50.3.
 | ||
| Fig. 6 XRD patterns of the HPFCs (a) and SZs (b). | ||
Fig. 7 shows the XPS data for the HPFCs. Signals from S 2s, S 2p, C 1s, and O 1s can be observed in HPFCs-1, HPFCs-2 and HPFCs-3. Correspondingly, highly resolved peaks of C 1s are shown at 284.8 eV for HPFCs-1, 284.7 eV for HPFCs-2, and 284.9 eV for HPFCs-3, associated with the existence of C–S bonds in all of the prepared catalysts. Signals from S 2p at around 167.5 eV, 167.3 eV and 167.9 eV for HPFCs-1, HPFCs-2 and HPFCs-3, respectively, confirm the attendance of the group –SO3H, consistent with the above FTIR tests and the existence of Brønsted acidity in these catalysts. Moreover, peaks for Si 2p and Zr 3d appear in HPFCs-2 and HPFCs-3 but not HPFCs-1, indicating SZs were grafted into the polymer frameworks. As shown in Fig. 7, two peaks located at 175.9 eV for HPFCs-2 and 175.7 eV for HPFCs-3 for Zr 3d correspond to O–Zr–O and Zr–O–Zr species, indicating the successful grafting of Lewis acids onto the catalysts. It is worth mentioning that the Zr 3d peak for HPFCs-3, shown in Fig. 7d, is stronger than the same kind of peak for HPFCs-2. The anticipated difference is possibly because more ZrO2 was introduced to meso-SiO2 when compared with non-SiO2. Undoubtedly, a large number of mesopores are not only favorable for more efficient loading of ZrO2, but also stimulating for an increase in the specific surface area of the catalysts. Overall, these results confirm that carbonaceous catalysts contain Brønsted acids and Lewis acids, which are beneficial for enhancing the catalytic performance in the production of HMF from cellulose.
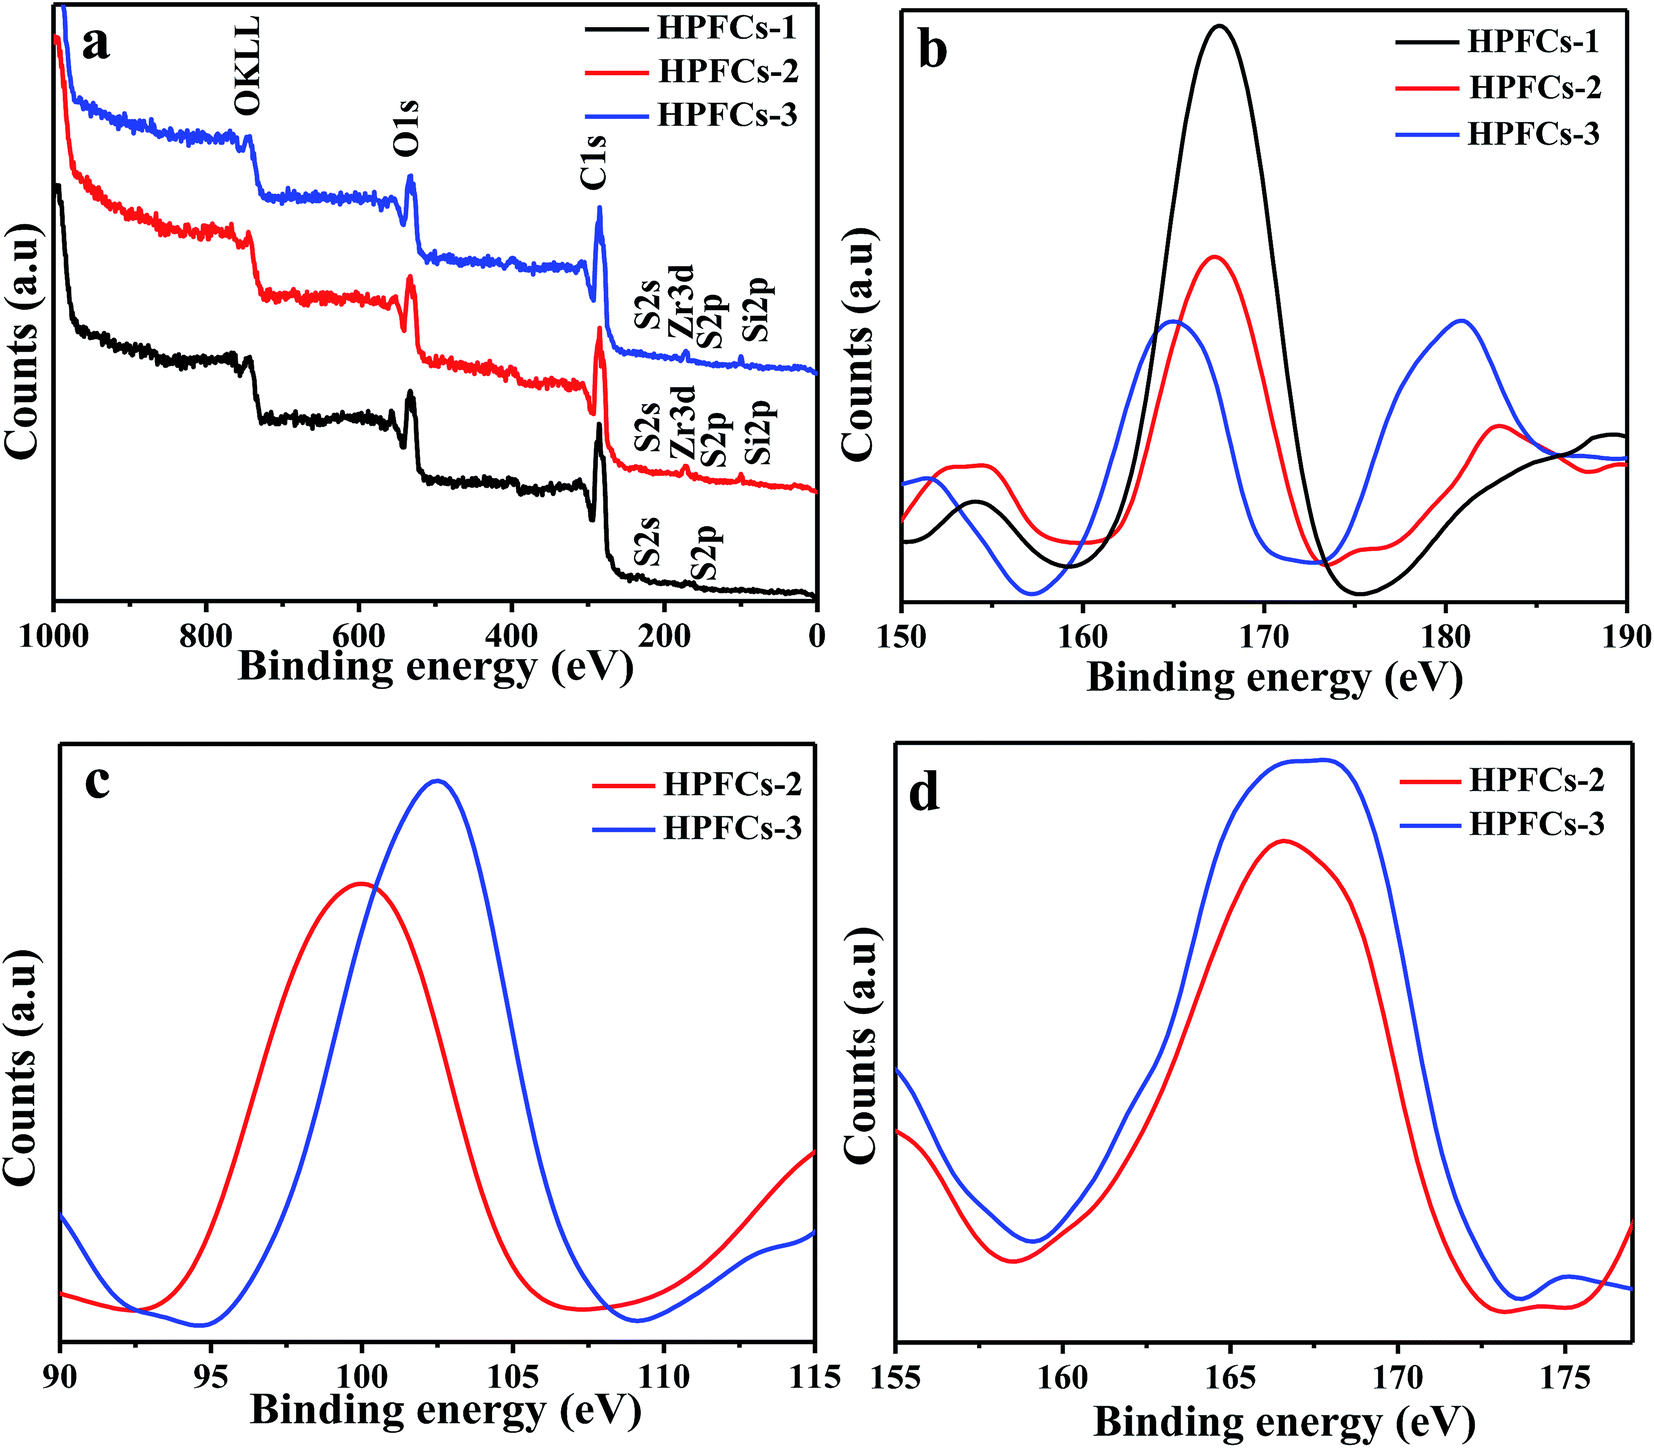 | ||
| Fig. 7 XPS measurements (a) of HPFCs, S 2p spectra (b) of HPFCs, Si 2p spectra (c) of HPFCs-2 and HPFCs-3, and Zr 3d spectra (d) of HPFCs-2 and HPFCs-3. | ||
More immediate characterization and quantification of the total acid density of HPFCs-1, HPFCs-2 and HPFCs-3 were performed using NH3-TPD methods, and the results, providing reliable data, are shown in Fig. 8. Moreover, the areas of the peaks represent the amounts of acidic sites, which were further calculated and are summarized in Table 2. It is worth mentioning that the different kinds of acidic sites are based on the adsorptive temperatures of NH3, and 150–250 °C, 250–500 °C and >500 °C were designated as weak, medium, and strong acids, respectively.32 Meanwhile, the amounts of acids were from rough calculations of the integral areas of peaks. Obviously, the total amounts of acids were closely related to the content of 1.726 mmol g−1 (the superposition of 0.362 mmol g−1 at 110 °C, 0.503 mmol g−1 at 317 °C, 0.227 mmol g−1 at 449 °C, and 0.634 mmol g−1 at 700 °C) for HPFCs-1, 2.405 mmol g−1 (the superposition of 0.662 mmol g−1 at 168 °C, 0.765 mmol g−1 at 301 °C, and 0.878 mmol g−1 at 713 °C) for HPFCs-2, and 2.677 mmol g−1 (the superposition of 0.887 mmol g−1 at 165 °C, 0.893 mmol g−1 at 301 °C, and 0.897 mmol g−1 at 715 °C) for HPFCs-3. Undoubtedly, the acid strength shows a tremendous increase after employing SZs particles as the stabilizer for the O/W Pickering HIPEs. The increase in the acid amount has an important effect on the conversion of cellulose into HMF. Furthermore, the peaks for strong acid in HPFCs-2 and HPFCs-3 appear at higher temperature than in HPFCs-1, which is probably because of stronger acidic sites from the stable particles of SZs, partly. Although the same weight of SZs was employed in HPFCs-3 and HPFCs-2, the slight augmentation of acidic amounts emerged due to the greater surface area in meso-SiO2 than in non-SiO2. Thus, the strong acid properties of the catalysts can be easily obtained by controlling the stabilizer, thereby offering a simple method for adjusting the strong acid strength of polymeric catalysts.
 | ||
| Fig. 8 NH3-TPD curves of HPFCs-1 (a), HPFCs-2 (b), and HPFCs-3 (c). | ||
| Sample | Acid strength (°C) | Acid amount (mmol g−1) | Total acidity (mmol g−1) |
|---|---|---|---|
| HPFCs-1 | 110 | 0.362 | 1.726 |
| 317 | 0.503 | ||
| 449 | 0.227 | ||
| 700 | 0.634 | ||
| HPFCs-2 | 168 | 0.602 | 2.405 |
| 301 | 0.765 | ||
| 713 | 0.878 | ||
| HPFCs-3 | 165 | 0.887 | 2.677 |
| 301 | 0.893 | ||
| 715 | 0.897 |
Finally, TG analysis of HPFCs-1 (a), HPFCs-2 (b) and HPFCs-3 (c) was performed and the data are shown in Fig. 9. As we all know, the TG spectra show mass loss steps at different temperatures, and the following DSC curves indicate endothermic or exothermic reactions which are revealed from the temperatures of the peaks. The headmost mass loss of HPFCs-1 (22.85%), HPFCs-2 (15.07%) and HPFCs-3 (14.59%) happened in the region of 25 °C to 250 °C, associated with the loss of absorbed water. Simultaneously, the endothermic peak of HPFCs-1 (71.3 °C) was higher than HPFCs-2 (66.4 °C) and HPFCs-3 (64.7 °C) in the respective DSC curves because more water was captured by HPFCs-1, indicating the successful introduction of SZs in HPFCs-2 and HPFCs-3. With the temperature rising to 800 °C, the major mass loss of HPFCs-1 (42.69%), HPFCs-2 (39.67%) and HPFCs-3 (42.84%) emerged between 450 °C and 500 °C. And, the DSC curves revealed the endothermic peaks of HPFCs-1 (332.7 °C), HPFCs-2 (353.0 °C) and HPFCs-3 (352.7 °C, 442.1 °C). The significant weight loss and large endothermic peaks resulted from the pyrolysis of organic matter and decomposition of –SO3H groups. Notably, the remaining masses of HPFCs-2 (45.57%) and HPFCs-3 (42.57%) were greater than in HPFCs-1 (34.46%) at 800 °C, which may be residual from the heat processed stable SZs, besides the carbon generated from the calcination of the polymers. Overall, it was found that HPFCs-1, HPFCs-2 and HPFCs-3 possess high enough thermal stability for moderate conversion.
 | ||
| Fig. 9 TG–DSC curves of HPFCs-1 (a), HPFCs-2 (b), and HPFCs-3 (c). | ||
3.3 Catalytic performance
In order to investigate the effectiveness of the different catalyst integrated pore structures and acidic strengths on the production of HMF from cellulose, HPFCs-1, HPFCs-2 and HPFCs-3 acted as catalysts respectively. The influence of catalyst loading on the HMF yield was first studied. 30 to 80 mg of catalyst was added to the reactive system under the same conditions as summarized in Fig. 10a. Maximum yields of 22.6%, 39.1% and 42.0% were obtained at a loading of 70 mg of HPFCs-1, 70 mg of HPFCs-2, and 60 mg of HPFCs-3. Obviously, increasing catalyst loading induced a gradual increase in HMF yield before the optimum dosage. Then, a superabundant amount of catalyst aroused a reduction in the HMF yield, facilitating decomposition side reactions or the polymerization of HMF.15 Among these catalysts, HPFCs-3 revealed the best catalytic performance, followed by HPFCs-2 and HPFCs-1. And HPFCs-2 displayed a much greater effectiveness than HPFCs-1 in the significant conversion. These results may be attributed to the existence of SZs and Lewis acidic sites in HPFCs-2, and the additive mesopores in HPFCs-3 (ref. 32 and 33). | ||
| Fig. 10 (a) Influence of the loading amount of HPFCs-1, HPFCs-2, and HPFCs-3 on the yield from cellulose in the ionic liquid [BMIM]-Cl, with the other reaction parameters remaining constant: cellulose = 100 mg, T = 120 °C, t = 50 min. (b) Effects of reaction temperature and time on the conversion of cellulose to HMF with the following reaction conditions: 70 mg of HPFCs-1, 100 mg of cellulose and 2.0 g of [BMIM]-Cl. (c) Effects of reaction temperature and time on the conversion of cellulose to HMF with the following reaction conditions: 70 mg of HPFCs-2, 100 mg of cellulose and 2.0 g of [BMIM]-Cl. (d) Effects of reaction temperature and time on the conversion of cellulose to HMF with the following reaction conditions: 60 mg of HPFCs-3, 100 mg of cellulose and 2.0 g of [BMIM]-Cl. | ||
Then, under the respective optimized catalyst loadings, the effects of reaction temperature and time were evaluated on the conversion of cellulose into HMF, and the results are shown in Fig. 10b–d. It is not difficult to observe the common rules for the catalysts HPFCs-1 and HPFCs-2 and HPFCs-3 in conversion. Firstly, the HMF yield increases rapidly along with the accompanying reaction time during the initial period, then decreases with the follow-up progression of the reaction time beyond the optimum. This is possibly because the movement of solvent closer to the substrate molecules becomes an energetically spontaneous process when lengthening the reaction time.51 Then, the major side-reaction, the acid-catalyzed hydration of HMF to levulinic acid and formic acid, augments with the duration of catalysis. Secondly, HMF yield shows a positive correlation with the reaction temperature at the beginning, then a negative correlation appears because of excessively high temperature. This phenomenon can be ascribed to the reduced viscosity of the ionic liquid when enhancing the reaction temperature, thereby increasing the catalyst activity.53,54 However, this function not only accelerates the degradation of cellulose to HMF, but also simultaneously increases the formation of by-products, including unidentified soluble polymers and insoluble compounds that cover the active sites of the catalysts.
Moreover, each temperature has a best reaction time for maximum yield. For HPFCs-1 (Fig. 10b), the most effective conversions (20.9%, 23.2%, 22.0%, 20.1% and 17.2%) at various temperatures (110 °C, 120 °C, 130 °C, 140 °C and 150 °C) emerged at 90 min, 70 min, 50 min, 40 min and 40 min. For HPFCs-2 (Fig. 10c), the optimal combinations of reaction temperature and time were 90 min at 110 °C, 70 min at 120 °C, 70 min at 130 °C, 50 min at 140 °C and 50 min at 150 °C for yields of 30.1%, 40.0%, 33.0%, 27.3% and 23.8%. Similarly, the highest yields (31.8%, 42.0%, 37.5%, 30.4% and 25.3%) with HPFCs-3 (Fig. 9d) were obtained at 110 °C for 90 min, 120 °C for 50 min, 130 °C for 50 min, 140 °C for 40 min and 150 °C for 40 min. Obviously, 120 °C is the optimal temperature for the dissolution and degradation of macromolecular cellulose in [BMIM]-Cl. Then, with gradually reducing the reaction temperature, the reaction time must be lengthened to get the ideal HMF yield, as shown in Fig. 10b–d. This phenomenon is possibly attributed to the interaction of time and temperature in the catalytic process.
Furthermore, the maximum yield (42.0%) of HPFCs-3 appeared at 120 °C for 50 min, which is the highest efficiency compared with the catalysts HPFCs-2 (40.0% at 120 °C for 70 min) and HPFCs-1 (23.2% at 120 °C for 70 min). Less catalyst with a higher yield also verified the superior catalytic activity of HPFCs-3. This result is ascribed to the simultaneous existence of sulfated zirconia and mesopores in HPFCs-3.55 Also, the yield discrepancy between HPFCs-1 and HPFCs-2 is greater than discrepancy between HPFCs-2 and HPFCs-3, indicating the greater effectiveness of Lewis acidic sites from the SZs than the incremental increased specific surface area from the mesopores. In a word, the idea of preparing innovative catalysts through the treatment of mesoporous silica nanoparticles with sulfated zirconia is a feasible, effective and progressive design.
3.4 Recyclability of the catalysts
On account of green and sustainable chemistry, the regeneration of the catalysts is very necessary in the practical production of HMF, and the results are presented in Fig. 11a. The reactions were carried out under the optimized reaction conditions (60 mg of catalyst, at 120 °C and for 5 h) in the presence of HPFCs-3. It is worth mentioning that the solid acidic catalyst was reclaimed by the simple method of vacuum filtering the liquid admixture after the previous reaction and washing with deionized water, then drying at 30 °C for 12 h in a vacuum oven before the next reaction. The catalyst was recycled for four consecutive cycles with a total loss of only 5.2% activity. The slight reduction may be from by-products, which prevent new reactant molecules from contacting the acidic sites on the surface of the catalyst. Besides, we conducted a hot filtration test of the catalytic system to further confirm the catalyst stability through quantitatively determining the acid and zirconia in the filtrate. Notably, the average pH of the filtrates was 6.16, indicating the small loss of acid during catalysis. And the filtrate was not detected to contain zirconia from an EDTA complex titration method with xylenol orange indicator, demonstrating the stability of the Zr–O bond in the catalyst. The catalyst HPFCs-3 recovered after the fourth cycle was again characterized using an elemental analyzer, SEM and EDS. The rigid porous structure also could be observed from the SEM images (Fig. 11b), indicating that the reclaimed HPFCs-3 still possesses superior recyclability and reusability with high mechanical stability in the polymer network. Moreover, Zr and Si peaks were still detected in the EDS spectra of HPFCs-3 recovered after the fourth cycle (Fig. 11c). And, the elemental composition of S (6.7%) declined only slightly compared with the corresponding values for the as-prepared HPFCs-3 (Fig. 11d). Therefore, the excellent recyclability of HPFCs-3, indicating the stability of the acidic sites and polymer network, was very important for wider applications in the industrialized production of HMF from abandoned biomass. | ||
| Fig. 11 (a) Reusability of HPFCs-3 for the conversion of cellulose into HMF in [BMIM]-Cl under the optimized conditions: 120 °C, 40 mg of catalyst based on 100 mg of cellulose, 50 min, and 2.0 g of [BMIM]-Cl. (b) SEM image of HPFCs-3 recovered after the fourth cycle. (c) EDS image of HPFCs-3 recovered after the fourth cycle. (d) The element content of HPFCs-3 recovered after the fourth cycle. | ||
4. Conclusion
In this study, hierarchical porous foam catalysts with well-defined characteristics were explored for one-pot cellulose to HMF production. The synthetic method involves the formation of a ZrO2 layer on the surface of a SiO2 template, sulfuric acid treatment to introduce sulfate ions, and finally calcination to produce sulfated ZrO2 shells. And the Pickering HIPE template method was adopted to structure Brønsted–Lewis acidic and hierarchical porous catalysts. The influence of the sulfated ZrO2 and the additive mesopores on the catalytic effectiveness was demonstrated by a comparison of the three prepared catalysts and the HMF yield. The highest HMF yield (42%) was obtained for the one-pot conversion of cellulose into HMF with HPFCs-3, confirming the important roles of the Brønsted–Lewis acidic sites (sulfated ZrO2) and the hierarchical pores. In conclusion, these newly developed catalysts could be valuable for future study toward their wide application to biomass conversion and bioenergy.Acknowledgements
This work was financially supported by the National Natural Science Foundation of China (No. 21606100, No. 21107037, No. 21176107, No. 21306013), Natural Science Foundation of Jiangsu Province (No. BK20160498, No. BK2011514), National Postdoctoral Science Foundation (No. 2013M530240), and Postdoctoral Science Foundation funded Project of Jiangsu Province (No. 1202002B, No. 1501024A).References
- C. O. Tuck, E. Pérez, I. T. Horváth, R. A. Sheldon and M. Poliakoff, Science, 2012, 337, 695–699 CrossRef CAS PubMed.
- M. J. Climent, A. Corma and S. Iborra, Green Chem., 2011, 13, 520–540 RSC.
- P. Gallezot, Chem. Soc. Rev., 2012, 41, 1538–1558 RSC.
- G. Z. Wang, X. F. Tan, H. Lv, M. M. Zhao, M. Wu, J. P. Zhou, X. M. Zhang and L. N. Zhang, Ind. Eng. Chem. Res., 2016, 55, 5263–5270 CrossRef CAS.
- D. M. Alonso, J. Q. Bond and J. A. Dumesic, Green Chem., 2008, 12, 1493–1513 RSC.
- L. Q. Wu, J. L. Song, B. B. Zhang, B. W. Zhou, H. C. Zhou, H. L. Fan, Y. Y. Yang and B. X. Han, Green Chem., 2014, 16, 3935–3941 RSC.
- H. Kobayashi, M. Yabushita, T. Komanoya, K. Hara, I. Fujita and A. Fukuoka, ACS Catal., 2013, 3, 581–587 CrossRef CAS.
- H. P. Gao, J. M. Pan, D. L. Han, Y. L. Zhang, W. D. Shi, J. Zeng, Y. X. Peng and Y. S. Yan, J. Mater. Chem. A, 2015, 3, 13507–13518 CAS.
- B. R. Caes, R. E. Teixeira, K. G. Knapp and R. T. Raines, ACS Sustainable Chem. Eng., 2015, 3, 2591–2605 CrossRef CAS.
- M. G. Mazzotta, D. Gupta, B. Saha, A. K. Patra, A. Bhaumik and M. M. Abu-Omar, ChemSusChem, 2014, 7, 2342–2350 CrossRef CAS PubMed.
- E. S. Kim, S. Liu, M. M. Abu-Omar and N. S. Mosier, Energy Fuels, 2012, 26, 1298–1304 CrossRef CAS.
- S. Dutta, S. De, I. Alam and M. M. Abu-Omar, J. Catal., 2012, 288, 8–15 CrossRef CAS.
- Y. L. Zhang, J. M. Pan, M. Y. Gan, H. X. Ou, Y. S. Yan, W. D. Shi and L. B. Yu, RSC Adv., 2014, 4, 11664–11672 RSC.
- Y. L. Zhang, J. M. Pan, Y. S. Yan, W. D. Shi and L. B. Yu, RSC Adv., 2014, 4, 23797–23806 RSC.
- A. T. Pedersen, R. Ringborg, T. Grotkjær, S. Pedersen and J. M. Woodley, Chem.–Eng. J., 2015, 273, 455–464 CrossRef.
- B. R. Caes, T. R. Van Oosbree, F. Lu, J. Ralph, C. T. Maravelias and R. T. Raines, ChemSusChem, 2013, 6, 2083–2089 CrossRef CAS PubMed.
- K. Su, X. Liu, M. Ding, Q. Yuan, Z. Li and B. Cheng, J. Mol. Catal. A: Chem., 2013, 379, 350–354 CrossRef CAS.
- B. R. Caes, M. J. Palte and R. T. Raines, Chem. Sci., 2013, 4, 196–199 RSC.
- R. Carrasquillo-Flores, M. Käldström, F. Schüth, J. A. Dumesic and R. Rinaldi, ACS Catal., 2013, 3, 993–997 CrossRef CAS.
- H. M. Xu, Z. C. Miao, H. H. Zhao, J. Yang, J. Zhao, H. L. Song, N. Liang and L. j. Chou, Fuel, 2015, 145, 234–240 CrossRef CAS.
- X. H. Qi, M. Watanabe, T. M. Aida and R. L. Smith, Cellulose, 2011, 18, 1327–1333 CrossRef CAS.
- Y. T. Shen, Y. L. Zhang, Y. Chen, Y. S. Yan, J. M. Pan, Q. G. Xiong, M. Liu and W. D. Shi, Energy Technol., 2016, 4, 600–609 CrossRef CAS.
- H. P. Gao, Y. X. Peng, J. M. Pan, J. Zeng, C. H. Song, Y. L. Zhang, Y. S. Yan and W. D. Shi, RSC Adv., 2014, 4, 43029–43038 RSC.
- Y. L. Zhang, J. M. Pan, Y. T. Shen, W. D. Shi, C. B. Liu, L. B. Yu and Y. S. Yan, ACS Sustainable Chem. Eng., 2015, 3, 871–879 CrossRef CAS.
- Y. L. Zhang, Y. Chen, Y. T. Shen, J. M. Pan, W. D. Shi, L. B. Yu and Y. S. Yan, ChemPlusChem, 2016, 81, 108–118 CrossRef CAS.
- Y. L. Zhang, Y. T. Shen, Y. Chen, Y. S. Yan, J. M. Pan, Q. G. Xiong, W. D. Shi and L. B. Yu, Chem. Eng. J., 2016, 294, 222–235 CrossRef CAS.
- S. H. Zhu, Y. F. Xue, J. Guo, Y. L. Cen, J. U. Wang and W. B. Fan, ACS Catal., 2016, 6, 2035–2042 CrossRef CAS.
- M. Hino and K. Arata, J. Chem. Soc., Chem. Commun., 1980, 851–852 RSC.
- A. Osatiashtiani, A. F. Lee, M. Granollers, D. R. Brown, L. Olivi, G. Morales, J. A. Melero and K. Wilson, ACS Catal., 2015, 5, 4345–4352 CrossRef CAS.
- J. B. Joo, A. Vu, Q. Zhang, M. Dahl, M. F. Gu, F. Zaera and Y. D. Yin, ChemSusChem, 2013, 6, 2001–2008 CrossRef CAS PubMed.
- Y. Ren, Z. Ma, R. E. Morris, Z. Liu, F. Jiao, S. Dai and P. G. Bruce, Nat. Commun., 2013, 4, 2015 Search PubMed.
- E. Slovakova, M. Jeselnik, E. Zagar, J. Zednik, J. Sedlacek and S. Kovacic, Macromolecules, 2014, 47, 4864–4869 CrossRef CAS.
- Z. J. Wang, S. Ghasimi, K. Landfester and K. A. I. Zhang, J. Mater. Chem. A, 2014, 2, 18720–18724 CAS.
- H. Kobayashi, H. Kaiki, A. Shrotri, K. Techikawara and A. Fukuoka, Chem. Sci., 2016, 7, 692–696 RSC.
- Y. Y. Bai, W. X. Liu, C. H. Yu, T. Wang, J. K. Feng and S. L. Xiong, J. Phys. Chem. C, 2016, 120, 2984–2992 CAS.
- F. Iskandar, A. B. D. Nandiyanto, K. M. Yun, C. J. Hogan, K. Okuyama and P. Biswas, Adv. Mater., 2007, 19, 1408–1412 CrossRef CAS.
- X. D. Li, G. Q. Sun, Y. C. Li, J. C. Yu, J. Wu, G. H. Ma and T. Ngai, Langmuir, 2014, 30, 2676–2683 CrossRef CAS PubMed.
- V. O. Ikem, A. Menner and A. Bismarck, Langmuir, 2010, 26, 8836–8841 CrossRef CAS PubMed.
- G. D. Yadav and R. V. Sharma, Appl. Catal., B, 2014, 147, 293–301 CrossRef CAS.
- Y. L. Zhang, J. M. Pan, Y. Chen, W. D. Shi, Y. S. Yan and L. B. Yu, Chem. Eng. J., 2016, 283, 956–970 CrossRef CAS.
- L. L. C. Wong, P. M. Baiz Villafranca, A. Menner and A. Bismarck, Langmuir, 2013, 29, 5952–5961 CrossRef CAS PubMed.
- M. J. Zhang, W. Wang, X. L. Yang, B. Ma, Y. M. Liu, R. Xie, X. J. Ju, Z. Liu and L. Y. Chu, ACS Appl. Mater. Interfaces, 2015, 7, 13758–13767 CAS.
- Y.-Y. Lee and K. C. W. Wu, Phys. Chem. Chem. Phys., 2012, 14, 13914–13917 RSC.
- H. Y. Xu, X. H. Zheng, Y. F. Huang, H. T. Wang and Q. G. Du, Langmuir, 2016, 32, 38–45 CrossRef CAS PubMed.
- Y. S. Qu, Q. Y. Wei, H. Q. Li, P. Oleskowicz-Popiel, C. P. Huang and J. Xu, Bioresour. Technol., 2014, 162, 358–364 CrossRef CAS PubMed.
- V. O. Ikem, A. Menner and A. Bismarck, Soft Matter, 2011, 7, 6571–6577 RSC.
- L. L. C. Wong, V. O. Ikem, A. Menner and A. Bismarck, Macromol. Rapid Commun., 2011, 32, 1563–1568 CrossRef CAS PubMed.
- M. Destribats, B. Faure, M. Birot, O. Babot, V. Schmitt and R. Backov, Adv. Funct. Mater., 2012, 22, 2642–2654 CrossRef CAS.
- S. Kovacic, A. Anzlovar, B. Erjavec, G. Kapun, N. B. Matsko, M. Zigon, E. Zagar, A. Pintar and C. Slugovc, ACS Appl. Mater. Interfaces, 2014, 6, 19075–19081 CAS.
- Z. F. Li, T. Ming, J. F. Wang and T. Ngai, Angew. Chem., Int. Ed., 2009, 48, 8490–8493 CrossRef CAS PubMed.
- S. W. Zou, Z. J. Wei, Y. Hua, Y. H. Deng, Z. Tong and C. Y. Wang, Polym. Chem., 2014, 5, 4227–4234 RSC.
- D. Liu, P. Yuan, H. M. Liu, J. G. Cai, D. Y. Tan, H. P. He, J. X. Zhu and T. H. Chen, Appl. Clay Sci., 2013, 80, 407–412 CrossRef.
- M. E. Zakrzewska, E. Bogel-Lukasik and R. Bogel-Lukasik, Chem. Rev., 2011, 111, 397–417 CrossRef CAS PubMed.
- A. Dutta, D. Gupta, A. K. Patra, B. Saha and A. Bhaumik, ChemSusChem, 2014, 7, 925–933 CrossRef CAS PubMed.
- W. H. Peng, Y. Y. Lee, C. Wu and K. C. W. Wu, J. Mater. Chem., 2012, 22, 23181–23185 RSC.
Footnote |
| † Electronic supplementary information (ESI) available. See DOI: 10.1039/c6ra14615e |
| This journal is © The Royal Society of Chemistry 2016 |