Alireza Zirehpoura,
Ahmad Rahimpour*a,
Saeed Khoshhala,
Mostafa Dadashi Firouzjaeib and
Ali Asghar Ghoreyshia
aMembrane Research Laboratory, School of Chemical Engineering, Babol University of Technology, Babol, Iran. E-mail: ahmadrahimpour@nit.ac.ir; ahmadrahimpour@yahoo.com; Fax: +98 11 32334204; Tel: +98 11 32334204
bDepartment of Material Science and Engineering, Sharif University of Technology, Tehran, Iran
First published on 18th July 2016
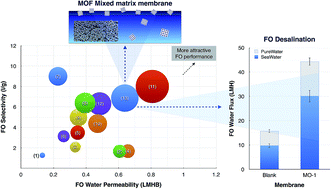
In this study, a hydrophilic metal–organic framework (MOF) was applied to improve the performance of a cellulosic membrane for forward osmosis (FO) desalination application. The characterization results confirmed that the MOF particles existed within the matrix of the modified membrane. The MOF loading led to adjustment of the membranes in terms of overall porosity, pore inter-connectivity and hydrophilicity. These features caused an improvement in the pure water permeability (72%) and reduce the structural parameter of the modified membrane to 136 μm. The FO water flux of the modified membrane enhanced by about 180% compared to an unmodified membrane, without decreasing its selectivity. FO fouling experiments were performed with a feed solution comprising a model organic foulant. The results demonstrated that the modification considerably improved the membrane antifouling properties when compared to the unmodified membranes. Water flux was also more easily recovered through physical cleaning for the modified membrane. The modified membrane was continuously tested under FO seawater desalination to investigate the performance stability. The modified membrane demonstrated a noteworthy water flux of above 30 LMH, using a 2 M NaCl draw solution. The modified membrane developed in this study exhibited outstanding permselectivity compared to ones reported in the literature.
The ICP is one of the most important FO process challenges causing to reduce the FO performance.26–28 ICP is mainly influenced by specific characteristics of membrane sub layer, such as the porosity (ε), tortuosity (τ) and thickness.29,30 The structural parameter (S, thickness × tortuosity/porosity) has been introduced as an indicative value to quantify the structure contribution of the FO membrane on ICP. Several methods have been carried out to alleviate ICP via reducing the membrane thickness8 and increasing the porosity of sub layer.31–33 The incorporation of the inorganic fillers as nonporous materials in FO membranes can result in significant changes in the membrane properties such as morphology, hydrophilicity, performance and FO performance.24,34–37 In this study, metal organic framework (MOF), as a porous nanostructure material, was applied to improve the structure and performance of FO membranes. MOFs as hybrid inorganic–organic compounds are new categories of porous materials with exceptionally large surface area as well as high pore volume. MOFs have better affinity for the polymeric chains than inorganic fillers because of the organic linkers present in their structure. Hence, it is easier to control MOF–polymer interface interactions, and avoid non-selective voids between the phases. The blend of MOF with a polymer to form a composite membrane for gas separation applications has been widely studied.38 Moreover, liquid separation studies of MOF mixed matrix membranes have been carried out for pervaporation39,40 and nanofiltration.41,42
The current study aims to investigate the impact of incorporating MOF nanomaterial within the cellulose acetate/triacetate (CTA) matrix for improving the FO membrane perm/selectivity, and controlling ICP. Cellulose esters are used in fabrication of FO membranes due to their intrinsic advantages involving low cost, wide availability, high hydrophilicity, low fouling as well as superior chlorine resistance.43,44 Copper-based MOF (Cu-BTC, btc = benzene-1,3,5-tricarboxylate) is considered as one of the most hydrophilic MOFs with a good affinity and structural stability toward water.45,46 Hence, this kind of MOF was chosen to improve the FO membranes. To the best knowledge of the authors, this is the first study addressing Cu-BTC as a modifier to improve the CTA membrane in terms of structural properties and FO performance during seawater desalination.
000) CTA (43–49 wt% acetyl) were provided from Eastman (USA). 1,4-Dioxane (≥99.5% purity), acetone (≥99% purity), maleic acid (≥99% purity), methanol (≥99.8% purity), lactic acid and sodium alginate were obtained from Sigma-Aldrich (MO, USA). Sodium chloride (NaCl, 99% purity) was also purchased from Merck-Millipore (Germany). MOF applied, Cu-BTC, was synthesized based on our previous study, where we investigated and optimized the MOF structure by considering the temperature and solvent content effects on crystallinity, textural properties and hydrogen storage capacity.47 Characterizations of the synthesized MOF were presented in the ESI, Table S1 and Fig. S1–S3.†
:
1 ratio), methanol (5 wt%) and lactic acid (5.7 wt%) in dioxane/acetone (3
:
1 ratio) as solvent. For preparation of mixed matrix membranes, two different MOF contents, 3 wt% and 6 wt% (based on polymer content) were loaded in the casting solution. The specifications of casting solution are given in Table 1. MOFs were dispersed in solvents and then subjected to the ultrasonic bath for 60 min, prior to dissolution of CTA and CA in the blend solution. Then, the casting solution kept under continuous stirring until the solution became completely homogenous. Afterward the solution was kept steady to remove the bubbles. The solution was sprinkled and casted on a flat glass plate using homemade casting knife with 75 micron thickness, followed by 30 s partial solvents evaporation. The cast film was immersed in a coagulation bath containing deionized (DI) water with temperature of 4 °C. The prepared membranes were kept in DI water at room temperature. Finally, the membranes were annealed at 80 °C for 15 min in water and stored in DI water prior to being used. The membranes were denoted as Blank, MO-1 and MO-2, containing 0, 3 and 6 wt% of MOF, respectively.
| Membrane | Polymer vs. filler (wt%) | Viscosity at shear rate of 10 s−1 (Pa s) | |
|---|---|---|---|
CA/CTA (ratio 4 : 1) |
MOF | ||
| Blank | 100 | 0 | 33.5 |
| MO-1 | 97 | 3 | 37.6 |
| MO-2 | 94 | 6 | 46.3 |
In order to study the membranes hydrophilicity, the surface water contact angle of the membranes was measured using a contact angle measuring instrument [G10, KRUSS, Germany]. To minimize the experimental error, the contact angle was measured at five random locations of each sample and the average value was reported.
Dope solution viscosities with different concentration of MOFs were measured using a Brookfield (DV2T) viscometer at 25 °C (varied rotational speed of the LV spindle).
Overall porosity (ε) of the membranes was obtained by gravimetric measurement using the following equation:48,49
![]() | (1) |
The FO water flux Jw was obtained by measuring the weight change of FS by a computer at 1 min intervals, using following equation:
![]() | (2) |
The FO salt flux Js was determined by calculating the change of salt content in the FS based on conductivity measurements using a computer at 10 min intervals:
![]() | (3) |
The intrinsic membrane active layer characteristics, water permeability coefficient (A) and solute permeability coefficient (B), as well as S parameter of the membranes were characterized based on methodology developed by Tiraferri et al.50 The methodology includes a single FO experiment divided into four stages, each utilizing a different DS concentration. The FO water flux and reverse salt flux are measured in each experimental stage and then least-squares non-linear regression fits the eight measured data to the corresponding FO transport equations by using A, B, and S as regression parameters.50 In order to increase the accuracy of the presented data, an average of three repeated experiments was reported.
As shown in the high magnification SEM images, all membranes had a fully sponge-like structure with inter-connecting pores. The membranes containing MOF exhibited more porous cross-section morphology and pore inter-connectivity than those of the blank membrane. As a result, a high porosity of about 89% was obtained for MO-1 membrane containing 3 wt% MOF (Table 2). Nevertheless, the higher MOF loading resulted in a less porous structure, as obtained for MO-2 membrane. Generally, a membrane with high porosity is more favoured in FO process.
| Membrane | Contact angle (deg.) | Overall porosity (%) |
|---|---|---|
| Blank | 67.3 ± 1.5 | 69.5 ± 0.5 |
| MO-1 | 55.2 ± 1.2 | 89.1 ± 0.5 |
| MO-2 | 51.3 ± 1.7 | 78.2 ± 0.5 |
The differences between the membrane structures are generally due to MOF loading in the casting solution and hence change affecting the thermodynamic and kinetic of the phase inversion process. High-porosity membrane is the result of situations that the kinetic or the thermodynamic effects accelerate the exchange rate of phase inversion. In this situation, the microstructural development confirmed that the appropriate amount of MOF helped to increase the thermodynamic instability as well as the exchange rate of solvent-non solvent and consequently, a more porous structure formed in the MO-1 membrane. However, less porous structure observed in the MO-2 membrane can be attributed to the kinetic hindrance due to a greater viscosity of the casting solution, which overwhelms the thermodynamic factor (Table 1).54–58
Fig. 2 shows MAP EDX analysis and high magnification image of the MO-1 membrane top layer. The image indicates many sub-microns MOF particles existing within the MO-1 selective layer (Fig. 2a). The CTA matrix seems to surround completely MOF particles, and no gaps observed around them. Additionally, the MAP EDX analysis well recognized the cupper within the membrane matrix. This proved that the Cu–BTC/MOF particles were successfully embedded in polymer matrix, and a homogeneous distribution was achieved (Fig. 2b).
![]() | ||
| Fig. 2 (a) High magnification FESEM images of the MO-1 membrane active layer, (b) cross section MAP EDX analysis of the MO-1 membrane for copper. | ||
Fig. 3 illustrates the top surface FESEM micrograph of the membranes. The images show that the membrane surfaces are relatively dense and smooth. All the membranes show similar morphology with no visual pores observed at the taken magnification. MOF particles can be easily seen in the surface of MOF mixed matrix membrane (bright points in Fig. 3b and c). The EDX spectra of six spots on the membranes surface were carried out to verify the MOF particles (Fig. 3d and e).
The results confirmed that the MOF particles existed within the active layer of the modified membranes and on their surface as well. The presence of MOF particles on the surface of modified membranes occurred during membrane formation, in which the high affinity of MOF particles to water causes the particles to migrate to the membrane top layer and concentrate at the water/membrane boundary to minimize the interfacial energy.59–61 However, lots of agglomerated particles on the active layer of MO-2 membrane may reduce selective layer integrity and thus decrease its performance.
As shown in AFM images, the rougher surface was introduced for mixed matrix membranes containing MOF (Fig. 4). The surface roughness of the MO-1 and MO-2 membranes increased about two and three times, respectively which may be attributed to the presence of MOF particles on their surfaces.
The quality of the interface in the membranes, that is, the static adhesion strength as well as the interfacial interaction, usually plays a very important role in the FO membranes to transfer the water. In this regard, the contact angle analysis was used to evaluate the surface hydrophilicity or wettability of the FO membranes. As revealed in Table 2, the contact angle of the MO-2 membrane decreased about 24%, compared to the blank membrane, indicating the membrane wettability was improved. It can be attributed to presence of the hydrophilic MOF particles within the membrane surface.
The results obviously indicated that MOF loading led to adjustment of the modified membranes in terms of porosity and pore inter-connectivity. In addition, hydrophilic surface and highly porous structure of MOF may selectively absorb water and provide alternative transport pathways for water media through the membrane. These features have been tailored to improve the FO performance of the resultant membranes.
Both the experimental data and the predicted data from the method developed by Tiraferri et al. have been presented.50
Increasing the DS concentration leads to a higher water flux because of a greater osmotic driving force across the membranes.62 The reverse solute leakage from DS to FS was increased due to a higher salt concentration gradient through the membrane. As it can be seen from Fig. 5a, MOF loading caused a much higher water flux in the modified membranes compared to the blank membrane. For example, MOF loading exhibited about 180% higher FO water flux in the MO-1 membrane than that of the unmodified membrane (2 M NaCl solution as DS). Higher amount of MOF (6 wt%) decreased the FO water flux. On the other hand, the incorporating of MOF in the membrane matrix resulted in a slight increase in solute flux of the modified membranes compared to the blank membrane.
Fig. 6 shows the membranes performance at active layer facing DS (ALDS) mode. The FO water flux of the membranes was considerably increased in ALDS mode. Generally, the water flux obtained from the ALDS mode is greater than that in the ALFS mode due to the lower ICP phenomenon in the ALDS mode.63,64 Similar to the observed trend in Fig. 5a, the MO-1 membrane exhibited the highest FO water flux compared to the other membranes in ALDS orientation. The FO water flux reached to about 63 L m−2 h−1 (2 M NaCl solution as DS).
![]() | ||
| Fig. 6 FO water flux of the membranes in ALDS mode and using different DS concentrations (T = 25 °C, feed = DI water), error bars represent standard deviation over runs. | ||
In order to discuss the experimental trends of FO performance, the intrinsic water (A) and solute (B) permeability coefficients, the S parameter for the membranes were calculated from the FO experimental data, and the results are summarized in Table 3. Moreover, the ratio of tortuosity (τ) to porosity (ε), an important ratio directly affects the S parameter, is presented. It is worth mentioning all the R2 and coefficient of variation (CV) values are within the recommended values of the used methodology. The CVs were calculated between the Js/Jw ratios of the different stages in each experiment for each the membrane. The results clearly indicate that the membrane properties depend on the amount of MOF loaded. The small amount of MOF particles in the MO-1 membrane led to enhance the water permeability, whereas the addition of more MOF in the MO-2 membrane resulted in higher water permeability of membrane but at the expense of selectivity. The B value amount of the MO-2 was almost twice compared to the MO-1.
| Membrane | A (L m−2 h−1 bar−1) | B (L m−2 h−1) | B/A (bar−1) | S (μm) | Thickness (μm) | τ/ε | R2 (Jv) | R2 (Js) | CV (%) |
|---|---|---|---|---|---|---|---|---|---|
| Blank | 0.82 | 0.157 | 0.191 | 579 | 75 ± 5 | 7.7 | 0.987 | 0.951 | 6.8 |
| MO-1 | 1.41 | 0.178 | 0.126 | 136 | 67 ± 8 | 2 | 0.988 | 0.979 | 9.7 |
| MO-2 | 1.73 | 0.354 | 0.203 | 318 | 70 ± 5 | 4.5 | 0.985 | 0.964 | 8.1 |
Presence of MOF particles may interrupts the CTA chain and causes an increase in polymer free volume.65 As a result, the water permeability of the membrane is improved. However, high loading of MOF in the MO-2 membrane can cause a lower degree of active layer integrity, reducing membrane efficiency in salt rejection and increasing solute flux.
Despite the fact that MOF loading slightly increased the B value, the B/A ratio as an important FO membrane selectivity parameter reduced in the MO-1 (Table 3). A lower B/A ratio is generally preferred to enhance selectivity, reduce fouling tendency as well as more stable FO processes operation.62,66,67 As can be seen the B/A ratio of the MO-1 membrane was 0.126 bar−1 which is almost 34% smaller than that of the blank membrane (0.191 bar−1). This indicates that MOF loading improved the MO-1 membrane selectivity.
The results implied that the A values were not fully consistent with the FO water flux. This indicated that the hydraulic resistance did not only reflect the FO membrane transport properties.24 The S parameter, an important FO membrane property which directly affects the ICP, can complete the explanation trends of FO water flux. As shown in Table 3, loading of MOF considerably reduced the S parameter of the modified membranes. For instance, the MO-1 exhibited a much smaller S value (136 μm) compared to the blank membrane (579 μm). This indicates the significant improvement of the mass transfer efficiency for the modified membrane. This is linked to its lower ratio of tortuosity to porosity (τ/ε), as shown in Table 3. However, the S parameter increased to about 318 μm when the MOF loading increased.
Incorporating MOF into CTA matrix offers a number of advantages to reduce S parameter. The results of membrane characterization confirmed that the MO-1 membrane had superior porosity as well as hydrophilicity compared to the unmodified membrane (Table 2 and Fig. 1). The higher porosity linearly affects the membrane S parameter, whereas the hydrophilicity has an indirect influence on the S parameter. Improving the membrane hydrophilicity (wettability) can maximize as well as minimize the effective porosity and tortuosity, respectively.29,68 These effective features refer to the membrane interconnected region, which can be saturated with water and may be available for water transport. Likewise, the pore network within the MOF particles may further enhance the continuity of water pathways and thus reduces the tortuosity value of the modified membranes. Furthermore, prominent feature of the high-surface area of MOF could enable high-water adsorption capacity.47,69 Both the higher porosity and the lesser tortuosity resulted in a lower ratio of τ/ε in the modified membrane. These may explain why the MOF particles reduced the S parameter in the modified membranes. However, the higher S parameter in the MO-2 membrane compared to the MO-1 is attributed to a lower degree of porosity and so a higher ratio of τ/ε.
Specific salt flux (Js/Jw) represents the amount of DS loss per unit of water produced in FO process. A lower Js/Jw ratio is desirable as it indicates a higher selectivity as well as efficiency to avoid the DS loss and accordingly severe ICP.67,70,71 As shown in Fig. 7, low content of MOF particles in the MO-1 membrane led to the lowest Js/Jw ratio in all DS concentrations, indicating an excellent water transport without reducing the membrane selectivity. While the high MOF content in the MO-2 membrane caused to the highest Js/Jw ratio, demonstrating a declined trend for its selectivity.
![]() | ||
| Fig. 7 Specific salt flux of the membranes at different DS concentrations, error bars represent standard deviation over runs. | ||
In the case of the MO-1 membrane, the observed decline in the specific salt flux, Js/Jw, compared to the blank membrane is attributed to its considerably enhanced A value without decreasing in the selectivity. Whereas, the less selective layer integrity for the MO-2 membrane resulted in a higher salt permeability, B, and thus increase in Js/Jw ratio. The theory of FO specific salt flux can support the observed results because there are a linear relationship between the experimental value of Js/Jw and the intrinsic membrane active layer characteristics ratio, B/A.67 At high Js/Jw ratio, the FO water flux decreases as the high salt concentration increases the ICP and decreases the effective osmotic pressure across the membrane. This also describes the decrease in the FO water flux through the MO-2 membrane as compared to the MO-1 membrane.
It can be concluded that a proper amount of MOF can considerably improve the membrane properties and FO performance as well. The high loading rate may lead to particle agglomeration in the membrane matrix, and consequently may have the negative effects on the membrane structure and performance.
The reverse diffusion of draw solute to the FS results in salts accumulated region at the active layer and feed stream interface. This phenomenon reduces the effective osmotic driving force, and hence a reduction of the FO water flux. Alginate layer that accumulate on the membrane surface exacerbate these effects through cake-enhanced osmotic pressure (CEOP).72 Whereas the membrane surface properties can intensify or alleviate the fouling propensity.
Hydrophilic surface can provide effective alterations on the membrane surface interaction with organic foulants. The thin water film that forms on a hydrophilic surface through hydrogen bonding prevents deposition of foulants and thus provides a lower fouling propensity.73 Therefor, the lower water flux decline of the MO-1 membrane can be attributed to its more hydrophilic surface which is the result of MOF loading. On the other hand, rougher surface can enhance fouling tendency on the membrane surface because of greater surface area for foulants attachment and possibility of their accumulation in valley.74 The fouling experiment results obviously indicated that in this case, the surface hydrohplicity of the MO-1 membrane predominantly resulted in an advanced antifouling property for MOF mixed matrix membrane.
![]() | ||
| Fig. 10 Comparisons of FO performance of the MOF modified membrane with various FO membranes in literature. (Orientation = ALFS, feed = DI water, DS = NaCl 0.5–2 M, T = 20–25 °C). | ||
Footnote |
| † Electronic supplementary information (ESI) available. See DOI: 10.1039/c6ra14591d |
| This journal is © The Royal Society of Chemistry 2016 |