The value-added utilization of glycerol for the synthesis of glycerol carbonate catalyzed with a novel porous ZnO catalyst†
Pingbo Zhang*,
Lihua Liu,
Mingming Fan*,
Yuming Dong and
Pingping Jiang
The Key Laboratory of Food Colloids and Biotechnology, Ministry of Education, School of Chemical and Material Engineering, Jiangnan University, Wuxi 214122, P. R. China. E-mail: pingbozhang@126.com; fanmm2000@126.com
First published on 28th July 2016
Abstract
In the carbonylation reaction, a novel porous ZnO was prepared by a calcination method, and the raw material Zn glycerolate platelets were prepared via the glycerol approach, which could make use of a by-product of glycerol. To elucidate their composition, morphology, and properties, the resulting materials were characterized by FT-IR, XRD, SEM, BET, XPS, TPD and TG. The results showed that the catalyst was porous and irregularly shaped with appropriate acid and base properties; moreover, it displayed better catalytic performance for the synthesis of glycerol carbonate. The highest glycerol carbonate yield reached 85.97% of ZnO from zinc glycerolate under the optimal reaction conditions of 5.0 wt% of catalyst, 1![[thin space (1/6-em)]](https://www.rsc.org/images/entities/char_2009.gif) :
:![[thin space (1/6-em)]](https://www.rsc.org/images/entities/char_2009.gif) 1.5 molar ratio of glycerol to urea and reacting at 140 °C for 6 h under 1 kPa. Comparing the three catalysts ZnO, zinc glycerolate and ZnO from zinc glycerolate, the maximum glycerol carbonate yield was 85.97% with the ZnO from zinc glycerolate as the catalyst under optimized operating conditions. Compared with the conventional ZnO, the as-prepared catalyst embodied in its porosity, acidity and basicity. The catalyst maintained excellent catalytic performance after 5 cycles with almost no loss of catalytic activity. This study revealed that ZnO from a zinc glycerolate catalyst is highly active, highly recyclable, remarkably stable, and environmental friendly for industrial applications. Overall, this new material overcomes the limitation of glycerol application and will have a good potential for industrial application.
1.5 molar ratio of glycerol to urea and reacting at 140 °C for 6 h under 1 kPa. Comparing the three catalysts ZnO, zinc glycerolate and ZnO from zinc glycerolate, the maximum glycerol carbonate yield was 85.97% with the ZnO from zinc glycerolate as the catalyst under optimized operating conditions. Compared with the conventional ZnO, the as-prepared catalyst embodied in its porosity, acidity and basicity. The catalyst maintained excellent catalytic performance after 5 cycles with almost no loss of catalytic activity. This study revealed that ZnO from a zinc glycerolate catalyst is highly active, highly recyclable, remarkably stable, and environmental friendly for industrial applications. Overall, this new material overcomes the limitation of glycerol application and will have a good potential for industrial application.
1. Introduction
The sharp increase in demand for fuels and the increase in environmental problems, coupled with the reduction of crude oil reserves, have attracted peoples' attention about renewable energy.1 Biodiesel as a renewable energy has developed very well in recent years.2 In fact, the production of biodiesel is still relatively far away from the intended target, which is due to the high cost of production. In order to maintain the balance of the existing glycerol market, improve the added value of glycerol, and promote the development of the biodiesel industry, many researchers focus on the study of valued-added glycerol derivatives. As a result, glycerol as a biodiesel by-product is a viable method to reduce the cost of biodiesel production.3–5Conversion processes for glycerol as a renewable and cheap raw chemical for high value-added products have attracted more and more peoples' attention.6 Glycerol carbonate is a small molecule with a bifunctional compound containing a dioxolane ring and hydroxyl group.7,8 The bifunctional compound as reactive sites make glycerol carbonate a raw material for the synthesis of chemical intermediates achievable. Glycerol carbonate can react both as a nucleophile through its hydroxyl group, and as an electrophile through its ring carbon atoms. Glycerol carbonate can be used in solvents, beauty and personal care products, chemical intermediates, and polymers such as hyper-branched polyethers, polycarbonates, polyurethanes and non-isocyanate polyurethanes. Glycerol carbonate has many potential applications in manufacturing useful materials where it is used as a carrier in pharmaceutical preparations, lithium and lithium-ion batteries, and solid laundry detergent compositions.9
The synthesis of glycerol carbonate is carried out directly from glycerol and subcritical CO2 using Cu/La2O3,10 nBu2SnO,11 and La2O2CO3–ZnO12 catalysts. Glycerol carbonate can be synthesized through the reaction of glycerol with CO and O2 in the presence of PdCl2(phen)/KI catalysts.13 Glycerol carbonate could be synthesized with several different synthetic routes such as the transesterification reaction of glycerol and dimethyl carbonate or diethyl carbonate using K2CO3,14 CaO15 and hydrotalcite16 and the carbonylation reaction of glycerol and urea in the presence of catalysts such as metal oxides,17,18 WO3/SnO2,19 ionic liquids,20 lanthanum compounds,21 gypsum based catalyst,22 Zn–Al mixed-oxide catalyst,23 WO3/TiO2,24 tantalum in heteropoly tungstate catalysts,25 γ-zirconium phosphate,26–28 calcined Zn hydrotalcite,29 Co3O4/ZnO,30 gypsum and gold-based catalysts.31,32 CO and phosgene do not agree with the requirements of sustainable development. The use of carbon dioxide as a carbonating agent required high temperature and high pressure and the yield for glycerol carbonate was very low for practical purposes.
In our study, a novel solid catalyst was used for catalyzing glycerol and urea to synthesize the high value-added glycerol carbonate. Attempts are being focused on using urea due to its cheaper cost and safe handling. Furthermore, ammonia that is formed can be easily converted to urea since urea synthesis is performed from ammonia and carbon dioxide. The performances of the three catalysts ZnO, zinc glycerolate, and ZnO from zinc glycerolate were compared under optimized operating conditions. The catalyst was also characterized by FT-IR, XRD, SEM, BET, TPD, XPS and TG. In addition, the combination of a weak Lewis acid and Lewis base was found in the carbonate formation. In the reaction, glycerol can be used not only as the reactant but also as the catalyst precursor.
2. Experimental section
2.1 Materials
Anhydrous glycerol of high purity (>99%), urea (>99%), absolute ethanol (>99%), acetic acid (99%), zinc nitrate hexahydrate Zn(NO3)2·6H2O (99%), zinc acetate dihydrate Zn(CH3COO)2·2H2O (99%), oxalic acid (99%), potassium hydroxide KOH (99%) and zinc chloride (99%) were obtained from Sinopharm Chemical Reagent Co, Ltd, China.2.2 Catalyst preparation
Zn(CH3COO)2·2H2O (2 g) was mixed with glycerol (20 g) at 160 °C under reflux for 5 h. The resulting mixture was transferred into a Teflon-lined stainless steel autoclave and kept at 150 °C for 18 h. The product mixture was filtered, washed with distilled water, and dried at 80 °C in air overnight. Then, a white fine powder of Zn glycerolate was obtained. The as-prepared samples were labeled as ZMG and were heated with different thermal procedures (i.e. heating rates). Finally, the synthesized precursor ZMG was decomposed to ZnO by calcination at 450 °C in an N2 flow for 2 h (heating temperature rate was set to 0.5 °C min−1). The optimal thermal method was conducted at 450 °C at 0.5 °C min−1.In the 0.5 mol L−1 zinc nitrate solution, potassium hydroxide was added to prepare zinc hydroxide. The synthesized precursor Zn(OH)2 was decomposed to ZnO by calcination at 450 °C in air for 2 h.
2.3 Catalyst characterization
For the solid catalyst, 1 mg of sample and 200 mg of KBr were ground completely and pressed into thin disks. Subsequently, the FT-IR of samples were tested by a FTLA2000 Fourier transform infrared spectrometer (Canadian ABB) with a scanning range 4000–500 cm−1.X-ray diffraction (XRD) patterns were examined with a Bruker D8 Advance powder diffractometer using a Cu Kα radiation source (λ = 1.5406 Å) at 40 kV and 40 mA from 10° to 90° with a scan rate of 4° min−1.
The morphology of the catalyst was evaluated by field emission scanning electron microscopy (FE-SEM) on a Hitachi S-4800.
The specific surface area and pore diameter of the catalysts were measured according to the Brunauer–Emmet–Teller (BET) method with nitrogen adsorption–desorption with an ASAP 2020 instrument (Micromeritics, USA).
Temperature programmed desorption of CO2 (CO2-TPD) was measured to determine the basicity and base intensity distribution of the catalysts. The sample was pretreated under a helium flow at 300 °C for 1 h. Subsequently, it was cooled to 50 °C to adsorb CO2. After adsorption of CO2 for 30 min, the catalyst was pretreated under a helium flow at 100 °C for 1 h to remove the adsorbed CO2 from the sample surface. A desorption curve was recorded from 100 °C to 800 °C at 10 °C min−1.
Temperature programmed desorption of NH3 (NH3-TPD) was performed to determine the acidity and acid intensity distribution of the catalysts. The sample was pretreated under a helium flow at 300 °C for 1 h. Subsequently, it was cooled to 50 °C to adsorb NH3. After adsorption of NH3 for 30 min, the catalyst was pretreated under a helium flow at 100 °C for 1 h to remove the adsorbed NH3 from the sample surface. A desorption curve was recorded from 100 °C to 800 °C at 10 °C min−1.
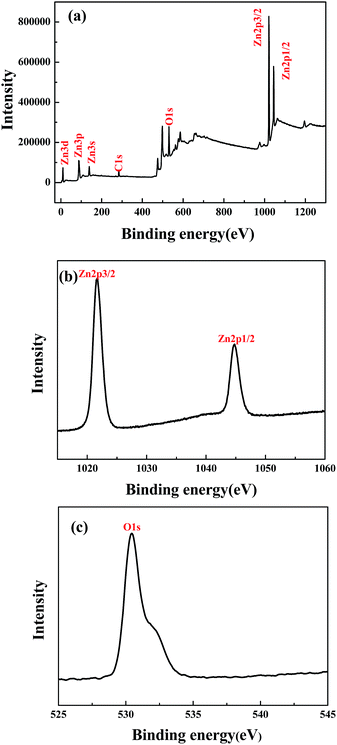
X-ray photoelectron spectroscopy (XPS) analysis was conducted using an ESCALAB 250 Xi (Thermo, USA) X-ray photoelectron spectrometer with an Al Kα line as the excitation source (hν = 1484.6 eV) and adventitious carbon (284.6 eV for binding energy) was used as a reference to correct the binding energy of the sample.
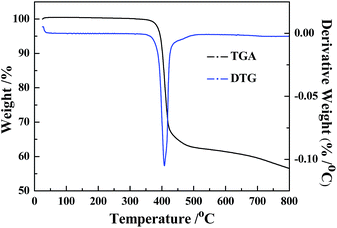
TG analysis was performed with a STA409 instrument in dry air at a heating rate of 20 °C min−1.
2.4 Catalytic reaction
The carbonylation reaction was carried out in a 100 mL three-necked flask with a magnetic stirrer. An aliquot of 25 mmol glycerol, 37.5 mmol urea and a certain amount of prepared catalysts (5 wt% to glycerol) was added into the flask. The carbonylation reaction was performed at 140 °C for 6 h under stirring, under reduced pressure of under 1 kPa. After completion of the reaction, the mixtures were cooled to ambient temperature. Then, 15 mL of methanol was used to wash the catalyst. Subsequently, the reaction mixtures were separated from the catalyst by centrifugation and dried for 12 hours. The supernatant was used for gas chromatography analysis. The washed catalyst was used in the next circulation.2.5 Product analysis
The supernatant was analyzed by gas chromatography 9790II. A quantitative analysis method of glycerol and glycerol carbonate was performed using a SE-54 capillary column with an FID detector using tetraglycol as an internal standard.33–36 The injection volume of the sample was 0.2 μL. The temperature program increased from 60 °C to 260 °C, using a silyl reagent in the analysis. The silylation agent37,38 composed of 4 mL DMF, 4 mL dioxane amine hexamethyldisilazane and 0.1 mL trimethylchlorosilane. A 100 μL aliquot of the sample was derivatized by adding the silylation reagent in a tube. Subsequently, the tube was vibrated for 1 min and allowed to stand. The supernatant was analyzed by gas chromatography.3. Results and discussion
3.1 Characterization of catalysts
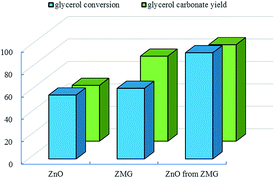 | ||
Fig. 1 Comparison of activity of three catalysts (reaction conditions: glycerol/urea = 1![[thin space (1/6-em)]](https://www.rsc.org/images/entities/char_2009.gif) : :![[thin space (1/6-em)]](https://www.rsc.org/images/entities/char_2009.gif) 1.5, catalyst dosage 5.0 wt%, 140 °C, 6 h, 1 kPa). 1.5, catalyst dosage 5.0 wt%, 140 °C, 6 h, 1 kPa). | ||
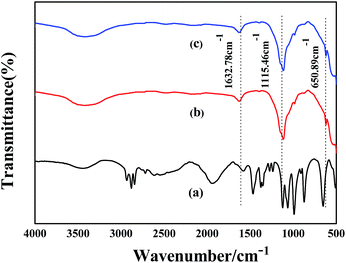
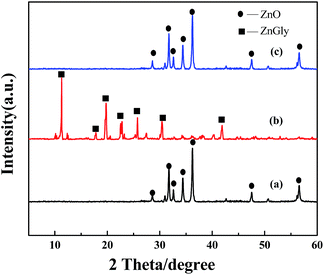
Upon subsequent heating of the sample to 450 °C, the evolution of the ZnO phase (JCPDS file no. 65-3411)43 occurred, as seen in Fig. 3(b). Fig. 3(b) depicts the diffraction profile of the calcined sample, and all the peaks were well indexed to the ZnO phase (JCPDS file no. 65-3411; Fig. 3(b)). ZnO that was calcined from ZMG with a platelet-like structure had the larger surface area. ZnO obtained from Zn(OH)2 was identified as the ZnO phase (JCPDS file no. 65-3411) in Fig. 3(c). However, the morphology of ZnO obtained from Zn(OH)2 was inferior to ZnO obtained from ZMG.
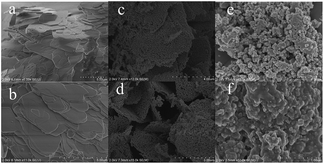
We speculate that the major change in morphology of the sample can be explained due to the loss of organic ligands, resulting from the phase transition from ZMG to ZnO at high temperature, which was consistent with the XRD analysis as described earlier.39 At the same time, the micrographs reveal that most of them are porous and irregularly shaped. The precursor ZMG after calcination transformed into ZnO. ZMG with plate-like morphology and its layered structure resulted in poor catalytic performance due to the absence of porosity in the plate. The precursor ZMG after calcination had a porous layer structure that contributed to its excellent catalytic performance. The morphology of ZnO displayed that the samples were stacked together in Fig. 4(c) and (d). That resulted in the formation of nonporous materials, which was the reason of poor catalytic performance.
| Catalyst | BET surface area (m2 g−1) | Pore volume (cm3 g−1) | Pore diameter (nm) |
|---|---|---|---|
| ZnO from ZMG | 13.71 | 0.04531 | 48.15 |
| ZMG | 3.698 | 0.03752 | 16.15 |
| ZnO | 1.178 | 0.004923 | 7.568 |
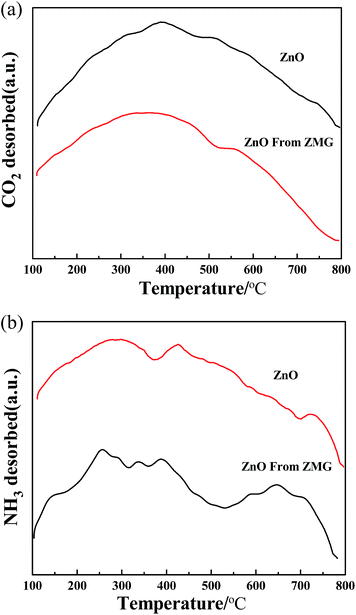 | ||
| Fig. 5 (a) TPD of CO2 profiles of two catalysts: ZnO and ZnO from ZMG solid catalysts. (b) TPD of NH3 profiles of two catalysts: ZnO and ZnO from ZMG solid catalysts. | ||
The NH3 desorption capacity is proportional to the amount of acid and the NH3 desorption temperature represents the strength of acid sites. For acidity, the NH3 desorption curve is shown in Fig. 5(b). The ZnO catalyst exhibited a broad desorption peak in the range of 250–350 °C. These desorption peaks are related to the weak acid sites in the catalyst. ZnO from ZMG catalyst also presented two broad desorption peak in 200–500 °C and 550–800 °C. These desorption peaks at 200–500 °C are related to the weak acid sites in the catalyst and the desorption peaks at 550–800 °C are related to the strong acid sites in the catalyst. The NH3 desorption integrated area of the ZnO from the ZMG catalyst was 5413.714. The NH3 desorption integrated area of the ZnO catalyst was 3132.736. Thus, from the integrated area, ZnO from ZMG catalyst had a high peak area, which showed a stronger acidity. It can been seen from the integrated area that the acidic property was nearly close to the basic property of ZnO from ZMG. In the carbonylation reaction, the Lewis acid catalyst activated the urea carbonyl group and the hydroxyl group of glycerol was activated by the conjugated basic sites. The results showed that the adequate combination of a weak Lewis acid and a Lewis base plays an important role in the high yield of glycerol carbonate.
The amount of base and acid of ZnO was inferior to that of ZnO from ZMG.
3.2 Catalytic activity
![[thin space (1/6-em)]](https://www.rsc.org/images/entities/char_2009.gif) :
:![[thin space (1/6-em)]](https://www.rsc.org/images/entities/char_2009.gif) 1.5 at 140 °C in the presence of a catalyst and usually under vacuum to shift the thermodynamic equilibrium by continuously removing the ammonia formed. The carbonylation reaction was performed by varying the urea to glycerol molar ratios from 1
1.5 at 140 °C in the presence of a catalyst and usually under vacuum to shift the thermodynamic equilibrium by continuously removing the ammonia formed. The carbonylation reaction was performed by varying the urea to glycerol molar ratios from 1![[thin space (1/6-em)]](https://www.rsc.org/images/entities/char_2009.gif) :
:![[thin space (1/6-em)]](https://www.rsc.org/images/entities/char_2009.gif) 1 to 3
1 to 3![[thin space (1/6-em)]](https://www.rsc.org/images/entities/char_2009.gif) :
:![[thin space (1/6-em)]](https://www.rsc.org/images/entities/char_2009.gif) 1 and at 140 °C until the completion of the reaction (see Fig. S2 in ESI†). In the first stage, the yields of glycerol carbonate gradually increased until the maximum values were reached. Further increases in the molar ratio of urea-to-glycerol beyond its optimum value would decrease the yield of glycerol carbonate. Hence, a 1.5
1 and at 140 °C until the completion of the reaction (see Fig. S2 in ESI†). In the first stage, the yields of glycerol carbonate gradually increased until the maximum values were reached. Further increases in the molar ratio of urea-to-glycerol beyond its optimum value would decrease the yield of glycerol carbonate. Hence, a 1.5![[thin space (1/6-em)]](https://www.rsc.org/images/entities/char_2009.gif) :
:![[thin space (1/6-em)]](https://www.rsc.org/images/entities/char_2009.gif) 1 molar ratio of urea to glycerol was selected for optimizing urea-to-glycerol molar ratio parameters.
1 molar ratio of urea to glycerol was selected for optimizing urea-to-glycerol molar ratio parameters.![[thin space (1/6-em)]](https://www.rsc.org/images/entities/char_2009.gif) :
:![[thin space (1/6-em)]](https://www.rsc.org/images/entities/char_2009.gif) 1.5, reaction temperature of 140 °C, 1 kPa and reaction time of 6 h in Fig. S4.† According to Fig. S4,† it is clear that addition of catalyst ameliorated the yield of GC.
1.5, reaction temperature of 140 °C, 1 kPa and reaction time of 6 h in Fig. S4.† According to Fig. S4,† it is clear that addition of catalyst ameliorated the yield of GC.3.3 Catalyst stability tests
The stability of the catalyst ZnO from ZMG with porous, irregular shaped was examined by testing the reusability of the catalyst. The recyclability of the catalyst is very important for industrial and technological applications. Catalyst recycling is an important step as it minimizes the cost of the process. The ZnO catalyst in each reaction was separated by the separator, washed with methanol and dried fully before reutilization. The stability of the catalyst was investigated (Fig. 8). The glycerol carbonate yield could remain 70.85% after the catalyst was repeatedly used for five times. Recycling experiments were executed by employing it in the consecutive reaction for 6 times under the same conditions. After each reaction, the catalyst was fully washed with methanol over again and dried in an oven overnight. In order to further explore the superiority of the ZnO catalyst on the catalytic performance, a comparison of ZnO, pure ZnO and ZMG had been repeated. The retained performance illustrated that the activity of catalyst still exists after the circulation. The catalyst still showed excellent catalytic performance without significantly weakening. The particle size of the porous ZnO catalyst was maintained between 220 nm and 235 nm. The polydispersibility of the porous ZnO catalyst was less than ZnO, which demonstrated the excellent dispersion performance of the catalyst (Fig. S5†). As seen by the XRD characterization, the structure of the catalyst was essentially maintained during the recycling tests, and it was helpful for the good recycling performance. Therefore, the porous ZnO catalyst that is highly active, highly recyclable, remarkably stable, and environmental friendly can be appropriately applied in industrial settings.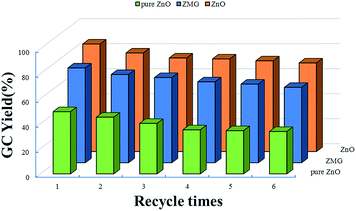 | ||
Fig. 8 Comparison of reusability of three catalysts (reaction conditions: glycerol/urea = 1![[thin space (1/6-em)]](https://www.rsc.org/images/entities/char_2009.gif) : :![[thin space (1/6-em)]](https://www.rsc.org/images/entities/char_2009.gif) 1.5, catalyst dosage 5.0 wt%, 140 °C, 6 h, 1 kPa). 1.5, catalyst dosage 5.0 wt%, 140 °C, 6 h, 1 kPa). | ||
4. Conclusions
In short, the heterogeneous catalysts prepared in this study can be applied for the synthesis glycerol carbonate in industrial production. Compared with different catalysts, the maximum glycerol carbonate yield is 85.97% with ZnO from ZMG as the catalyst under optimized operating conditions. Reaction tests indicated that the catalysts with appropriate acid and base properties were favorable for the synthesis of glycerol carbonate. The catalyst still has excellent catalytic performance after 5 cycles with almost no loss of catalytic activity. The study revealed that the ZnO catalysts have the advantages of high activity, high recyclability, high stability, and environmental friendliness that can be appropriately applied in industrial settings.A green co-generation of high purity of zinc glycerolate (ZMG) and glycerol carbonate (GC) was established using glycerol as the main raw material. In this study, glycerol can be relevant for applications such as reactants and as a raw material to prepare the catalyst. Furthermore, the reaction product of ammonia can also be used in the next reaction to synthesize urea. We hope that our work can make a contribution to the industrialization of glycerol carbonate.
Acknowledgements
The financial support from the National Natural Science Foundation of China (NSFC) (No. 21306063), the Fundamental Research Funds for the Central Universities (JUSRP51623A), the Key Research and Development Program of Jiangsu Province (Industry Outlook and Common Key Technologies) (BE2015204), the Fundamental Research Funds for the Central Universities (JUSRP51507), the and MOE & SAFEA for the 111 Project (B13025) are gratefully acknowledged.References
- A.-R. Go, Y.-R. Lee and Y.-H. Kim, et al., Enzyme Microb. Technol., 2013, 53(3), 154–158 CrossRef CAS PubMed.
- H.-S. Jung, Y.-R. Lee and D. Kim, et al., Enzyme Microb. Technol., 2012, 51(3), 143–147 CrossRef CAS PubMed.
- N.-T. Nguyen and Y. Demirel, Int. J. Chem. React. Eng., 2011, 9 Search PubMed.
- M.-M. Fan, J. Yang, P.-P. Jiang, P.-B. Zhang and S.-S. Li, RSC Adv., 2013, 3, 752 RSC.
- F.-X. Yang, M.-A. Hanna and R.-C. Sun, Biotechnol. Biofuels, 2012, 5, 13 CrossRef CAS PubMed.
- W.-K. Teng, G.-C. Ngoh, R. Yusoff and M.-K. Aroua, Energy Convers. Manage., 2014, 88, 484–497 CrossRef CAS.
- M.-O. Sonnati, S. Amigoni and E.-P. Givenchy, et al., Green Chem., 2013, 15, 283 RSC.
- A. Dibenedetto, A. Angelini and M. Aresta, et al., Tetrahedron, 2011, 67, 1308–1313 CrossRef CAS.
- J. Ochoa-Gómez, O. Gómez-Jiménez-Aberasturi, C. Ramírez-López and M. Belsué, Org. Process Res. Dev., 2012, 16, 389–399 CrossRef.
- J. Zhang and D.-H. He, J. Colloid Interface Sci., 2014, 419, 31–38 CrossRef CAS PubMed.
- J. George, Y. Patel, S.-M. Pillai and P. Munshi, J. Mol. Catal. A: Chem., 2009, 304, 1–7 CrossRef CAS.
- H.-G. Li, D.-Z. Gao, P. Gao, F. Wang and N. Zhao, et al., Catal. Sci. Technol., 2013, 3, 2801 CAS.
- J.-L. Hua, J.-J. Li, Y.-L. Gua, Z.-H. Guan and W.-L. Mo, et al., Appl. Catal., A, 2010, 386, 188–193 CrossRef.
- G. Rokicki, P. Rakoczy, P. Parzuchowski and M. Sobiecki, Green Chem., 2005, 7, 529–539 RSC.
- J.-R. Ochoa-Gómez, O.-A. Gómez-Jiménez-Aberasturib and B. Maestro-Madurgab, et al., Appl. Catal., A, 2009, 366(2), 315–324 CrossRef.
- A. Takagaki, K. Iwatani, S. Nishimura and K. Ebitani, Green Chem., 2010, 12, 578–581 RSC.
- Y. Patel, J. George, S.-M. Pillaic and P. Munshi, Green Chem., 2009, 11, 1056–1060 RSC.
- M.-G. Alvarez, M.-S. Anna, S. Contreras and J.-E. Sueiras, Chem. Eng. J., 2010, 161(3), 340–345 CrossRef CAS.
- M. Srinivas, G. Raveendra, G. Paramesw, P.-S. Sai Prasad, S. Loridant and N. Lingaiah, J. Chem. Sci., 2015, 127(5), 897–908 CrossRef CAS.
- J.-J. Chen, C. Wang, B. Dong, W.-G. Leng, J. Huang, R. Ge and Y.-N. Gao, Chin. J. Catal., 2015, 36, 5336–5343 Search PubMed.
- D.-F. Wang, X.-L. Zhang, C.-L. Liu and T.-T. Cheng, React. Kinet., Mech. Catal., 2015, 115, 597–609 CrossRef CAS.
- N.-A. Zuhaimi, V.-P. Indran, M.-A. Deraman, N.-F. Mudrikah, G.-P. Maniam, Y.-H. Taufiq-Yap and M.-H. Rahim, Appl. Catal., A, 2015, 502, 312–319 CrossRef CAS.
- Y.-B. Ryu, J.-S. Kim, K.-H. Kim, Y. Kim and M.-S. Lee, Res. Chem. Intermed., 2016, 42, 83–93 CrossRef CAS.
- K. Jagadeeswaraiah, C. Ramesh Kumar, A. Rajashekar, A. Srivani and N. Lingaiah, Catal. Lett., 2016, 146, 692–700 CrossRef CAS.
- M. Sharath Babu, A. Srivani, G. Parameswaram, G. Veerabhadram and N. Lingaiah, Catal. Lett., 2015, 145, 1784–1791 CrossRef CAS.
- Y.-Y. Wang and X.-J. Cao, Bioresour. Technol., 2011, 102(22), 10173–10179 CrossRef CAS PubMed.
- L.-B. Li, W.-Y. Zhang, N. Zhao, W. Wei and Y.-H. Sun, Catal. Today, 2006, 115(1–4), 111–116 CrossRef.
- M. Aresta, A. Dibenedetto, F. Nocito and C. Ferragina, J. Catal., 2009, 268(1), 106–114 CrossRef CAS.
- M.-J. Climent, A. Corma, P.-D. Frutos, S. Iborra, M. Noy, A. Velty and P. Concepción, J. Catal., 2010, 269(1), 140–149 CrossRef CAS.
- F. Rubio-Marcos, V. Calvino-Casilda, M.-A. Bañares and J.-F. Fernandez, J. Catal., 2010, 275(2), 288–293 CrossRef CAS.
- C. Hammond, J.-A. Lopez-Sanchez, M. H. A. A. Rahim and N. Dimitratos, et al., Dalton Trans., 2011, 40, 3927 RSC.
- N. A. S. Zuhaimi, V. P. Indran, M. A. Deraman and N. F. Mudrikah, et al., Appl. Catal., A, 2015, 502, 312–319 CrossRef CAS.
- H.-J. Wang and P.-F. Lu, J. Chem. Eng. Data, 2012, 57, 582–589 CrossRef CAS.
- L.-Y. Wang, Y. Liu, C.-L. Liu, R.-Z. Yang and W.-S. Dong, Sci. China: Chem., 2013, 56, 10 Search PubMed.
- Y. Wang, C.-L. Liu, J.-H. Sun, R.-Z. Yang and W.-S. Dong, Sci. China: Chem., 2015, 58, 4 CrossRef.
- G. Rokicki, P. Rakoczy, P. Parzuchowski and M. Sobiecki, Green Chem., 2005, 7, 529–539 RSC.
- J.-L. Hua, J.-J. Li, Y.-L. Gua and Z.-H. Guan, et al., Appl. Catal., A, 2010, 386, 188–193 CrossRef.
- P.-F. Lu, H.-J. Wang and K.-K. Hu, Chem. Eng. J., 2013, 228, 147–154 CrossRef CAS.
- J. Das and D. Khushalani, J. Phys. Chem. C, 2010, 114(17), 8114 CAS.
- D.-M. Reinoso, D.-E. Damiani and G.-M. Tonetto, Appl. Catal., B, 2014, 144, 308–316 CrossRef CAS.
- S. Fujita, Y. Yamanishi and M. Arai, J. Catal., 2013, 297, 137–141 CrossRef CAS.
- F.-S. Lisboa, F.-R. Silva, L.-P. Ramos and F. Wypych, Catal. Lett., 2013, 143, 1235–1239 CrossRef CAS.
- X. Collard, A. Comès and C. Aprile, Catal. Today, 2015, 241, 33–39 CrossRef CAS.
- N.-K. Divya and P.-P. Pradyumnan, Mater. Sci. Semicond. Process., 2016, 41, 428–435 CrossRef CAS.
- K. Ravichandran, K. Subha and N. Dineshbabu, J. Alloys Compd., 2016, 656, 332–338 CrossRef CAS.
- M. Shatnawi, A.-M. Alsmadi, I. Bsoul and B. Salameh, et al., J. Alloys Compd., 2016, 655, 244–252 CrossRef CAS.
- H.-R. Madan, S.-C. Sharma, U.-D. Suresh and Y.-S. Vidya, et al., Spectrochim. Acta, Part A, 2016, 152, 404–416 CrossRef CAS PubMed.
- L.-G. Wang, Y.-B. Ma, Y. Wang, S.-M. Liu and Y.-Q. Deng, Catal. Commun., 2011, 12(15), 1458–1462 CrossRef CAS.
Footnote |
| † Electronic supplementary information (ESI) available. See DOI: 10.1039/c6ra14288e |
| This journal is © The Royal Society of Chemistry 2016 |

