A spiro-type ammonium based switchable dielectric material with two sequential reversible phase transitions above room temperature

Xiao-Li Wang, Lin Zhou, Qiong Ye*, Fu-Juan Geng, Heng-Yun Ye, Da-Wei Fu* and Yi Zhang
Ordered Matter Science Research Center, Southeast University, Nanjing 211189, PR China. E-mail: yeqiong@seu.edu.cn; dawei@seu.edu.cn

Received 31st May 2016 , Accepted 25th July 2016

First published on 26th July 2016


Abstract

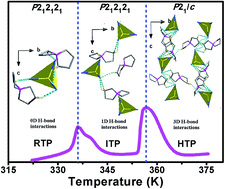
An organic–inorganic hybrid compound 5-azonia-spiro[4,4]nonane tetrabromocadmium (1, [ASN]2[CdBr4], ASN = (CH2)4N(CH2)4), has been discovered as a new phase transition material. Differential scanning calorimetry (DSC) and dielectric measurements reveal that 1 undergoes dielectric anomalies which could be tuned in three evident dielectric states and switched by two sequential reversible phase transitions around 336 and 357 K, respectively. Detailed variable-temperature single-crystal structural analyses indicate that the distinct twisting motions of the flexible [ASN]+ ammonium cationic moieties and the relative reorientations of both the ions contribute to the structure phase transitions of 1 triggered by temperature. Particularly, 1 displays a switchable SHG response in the vicinity of 357 K, where the temperature-dependent dielectric permittivity of 1 changes abruptly from 8 to 15, with a large thermal hysteresis of 19 K. Therefore, such a distinctive dielectric performance discloses that 1 might be an interesting high-temperature switchable dielectric and nonlinear optical material. All these results open a new venue to design novel phase transition materials through selecting the flexible spiro-type ammonium salts.

Introduction

Switchable phase transition materials have recently attracted great attention owing to their potential applications in data storage, signal processing and memory devices. Upon external stimuli, such as temperature, pressure, electric field and light, these materials can display switch-like behaviors between at least two states.1–5 In the vicinity of the transition temperature, some physical properties including dielectric, thermal and magnetic properties, exhibit anomalies, accompanied with distinct changes in crystal structures.6–11 Various approaches have been developed to construct molecular-based phase transition materials. Among them, one of the most valid strategies is to establish temperature-triggered organic–inorganic hybrid compounds possessing structural phase transitions. Many studies have shown that organic–inorganic hybrids are excellent candidates to prepare phase transition materials. Motion and reorientation of the organic cations and deformation of the anionic framework were confirmed to easily induce the phase transitions.12–20 For instance, the family of [CnH2n+1NH3]2[MCl4] (where M = divalent Mn, Cd, Fe or Cu) shows a perovskite-type layer structure, where there are infinite layers of corner-sharing distorted MCl6 octahedra with layers of ammonium groups attached to each side. Most of the observed phase transitions in this family are attributed to the deformations of the anion octahedra, changes in the hydrogen bonding scheme, thermal motion of the whole alkylammonium groups and conformational changes of the alkyl chains.21–24 [CH3NH3]2[ZnCl4] exhibits the phase transitions at 483 and 555 K owing to the order–disorder transitions of the [CH3NH3]+ cations and the large dielectric anomaly indicates the potential ferroelectricity.25–27 Recently, we also reported the multifunctional materials [(CH3)4P][FeX4] (X = Cl, Br)] synchronously show switchable dielectric, magnetic, and optical properties and undergo sequential reversible phase transitions above room temperature, and the rotations of the [(CH3)4P]+ cations relate to the phase transitions.28

In recent years, spiro-type quaternary ammonium electrolyte salts have been widely studied in EDLC (electronic double layer capacitor) applications. The supercapacitor using ASN-BF4 as electrolyte shows excellent performances with high solubility, electrical conductivity and excellent durability compared with other quaternary ammonium.29–32 Encouraged by our previously dielectric switch materials of [PMpip][ClO4] and [CMpip][ClO4],33 whose phase transitions are ascribed to the flexible cationic moieties of cyclohexane-type rings, we recently notice that the spirocyclic ammonium phase transition compounds have not been reported. Considering that the spiro-type compounds similarly possess flexible ring structure, we tried to explore the application of spirocyclic ammonium as an cationic ligand in terms of switchable dielectric material.34–41

Herein, we synthesized a novel organic–inorganic hybrid compound, [ASN]2[CdBr4] (1), which displays two sequential reversible structural phase transitions above room temperature and tunable dielectric responses among three different states. Systematic structure and property characterizations reveal that compound 1 is a potential switchable dielectric and nonlinear optical material.

Experimental

Synthetic procedures

All of the chemical reagents were used without any further purification. 5-Azonia-spiro[4,4]nonane bromide ([ASN][Br]) was prepared following the published literature.42 Compound 1, ([ASN]2[CdBr4]), was synthesized by the reaction of 5-azonia-spiro[4,4]nonane bromide and cadmium bromide tetrahydrate in the molar ratio 1[thin space (1/6-em)]:[thin space (1/6-em)]1. At room temperature, colorless block crystals were obtained by slow evaporation of the mixture aqueous solution within several days. As shown in Fig. S1 of the ESI, the formation of compound 1 was certified by the IR spectrum obtained on a Shimadzu Model IR-60 spectrometer; for instance, the peaks at about 2885, 2965 cm−1 are attributed to the existence of [(CH2)4N(CH2)4]+. Moreover, the powder X-ray diffraction (PXRD) pattern obtained at 298 K is in good agreement with the simulated pattern based on the crystal structure in the RTP, indicating the purity of the as-grown crystals (Fig. S2 in the ESI).

Single-crystal X-ray crystallography

Variable-temperature X-ray single-crystal diffraction data were performed on a Rigaku Saturn 924 diffractometer with Mo Kα radiation (λ = 0.71073 Å) at 293, 348 and 365 K. Data processing including empirical absorption corrections was performed using the Crystalclear software package (Rigaku, 2005). The structures were solved by direct methods and refined by the full-matrix method based on F2 by means of the SHELXLTL software package (SHELX-97). Non-H atoms were refined anisotropically using all reflections with I > 2σ(I). All H atoms were generated geometrically and refined using a “riding” model with Uiso = 1.2Ueq. (C and N). The asymmetric units and the packing views were drawn with DIAMOND (Brandenburg and Putz, 2005). Angles between some atoms were calculated using DIAMOND, and other calculations were carried out using SHELXLTL. Crystallographic data and structure refinements at 293, 348 and 365 K are listed in Table 1.
Table 1 Crystal data and structure refinements for [(CH2)4N(CH2)4]2[CdBr4] (1) at 293, 348 and 365 K
  293 K 348 K 365 K
Formula weight 684.45 684.45 684.45
Crystal system Orthorhombic Orthorhombic Monoclinic
Space group P212121 P212121 P21/c
a, Å 9.2978(19) 9.407(12) 9.99(2)
b, Å 18.028(4) 18.17(2) 17.24(4)
c, Å 14.049(3) 14.370(17) 15.09(3)
α, deg 90.00 90.00 90.00
β, deg 90.00 90.00 90.57(6)
γ, deg 90.00 90.00 90.00
V3), Z 2354.9(8), 4 2456(5), 4 2599(10), 4
F(000) 1320 1320 1320
R(int) 0.115 0.094 0.274
Measured reflections 16[thin space (1/6-em)]182 14[thin space (1/6-em)]299 4560
Independent reflections 5383 4319 208
Observed reflections 2401 1860 168
Completeness (%) 99.7 99.7 99.6
R[F2 > 2(F2)], S 0.074, 1.00 0.148, 1.22 0.301, 1.39


Powder X-ray diffractions

Powder X-ray diffraction (PXRD) data for 1 were measured on a Rigaku D/MAX 2000 PC X-ray diffractometer in the temperature range of 298–368 K. Diffraction patterns were collected in the 2θ range of 5–50° with a step size of 0.02°. The peak positions of the experimental and simulated XRPD patterns at RTP match very well, as shown in Fig. S2. The variable-temperature PXRD patterns also clearly show the phase transition processes (Fig. 2).
image file: c6ra14157a-f1.tif
Fig. 1 DSC curves of compound 1.

image file: c6ra14157a-f2.tif
Fig. 2 Variable-temperature PXRD patterns of compound 1 measured in the heating modes over 298–368 K.

DSC measurements

Differential scanning calorimetry was carried out on a PerkinElmer Diamond DSC instrument in the temperature range of 300–380 K under nitrogen at atmospheric pressure in aluminum crucibles with a heating rate of 10 K min−1.

SHG measurements

Powder SHG measurements of compound 1 were carried out on FLS 920, Edinburgh Instruments, in the temperature ranges of 300–370 K, using an unexpanded laser beam with low divergence (pulsed Nd:YAG at a wavelength of 1064 nm). The laser is Vibrant 355 II, OPOTEK.

Dielectric measurements

The pressed-powder pellets deposited with carbon conducting glue were used for the dielectric measurements with a heating/cooling rate of about 10 K min−1. For compound 1, the temperature dependencies of dielectric constants were measured on the Tonghui TH2828 analyzer in the temperature ranges of 290–380 K, respectively, within the frequency range of 5 kHz to 1 MHz.

Results and discussion

Thermal properties of compound 1

It is well-known that DSC can be effectively used to detect whether a compound displays reversible phase transition triggered by temperature. In the DSC runs of compound 1, two reversible heat anomalies at 336/331 K and 357/338 K (heating/cooling) were clearly observed, indicating that 1 exhibits two sequential phase transitions at T1 = 336 K and T2 = 357 K (Fig. 1). Considering the shape of the observed endothermic and exothermic peaks with the relatively large thermal hystereses of about 5 K and 19 K respectively, the phase transitions around T1 and T2 are attributed to the first-order type. Conveniently, we labeled the phase below T1 as the room-temperature phase (RTP), the phase between T1 and T2 as the intermediate-temperature phase (ITP) and the phase above T2 as the high-temperature phase (HTP).

Crystal structure discussions of compound 1

In order to confirm the existence of phase transition in compound 1, the crystal structures were performed at 293 K, 348 K and 365 K, respectively (Fig. 3a–c). At RTP, compound 1 crystallizes in an orthorhombic space group, P212121 (point group 222), which is noncentrosymmetric, with cell parameters of a = 9.2978(19) Å, b = 18.028(4) Å, c = 14.049(3) Å, V = 2354.9(9) Å3, and at ITP with similar cell parameters of a = 9.407(12) Å, b = 18.17(2) Å, c = 14.370(17) Å, V = 2456 (ref. 5) Å3 (Table 1). In the HTP, compound 1 transforms to a centrosymmetric space group P21/c (point group 2/m) at 365 K, with cell parameters of a = 9.99(2) Å, b = 17.24(4) Å, c = 15.09(3) Å, β = 90.57(6)°, V = 2599(10) Å3. β slightly changes from 90.00(0)° to 90.57(6)° and the syngony changes from orthorhombic (RTP, ITP) to monoclinic (HTP). Although the number of the symmetric elements doesn't change, the species varies from four (E, C2, 2C2) to four (E, C2, σh, i).
image file: c6ra14157a-f3.tif
Fig. 3 View of the asymmetric units of compound 1 obtained at (a) 293, (b) 348, (c) 365 K showing the atomic numbering scheme. Displacement ellipsoids are drawn at the 10% probability level. (d) The overlapped view of 1 in the 293 K (RTP, depicted with green), 348 K (ITP, blue) and 365 K (HTP, red).

The greatly molar powder was tested with variable-temperature powder X-ray diffractions in the temperature range of 298–368 K (Fig. 2). The experimental patterns obtained at intermediate and high temperature in the VT-PXRD match fairly well with the simulated data based on the single crystal X-ray diffraction. At 338 K (ITP), those diffraction peaks of 333 K were still observed and in good agreement with that obtained at 298 K, suggesting the isostructural phase transition between the RTP and ITP. Above 358 K (HTP), the diffraction peaks at 38.48° and 38.82° displayed consolidation, accompanying with the disappeared peaks at 12.32°, 25.08° and 29.66°, meaning the new phase at HTP. All above phenomenon indicate the phase transition of 1, which is completely consistent with the thermal measurements of DSC, offering a reliable proof of the existence of reversible phase transitions in 1.

Three phases of compound 1 show similar asymmetric units, and each asymmetric unit consists of two [ASN]+ cations and one [CdBr4]2− anion, however, the geometrical configurations of each temperature phases exist the distinct differences (Fig. 3a–c). In the RTP, the geometry of the five-membered rings N1–C1–C2–C3–C4, N1–C5–C6–C7–C8 and N2–C13–C14–C15–C16 approach the standard envelop conformation with the N atoms respectively deviating from the plane of the carbon atoms, while the remaining N1–C9–C10–C11–C12 ring approach the standard twist conformation (with C9–C10–C11 as the reference plane) and the twist axis passes through C10 and the center of the N2–C12 bond. Differently, in the ITP, the geometry of the ring N1–C1–C2–C3–C4 adopts the approximate standard envelop conformation with C3 stayed away from the plane of N1–C1–C2–C4, while the rings N2–C13–C14–C15–C16 and N1–C5–C6–C7–C8 apply the standard twist conformation (with C13–C14–C15 and N1–C5–C8 as the reference planes). However at HTP, all of the five-membered spiro-ammonium rings adopt the standard envelop conformation with C3, C6, N2, C15 respectively kept away from the plane of N1–C1–C2–C4, N1–C5–C7–C8, C9–C10–C11–C12, and N2–C13–C14–C16. It is apparent in Fig. 3 that thermal vibrations of the atoms become more acute from RTP to HTP with an increase in temperature.

Particularly, the thermal ellipsoids of N1 and N2 atoms in [(CH2)4N(CH2)4]+ cations show visible changes from RTP to HTP and most of the C atoms in spiro-rings also occurred thermal expansion of different degree. Such thermal ellipsoid changes can be ascribed to the torsion or motion of [(CH2)4N(CH2)4]+ cations upon heating, resulting in the phase transitions. As shown in Table 2, the key bond distances and angles fall within the normal ranges. In the RTP, the N–C and C–C bond lengths differ over the respective range of 1.411(17)–1.550(13) Å and 1.406(19)–1.59(2) Å, while in the HTP, the ranges are accompanied by 1.465(9)–1.472(9) Å and 1.48(2)–1.51(2) Å. At RTP, the geometry of the two [ASN]+ cations differs by endocyclic C–N–C angles in the range from 95.7(11)° to 110.3(10)° and exocyclic C–N–C angles from 99.1(10)° to 123.6(13)°, showing a relatively large deviation value compared with the 109°28′ of the regular tetrahedron. While at HTP, the exocyclic and endocyclic C–N–C angles vary from 110.0(8)° to 112.3° and 103(2)° to 108.3(5)°, accompanied with a comparatively small deviation value of 109°28′. As listed in Table 3, the selected torsion angles about the [ASN]+ cationic ligand related to the N spiro-atoms display intense variations from RTP to HTP, indicating that the geometrical configuration of spirocyclic ammonium cations in different states generate obvious transformations. According to the above described, it can be deduced that the torsion of the flexible [ASN]+ ammonium rings change the bond distances and angles of the cations to lead to the sequential phase transitions.

Table 2 The key bond distances and angels of compound 1 at 293, 348 and 365 K
  293 K 348 K 365 K   293 K 348 K 365 K
N1–C1 1.550(13) 1.4692(16) 1.465(9) N2–C9 1.411(17) 1.45(2) 1.47(2)
N1–C4 1.512(14) 1.4695(16) 1.472(9) N2–C12 1.457(16) 1.47(2) 1.47(2)
N1–C5 1.482(15) 1.4693(16) 1.470(9) N2–C13 1.481(9) 1.49(2) 1.46(2)
N1–C8 1.458(13) 1.4695(16) 1.468(9) N2–C16 1.521(17) 1.46(2) 1.47(2)
C1–N1–C4 101.4(8) 108.26(11) 107.9(6) C9–N2–C12 105.0(11) 106(2) 103(2)
C5–N1–C8 110.3(10) 108.26(11) 108.3(5) C13–N2–C16 95.7(11) 104(2) 108(2)
C1–N1–C5 107.2(9) 110.10(14) 110.2(8) C9–N2–C13 121.8(13) 114(3) 112(3)
C4–N1–C8 113.4(10) 110.06(13) 110.0(8) C12–N2–C16 99.1(10) 112(3) 111(3)
C1–N1–C8 115.8(9) 110.09(14) 110.5(8) C9–N2–C16 107.0(12) 115(3) 110(3)
C4–N1–C5 108.2(9) 110.07(13) 110.0(8) C12–N2–C13 123.6(13) 106(3) 112(3)


Table 3 The selected torsion angles of the [ASN]+ ligand in compound 1 at 293, 348 and 365 K
  293 K 348 K 365 K
C1–N1–C5–C6 −168.2(10) −109.3(17) −104.2(44)
C4–N1–C5–C6 83.3(11) 131.4(16) 137.2(41)
C1–N1–C8–C7 155.8(11) 132.4(16) 127.2(43)
C4–N1–C8–C7 −87.7(12) −108.2(17) −114.7(45)
C5–N1–C1–C2 −154.7(12) −131.8(16) −116.5(42)
C8–N1–C1–C2 81.7(14) 109.(17) 123.4(42)
C5–N1–C4–C3 150.5(11) 108.7(17) 96.4(42)
C8–N1–C4–C3 −86.7(12) −132.(16) −143.9(39)
C9–N2–C13–C14 61.2(19) 82.6(5) 120.4(7)
C12–N2–C13–C14 −157.6(13) −161.5(42) −124.4(7)
C9–N2–C16–C15 −81.2(14) −91.6(46) −145.9(64)
C12–N2–C16–C15 169.9(12) 147.9(42) 101.1(71)
C13–N2–C9–C10 109.1(15) 153.2(4) 164.3(65)
C16–N2–C9–C10 −142.7(12) −87.(43) −75.(74)
C13–N2–C12–C11 −121.2(16) −139.5(47) −161.4(66)
C16–N2–C12–C11 135.7(15) 107.6(48) 76.7(76)


The [CdBr4]2− anions of compound 1 in three phases adopt distorted tetrahedral geometries. Specifically, for RTP, ITP and HTP, the Cd–Br bond distances range from 2.578(15) to 2.594(14) Å, 2.574(8) to 2.601(7) Å and 2.567(9) to 2.635(9) Å, respectively, with the Br–Cd–Br bond angles varying in the respective ranges of 106.6(5)° to 112.9(5)°, 106.4(3)° to 114.2(3)°, and 102.6(5)° to 116.0(5)°. It is notable that the geometries of anions display the slightly deformations with the increase of temperature. In order to show more clearly about the conformational changes in [CdBr4]2− anions and spiro-rings of [ASN]+ cations, we overlap the asymmetric units of three phases in Fig. 3d. It is easy to find that the conformations of spirocyclic cations show distinct twisting motions with the occurrence of the phase transitions from RTP to HTP. The relative location of the asymmetric unit at HTP also exhibits the movement, which may originate from the transformation of the space group in HTP and the coordinate origin change accordingly.

The details and the packing structures of weak C–H⋯Br interactions in different phases are depicted in Table S1 and Fig. S4. In the RTP, four type weak C–H⋯Br hydrogen bonds are found among the [CdBr4]2− anions and the neighboring spiro-ammonium cationic rings. At ITP, five type weak C–H⋯Br hydrogen bonds are shown among the ions and the more hydrogen-bonding interactions result in the zig-zag one-dimensional chains of hydrogen-bond connections along the c axis. In contrast, the HTP presents more complicated hydrogen-bonding interactions to lead to the three-dimensional hydrogen-bond networks discovered in HTP. These obvious differences in the hydrogen bonds result from the distinct torsions of spirocyclic cations in different phases. For compound 1, the differences among the packing structures in the RTP, ITP and HTP are clearly represented in Fig. 4a, c and e. The simple schematic presentations about the positioning of partial Cd and N centers in compound 1 are showed in Fig. 4b, d and f to illustrate the relative location of the N and Cd atoms, with all of the C, H, and Br atoms omitted for clarity. As shown in the repeating crystal structure at RTP, the neighboring closest N1⋯N1a (7.7611 Å) and relatively distant N1⋯N1c (14.0490 Å) are notably shorter than those in the ITP (7.8910 and 14.3700 Å) and HTP (8.331 and 15.0900 Å), while the neighboring nearest N2⋯N2a (7.2826 Å) of RTP is slightly longer than that at HTP (6.0822 Å) (Fig. 4). The elongating of N1⋯N1g and N1⋯N1i distances in the HTP makes the N1–N1c–N1b angle in the RTP change from 83.848° to 91.879° (N1–N1i–N1h angle in the HTP) (Fig. 4b and f). In the RTP and ITP, four nearest-neighboring Cd atoms form an irregular quadrilateral with three different kinds of Cd⋯Cd distances ((10.3277, 9.9696 and 8.6575 Å) and (10.2429, 10.2221 and 8.9050 Å)), while in the HTP, four neighboring Cd atoms form a parallelogram with two distinct pairs of Cd⋯Cd distance (9.9541, 9.4152 Å) (Fig. 4b, d and f). From RTP to HTP, the species of symmetric elements change apparently, which may influence the packing view structures. The unit cell at HTP appears the inversion center and the mirror plane symmetry element parallel to the [010] plane, while in the RTP and ITP, it only exits 21 screw axis. The above detailed structural comparisons suggest that the relative locations of the N and Cd atoms undergo striking shift in the bc plane.


image file: c6ra14157a-f4.tif
Fig. 4 Crystal-packing views of compound 1 viewed along the a axis direction at (a) 293, (c) 348 and (e) 365 K. (b and d) Irregular quadrilateral void formed by four nearest-neighbor Cd atoms at 293 and 348 K. (f) Parallelogram void formed by four nearest-neighbor Cd atoms at 365 K.

In all, the conformational variations of the flexible spirocyclic cationic moieties and relative reorientations among both the ions are the main driving force of the distinct changes of hydrogen-bonding interactions and the generation of the successive phase transitions at 336 K and 357 K triggered by temperature.

SHG characterization of compound 1

Generally, SHG response is very susceptive to the transition from a noncentrosymmetric space group to a centrosymmetric space group because SHG signal exists only in nonlinear materials. For compound 1, the temperature-dependent SHG effect during the heating process is depicted in Fig. 5, to predict its potential application as NLO material. In this case, at RTP, compound 1 displays a SHG response which is 0.5 times that of potassium dihydrogen phosphate (KDP). With an increase in temperature, SHG shows an abrupt decrease at about T2. SHG intensity is almost zero above T2 (357 K), probably suggesting that compound 1 is centrosymmetric in HTP; while below T2, SHG intensity has a basic fixed value, suggesting that compound 1 is non-centrosymmetric in both ITP and RTP. That is, in the vicinity of T2, the SHG intensity decreases sharply from a high-intensity state below T2 to a low-intensity state above T2, manifesting the first-order phase transition. At the same time, the SHG signals of compound 1 arise in the whole measured temperature range from 300 to 375 K, in good coincident with the space group changes from P212121 to P21/c during the phase transition process. To sum up, the result of SHG measurement is in accordance with the single-crystal structures and DSC results, showing that compound 1 is an interesting potential NLO switch material.
image file: c6ra14157a-f5.tif
Fig. 5 SHG signals of compound 1 as a function of temperature.

Dielectric property of compound 1

Temperature-dependent dielectric constant displays obvious changes in the vicinity of the phase transition, which is well-know as a significant indicator for the structural phase transition in a compound. In view of the above-mentioned reversible phase transitions confirmed by the DSC, compound 1 is expected to undergo an interesting dielectric response triggered by temperature. The temperature-dependent dielectric permittivity of compound 1 was measured on powder-pressed pellet and the sample was pasted with carbon conducting glue. As shown in Fig. 6a, for compound 1 measured at 1 MHz, upon heating to T1, the dielectric constant at ITP is approximately 1.2 times that at RTP. The temperature-dependent ε′ shows a mild increase until the temperature gets to T2 of 357 K, and suddenly it displays a remarkable change followed by a plateau with a sharp increase from 8 at ITP to 15 at HTP around the T2. The value of ε′ in the high dielectric state (HTP) is approximately 1.87 times that in the intermediate dielectric state (ITP), demonstrating a notable step-like dielectric anomaly. Subsequently, the permittivity exhibits a plateau with a sudden decrease near 338 K upon cooling and a relatively large hysteresis of 19 K between heating and cooling processes. The heating and cooling runs display an approximate rectangular loop with a window of 19 K, similar to those of other known bistability, such as magnetic hysteresis loops in magnets and electric hysteresis loops in ferroelectrics. It exhibits switchable bistability in channel of dielectric property. It would be of great importance for theoretical research and potential applications in modern electrical fields. The bistability in dielectric constant is rare though the bistable magnetic susceptibility has been observed in many molecular systems. In addition, for compound 1, the curve of the temperature-dependent ε′ obtained in the cooling process matches well with that recorded during the heating mode, suggesting the emergence of reversible phase transitions. The temperature hysteresis phenomenon further confirms the first-order features of the phase transitions of compound 1, in good agreement with the DSC results mentioned above.
image file: c6ra14157a-f6.tif
Fig. 6 (a) Real parts (ε′) of the dielectric permittivity of compound 1 measured on a power sample in the heating–cooling cycles at 1 MHz. Inset: detailed plot of εversus temperature around T1. (b) Real part of the dielectric constant of compound 1 measured at different frequencies.

Just as the real part of the dielectric constant, the temperature dependence of the dielectric loss showed in Fig. S3 (ESI) also displays striking anomaly in the heating and cooling cycles, further demonstrating the reversible phase transitions. Such dielectric behaviors with a change of temperature relates to the motion or distortion of both the [ASN]+ cations and [CdBr4]2− anions. With an increase in temperature, thermal vibrations of the atoms become more intense; the positions of N and Cd atoms in the unit cells change apparently and the closest N⋯N and Cd⋯Cd distances are notably elongated or shortened. As a result, the thermally activated motions of both the ions lead to the dielectric anomalies. In general, for compound 1, the dielectric constants could be switched by the reversible phase transitions and tuned in three distinct dielectric states, indicating that compound 1 is an excellent promising candidate for the application of molecular switchable dielectrics.

Conclusions

In summary, we have described a novel phase transition compound of [ASN]2[CdBr4] with high-temperature switchable dielectric behavior and SHG response. 1 undergoes sequential reversible phase transitions at 336 and 357 K. With an increasing temperature, the space group of 1 changes to a centrosymmetric one. The phase transitions at both temperatures are attributable to the evident twisting motions of the flexible spirocyclic ammonium cations and the change of relative locations between the [ASN]+ cations and [CdBr4]2− anions. Interestingly, the conformation and position changes of cations and anions result in the hydrogen-bond interactions varying from 0D (RTP) to 1D (ITP), then to 3D (HTP). Obviously, the dielectric permittivity could be switched by the sequential phase transitions and tuned in three visible dielectric states, while the SHG effect could be only switched in the second phase transition, indicating potential switchable dielectric and NLO material. We believe that the present findings provide a new way for building the structural phase transition materials through selecting the flexible spiro-type quaternary ammonium salts.

Acknowledgements

This work was financially supported by the Project 973 (2014CB848800), National Natural Science Foundation of China (21471032) and the Fundamental Research Funds for the Central Universities.

Notes and references

  1. M. Salinga and M. Wuttig, Science, 2011, 332, 543 CrossRef CAS PubMed.
  2. D. Lencer, M. Salinga and M. Wuttig, Adv. Mater., 2011, 23, 2030 CrossRef CAS PubMed.
  3. M. Mączka, A. Pietraszko, B. Macalik and K. Hermanowicz, Inorg. Chem., 2014, 53, 787 CrossRef PubMed.
  4. Z.-H. Sun, Z.-H. Luo, J.-H. Chen, T.-L. Li, R.-G. Xiong, M.-L. Tong and M.-C. Hong, Adv. Funct. Mater., 2012, 22, 4855 CrossRef CAS.
  5. B. Champagne, A. Plaquet, J. L. Pozzo, V. Rodriguez and F. Castet, J. Am. Chem. Soc., 2012, 134, 8101 CrossRef CAS PubMed.
  6. T. Akutagawa, H. Koshinaka, D. Sato, S. Takeda, S. I. Noro, H. Takahashi, R. Kumai, Y. Tokura and T. Nakamura, Nat. Mater., 2009, 8, 342 CrossRef CAS PubMed.
  7. D. Lencer, M. Salinga and M. Wuttig, Adv. Mater., 2011, 23, 2030 CrossRef CAS PubMed.
  8. H.-Y. Ye, Y. Zhang, D.-W. Fu and R.-G. Xiong, Angew. Chem., Int. Ed., 2014, 53, 6724 CrossRef CAS PubMed.
  9. Q. Ye, P.-P. Shi, Z.-Q. Chen, T. Akutagawa, S. I. Noro and T. Nakamura, Eur. J. Inorg. Chem., 2012, 23, 3732 CrossRef.
  10. A. Coskun, M. Banaszak, R. D. Astumian, J. F. Stoddart and B. A. Grzybowski, Chem. Soc. Rev., 2012, 41, 19 RSC.
  11. D.-W. Fu, W. Zhang, H.-L. Cai, J.-Z. Ge, Y. Zhang and R.-G. Xiong, Adv. Mater., 2011, 23, 5658 CrossRef CAS PubMed.
  12. M. Irie, T. Fukaminato, T. Sasaki, N. Tamai and T. Kawai, Nature, 2002, 470, 759 CrossRef PubMed.
  13. P. Zhou, Z.-H. Sun, S.-Q. Zhang, C.-M. Ji, S.-G. Zhao, R.-G. Xiong and J.-H. Luo, J. Mater. Chem. C, 2014, 2, 2341 RSC.
  14. L. Boubekeur-Lecaque, B. J. Coe, J. A. Harris, M. Helliwell, I. Asselberghs, K. Clays, S. Foerier and T. Verbiest, Inorg. Chem., 2011, 50, 12886 CrossRef CAS PubMed.
  15. Y.-Y. Dan, H.-B. Lin, L.-Z. Chen, L. Zhang, J. Su, H.-J. Yue and X.-W. Cai, RSC Adv., 2015, 5, 98983 RSC.
  16. M. W. Gaultois, P. T. Barton, C. S. Birkel, L. M. Misch, E. E. Rodriguez, G. D. Stucky and R. J. Seshadri, Phys. Condens. Matter, 2013, 25, 186004 CrossRef PubMed.
  17. Y. Zhang, H.-Y. Ye, H.-L. Cai, D.-W. Fu, Q. Ye, W. Zhang, Q. Zhou, J. Wang, G.-L. Yuan and R.-G. Xiong, Adv. Mater., 2014, 26, 4515 CrossRef CAS PubMed.
  18. C.-M. Ji, Z.-H. Sun, S.-Q. Zhang, T.-L. Chen, P. Zhou and J.-H. Luo, J. Mater. Chem. C, 2014, 2, 567 RSC.
  19. A. Stroppa, A. P. Barone, P. Jain, J. M. Perez-Mato and S. Picozzi, Adv. Mater., 2013, 25, 2284 CrossRef CAS PubMed.
  20. S. Horiuchi, F. Kagawa, K. Hatahara, K. Kobayashi, R. Kumai, Y. Murakami and Y. Tokura, Nat. Commun., 2012, 3, 1308 CrossRef PubMed.
  21. S.-G. Li, J.-H. Luo, Z.-H. Sun, S.-Q. Zhang, L.-N. Li, X.-J. Shi and M.-C. Hong, Cryst. Growth Des., 2013, 13, 2675 CAS.
  22. X.-H. Zhao, X.-C. Huang, S.-L. Zhang, D. Shao, H.-Y. Wei and X.-Y. Wang, J. Am. Chem. Soc., 2013, 135, 16006 CrossRef CAS PubMed.
  23. H.-Y. Ye, S.-H. Li, Y. Zhang, L. Zhou, F. Deng and R.-G. Xiong, J. Am. Chem. Soc., 2014, 136, 10033 CrossRef CAS PubMed.
  24. Y. Zhang, H.-Y. Ye, D.-W. Fu and R.-G. Xiong, Angew. Chem., Int. Ed., 2014, 53, 2114 CrossRef PubMed.
  25. A. Daoud, J. Appl. Crystallogr., 1977, 10, 133 CrossRef.
  26. J. M. Perez-Mato, J. L. Manes, J. Fernandez, J. Zuniga, M. J. Tello, C. Socias and M. A. Arriandiaga, Phys. Status Solidi A, 1981, 68, 29 CrossRef CAS.
  27. B. Kundys, A. Lappas, M. Viret, V. Kapustianyk, V. Rudyk, S. Semak, C. Simon and I. Bakaimi, Phys. Rev. B: Condens. Matter Mater. Phys., 2010, 81, 224434 CrossRef.
  28. P.-P. Shi, Q. Ye, Q. Li, H.-T. Wang, D.-W. Fu, Y. Zhang and R.-G. Xiong, Chem. Mater., 2014, 26, 6042 CrossRef CAS.
  29. M. G. Marino and K. D. Kreuer, ChemSusChem, 2015, 8, 513 CrossRef CAS PubMed.
  30. Y. Nono, M. Kouzu, K. Takei, K. Chiba and Y. Sato, Electrochemistry, 2010, 78, 336 CrossRef CAS.
  31. K. Chiba, T. Ueda, Y. Yamaguchi, Y. Oki, F. Saiki and K. Naoi, J. Electrochem. Soc., 2011, 158, A1320 CrossRef CAS.
  32. J.-C. Gao, M. Yoshio, L. Qi and H.-Y. Wang, J. Power Sources, 2015, 278, 452 CrossRef CAS.
  33. P.-P. Shi, Q. Ye, Q. Li, H.-T. Wang, D.-W. Fu, Y. Zhang and R.-G. Xiong, Dalton Trans., 2015, 44, 8221 RSC.
  34. T. Hang, W. Zhang and R.-G. Xiong, Chem. Soc. Rev., 2010, 40, 3577 RSC.
  35. D.-W. Fu, H.-L. Cai, Y.-M. Liu, Q. Ye, W. Zhang, Y. Zhang, X.-Y. Chen, G. Giovannetti, M. Capone, J.-Y. Li and R.-G. Xiong, Science, 2013, 339, 425 CrossRef CAS PubMed.
  36. W. Zhang and R.-G. Xiong, Chem. Rev., 2012, 112, 1163 CrossRef CAS PubMed.
  37. N. Mercier, S. Poiroux, A. Riou and P. Batail, Inorg. Chem., 2004, 43, 8361 CrossRef CAS PubMed.
  38. Y.-Z. Tang, Y.-M. Yu, J.-B. Xiong, Y.-H. Tan and H.-R. Wen, J. Am. Chem. Soc., 2015, 137, 13345 CrossRef CAS PubMed.
  39. L.-Z. Chen, X.-X. Cao, D.-D. Huang and Q.-J. Pan, RSC Adv., 2015, 5, 55914 RSC.
  40. G.-X. Wang, Z. Xing, L.-Z. Chen and G.-F. Han, J. Organomet. Chem., 2015, 783, 17 CrossRef CAS.
  41. X.-J. Shi, J.-H. Luo, Z.-H. Sun, S.-G. Li, C.-M. Ji, L.-N. Li, L. Han, S.-Q. Zhang, D.-Q. Yuan and M.-C. Hong, Cryst. Growth Des., 2013, 13, 2081 CAS.
  42. U. Monkowius, S. Nogai and H. Schmidbaur, Z. Naturforsch., B: J. Chem. Sci., 2004, 59, 259 CAS.

Footnote

Electronic supplementary information (ESI) available: IR spectrum, PXRD patterns, dielectric loss of the dielectric permittivity, the hydrogen-bond geometry and parameters of the crystal structures. CCDC 1482615 at 293 K, 1482616 at 348 K and 1482617 at 365 K. For ESI and crystallographic data in CIF or other electronic format see DOI: 10.1039/c6ra14157a

This journal is © The Royal Society of Chemistry 2016
Click here to see how this site uses Cookies. View our privacy policy here.