DOI:
10.1039/C6RA14097A
(Paper)
RSC Adv., 2016,
6, 80679-80691
Gold nanorods vs. gold nanoparticles: application in electrochemical sensing of cytosine β-D-arabinoside using metal ion mediated molecularly imprinted polymer†
Received
31st May 2016
, Accepted 1st August 2016
First published on 15th August 2016
Abstract
The determination of an anticancer drug (cytosine arabinoside, Ara-C) in body fluids is very important due to its pharmaceutical and clinical significance. This drug is widely used for the treatment of cancer patients suffering from acute myeloid leukemia. In this study, a typical surface imprinting approach was adopted for the immobilization of imprinted nano film on a pencil graphite electrode decorated with gold nanorods/gold nano particles. For this, gold nanorods were attached first onto the electrode surface followed by their modification with a pre-polymer mixture. Herein, monomeric molecules (N-methacryloyl-L-cysteine) were coated via Au–S links on an electrode surface that had undergone metal ion mediated molecularly imprinted polymerization, in the presence of a template (Ara-C), crosslinker (ethylene glycol dimethacrylate) and initiator [2,2′-azobis(isobutyronitrile)]. Similar modification was carried out on a gold nanoparticles immobilized electrode for comparison, in terms of differential pulse anodic stripping voltammetric transduction and measurement sensitivity. An extended imprinting polymer (template-free) coating on the longitudinal surface of the gold nanorods was found to reveal higher electrode kinetics. This produced a better signal with enhanced detection sensitivity (k = 1.36 × 10⁻², linearity range = 1.00–126.71 ng mL−1, limit of detection = 0.19 ng mL−1) of the drug than those (k = 1.75 × 10⁻³, linearity range = 3.00–107.21 ng mL−1, limit of detection = 0.75 ng mL−1) realized with a gold nanoparticles decorated imprinted polymer layer compressed in spherical curved space. Consequently, the proposed gold nanorods-based imprinted sensor is adjudged to be better in helping to monitor a dose-dependent antiproliferative effect of a drug and its supplementation in chemotherapy.
1. Introduction
Cytosine arabinoside, or cytarabine (1-β-D-arabinofuranosylcytosine; Ara-C), a pyrimidine nucleoside analogue, is a drug of choice for the treatment of cancer patients suffering from acute myeloid leukemia (AML), chronic myeloid leukemia, acute lymphoid leukemia, and lymphomas.1,2 Ara-C (2.43–12.45 ng mL−1) is known to have a dose-dependent antiproliferative effect on AML cells, and in contrast to T cells it was found to have a significant effect even at 2.43 ng mL−1.3 Due to the severe toxicity of Ara-C, which varies with its concentration in the formulations, a comprehensive investigation is required to understand Ara-C efficacy and the toxic effect of different dosages at low, intermediate and high levels.4 This requires a simple and sensitive tool to monitor the entire concentration range over which the drug can be administered safely, in combination with other anticancer drugs (valproic and all-trans retinoic acid) to patients suffering from leukemia. Further, the quantitative detection of Ara-C in biological fluids (plasma and urine) might be challenging due to the required sensitivity, its instability and the presence of an isobaric endogenous compound, cytidine.5,6 Several analytical methods, such as high performance liquid chromatography (HPLC),2,6–8 ultraviolet spectrophotometry (UV),9 liquid chromatography/tandem mass spectrometry (LC-MS),5,10,11 chemiluminescence (CL),4 and electroanalysis,12,13 have been reported for the analysis of Ara-C. Whereas HPLC, LC-MS and CL methods could be cumbersome, involving sample pre-treatment steps, UV and electroanalytical methods lack both selectivity and sensitivity. Alternatively, we have resorted for the first time to adopting imprinting technology for the analysis of Ara-C. Molecularly imprinted polymers (MIPs) have been a burgeoning technology in performing highly selective and sensitive analysis. Simply put, MIPs are crosslinked synthetic polymeric receptors, a “plastic antibody”, made with the signature (templating) of analyte via self-assembly of functional monomer(s) and template, in the presence of a crosslinker in a polymerizing medium (porogen). The removal of template molecules from the polymer adduct creates binding cavities responsible for selective molecular recognition. The MIPs possess several advantages over their biological counterparts, including low cost, ease of preparation, storage stability, repeated operations without loss of activity, high mechanical strength, durability to heat and pressure, and applicability in harsh chemical media. To the best of our knowledge, an attempt has not yet been made to use MIPs for the analysis of Ara-C.
A metal-ion mediated imprinting approach for synthesizing MIPs as complex-template imprinted systems has been paid due attention, owing to their water-compatibility and wide applicability in catalysis,14 separation,15 recognition,16 and sensors.17,18 Metal ion coordination with the template plays an important role as an assembling pivot for the molecular architecture in the development of biological recognition systems. Since many pharmaceutics demonstrate biological activities when present in the form of metal complexes, such recognition systems have special significance as biocompatible materials. Furthermore, unlike traditional MIPs, metal ion mediated imprinting might impart more stability to the system in water and protic solvents, owing to inherent covalent co-ordinations. MIPs, which involve a metal ion directly incorporated into their backbone, are known to have a great influence on the conducting property of the film.19 Such a system is three-dimensional in the presence of a metal [e.g. Cu(II) showing octahedral geometry] that might exhibit a wide range of physical and electronic properties of n-type semi-conductors. This may produce a typical hopping mechanism to induce electro-conductivity in the film. Electrochemical analysis is a simple and convenient method that can provide interesting advantages for analyte determination. However, in order to achieve ultimate sensitivity by an advanced electrochemical technique such as differential pulse voltammetry (DPV), a reasonably good electroactivity of the MIP film on the electrode surface is necessary. For instance, a couple of novel molecularly imprinted voltammetric sensors have recently been reported, in which the glassy carbon electrodes were modified with platinum nanoparticles, involved in polyoxometalate functionalized MWCNTs and reduced graphene oxide sheets, to improve catalytic, conductive, and mass transport.20,21 In addition, selective memories have also been generated on piezoelectric electrode systems by using MIPs based on a metal-chelate pre-organized monomer.22,23 Since Ara-C is an electro-active compound, its electrochemical sensing would be more convenient than the exhaustive piezoelectric micro-gravimetry. However, the electrochemical response of Ara-C might be too poor to guarantee its ultra-trace determination, even by DPV transduction, owing to the inherent insulating character of MIP film. We have thus resolved this issue by developing a metal ion mediated MIP film directly over the surface of a pencil graphite electrode (PGE). In fact, the complexation of Cu(II) ion with monomer and template (Ara-C) constituted a typical coordination system which could serve as an ‘organic-metal’ to induce electronic effects in terms of redox activation.24
With the advent of nanotechnology, MIPs can be manoeuvred to yield favourable conditions for the efficient electron-exchange between the modified electrode and the target analyte to improve sensitivity.25–27 One-dimensional nanostructures such as nanorods, nanowires, and nanotubes are known to display direct and fast electron transport.28,29 In the recent past, using nanotechnology in the fabrication of sensors has inspired typical applications of different shapes of gold nanoparticles, such as nanospheres, nanoshells, nanocages, and nanorods.30–34 However, gold nanorods (AuNRs) are found to be rather exciting for electrochemical sensing of biomolecules, owing to their relatively high surface area with efficient mass transport characteristics and favourable biocompatibility.35 Since AuNRs have a strong binding affinity to thiol-containing monomers, this makes them efficient in binding the immobilized film for better diagnostic applications.30,32 The colloidal stability of AuNRs dispersion in water could be maintained by functionalization and subsequent covering of individual nanorods with an MIP (3D) film of controlled thickness.36 It is known that the shape of polymer films on gold interfaces is highly influenced by the curvature of the surface. As a matter of fact, gold nanoparticles (AuNPs) have higher curvature than AuNRs with longitudinal surfaces.37 Such differences may alter the coating thickness on these surfaces, resulting in a relatively compressed polymeric layer with higher packing density of AuNPs–MIP composite compared with the extended brush-like MIP layer on AuNRs. As a consequence, the latter might exert a relatively higher contribution toward electrode kinetics, because one may anticipate a thorough diffusion of analyte from top to bottom in between two proximate bristles for rebinding in MIP cavities. Therefore, this work is based on the hypothesis that sensing performance can potentially be influenced by the morphologies of Au nanocrystals. To test this hypothesis, two types of Au nanocrystals, AuNPs and AuNRs, were used for the comparative study. Accordingly, we are reporting for the first time, an AuNRs decorated complex imprinted polymer (CIP) modified pencil graphite electrode (CIP@AuNRs/PGE) for comparison with CIP@AuNPs/PGE. It may be noted that only two examples are reported in the literature and these used gold nanorods coupled to MIPs with surface enhanced Raman scattering (SERS) transduction.36,38 Surprisingly, no AuNRs based MIP using electrochemical detection has, hitherto, been known.
2. Experimental
2.1 Reagents
All chemicals were of analytical reagent grade, and used without further purification. Demineralized triple distilled water (conducting range 0.06–0.07 × 10⁻⁶ S cm−1) was used throughout the experiment. Methacryloyl chloride (MC), chloroauricacid (HAuCl4·H2O), 2-2′-azobis (isobutyronitrile) (AIBN), sodium borohydride (NaBH4, 97%), cetyltrimethyl ammonium bromide (CTAB, 98%), ascorbic acid (AA, 99.5%), potassium carbonate (99%), sodium nitrite (97%) and L-cysteine hydrochloride monohydrate (Cys) were purchased from Loba Chemie (Mumbai, India) and Spectrochem Pvt. Ltd. (Mumbai, India). Copper sulphate, zinc sulphate, nickel sulphate, silver nitrate (AgNO3) and ethylene diamine tetraacetic acid disodium salt (EDTA) were purchased from E-Merck Ltd. (Mumbai, India). Authentic drugs, Ara-C, and tri-sodium citrate were purchased from Sigma-Aldrich (Steinheim, Germany). Interferent(s) were obtained either from Sigma-Aldrich (Steinheim, Germany) or Fluka (Steinheim, Germany). Phosphate buffer solution (pH 7.2, ionic strength 0.05 M) was used as a supporting electrolyte. The pH values of solutions were adjusted by the addition of a few drops of either 0.1 M HCl or 0.1 M NaOH. A standard stock solution of Ara-C (500.0 μg mL−1) was prepared using water. All working solutions were prepared by diluting stock solution with water. The pharmaceutical sample, Ara-C injection (Cytarapar, labelled as 100 mg mL−1), was purchased from Parenteral drugs (India) Ltd. (Indore, India). Human blood plasma and urine samples were obtained from the Institute of Medical Science, Banaras Hindu University (Varanasi, India) and kept in a refrigerator at −4 °C, before use.
2.2 Apparatus
Differential pulse anodic stripping voltammetry (DPASV) and cyclic voltammetry (CV) were carried out with a portable potentiostat μ-Stat 200 (Drop Sens S.L. Oviedo, Spain). This was connected via USB connection to a computer installed with the measurement software Drop View (Drop Sens). Chronocoulometry was performed with an electrochemical analyzer [CH instruments, USA, model 1200A]. All experiments were performed using a three-electrode cell assembly consisting of modified PGE, platinum wire, and Ag/AgCl (3.0 M KCl) as working, counter, and reference electrodes, respectively. For Fourier transform infra-red (FT-IR) (KBr) spectral analysis, the coated film was scraped out gently from the surfaces of the modified electrodes. This was mixed with KBr pellets in a dye to form a disc and then subjected to spectral recording using Varian 3100 FTIR (USA). Morphologies of modified and unmodified AuNPs/AuNRs were examined by Tunnelling Electron Microscope (TEM) (Technai-12FEI, Eindhoven, Netherlands). Atomic force microscopy (AFM) using a NT-MDT Microscope (NT-MDT Co., Moscow, Russia) was studied in the semi contact mode. All experiments were carried out at room temperature. For the modification of the PGE surface with AuNPs/AuNRs and then afterwards with the pre-polymer mixture, an indigenous spin-coater SCU-2008C (Apex Instruments Co., Kolkata, India) was used. UV-vis analysis was performed on a PerkinElmer UV-vis spectrometer [model-LAMBDA 25, Beaconsfield (UK)]. Thermo-gravimetric analysis (TGA) of CIP-adduct and CIP was carried out with PerkinElmer-STA 6000 (Waltham, USA) equipment.
2.3 Synthesis of monomer [N-methacryloyl-L-cysteine (MAC)]
The monomer, MAC, was prepared and characterized as described elsewhere.39 In brief, Cys (5.0 g, 0.028 mol) and sodium nitrite (0.2 g, 0.028 mol) were dissolved in 30.0 mL potassium carbonate solution (5% v/v) and ice cooled to 0 °C. To this solution, MC (4.0 mL, 0.04 mol) was added drop-wise with vigorous stirring for 2 h. The monomer was extracted with ethyl acetate in neutral condition (pH 7.0).
2.4 Synthesis of gold nanocrystals
2.4.1 Preparation of AuNPs. AuNPs were prepared as cited in the literature.40 In brief, 2.5 mL of 1% tri-sodiumcitrate was added to 100.0 mL of boiling 0.01% HAuCl4 solution. This resulted in a suspension of AuNPs (stored in the dark at 4 °C) with an average size (17 ± 1.2 nm), as revealed by TEM analysis.
2.4.2 Preparation of AuNRs. AuNRs were synthesised following a known recipe.41 In short, a seed solution was first prepared by adding an ice-cold NaBH4 solution into a mixture of HAuCl4 and CTAB aqueous solution. Later this solution was added into a growth solution (prepared by adding AA into the mixture of CTAB with AgNO3 and HAuCl4 solution). It should be pointed out that in normal pH conditions, the addition of AA to a solution containing Au3+ ions and CTAB leads to the reduction of the Au ion from +3 to 0 oxidation state during the formation of an unagglomerated gold cluster (seed particles) which initiates the growth of nanorods. Herein, the formation of a CTA+AgBr2− complex, as evinced by a colour change from colourless to brown upon addition of AgNO3, may be speculated upon. The role of AgNO3 is to induce the nucleation process and to generate the rod shape of the derived aspect ratio.42–44 The AuNRs so obtained had an average length of 46.6 nm per width of 20 nm (aspect ratio 2.33). We have deliberately prepared AuNRs with an aspect ratio 2.33 by controlling the amount of AgNO3, because such gold nanorods are reportedly known to have improved electrodics.41
2.5 Sensor fabrication
A pencil rod (2B, 2 mm) was first pre-treated with 6 M HNO3 for 15 min. This was washed with water, and dried and smoothed with soft cotton, before insertion into a Teflon tube. The tip of the pencil rod at one end was gently rubbed with an emery paper (no. 400) to level the pencil surface along the tube orifice. Electrical contact was made by soldering a metallic wire to the exposed reverse side of the pencil rod. The PGE is known to be advantageous compared to other noble metal (Au, Ag, Pt, Pd, etc.) electrodes in terms of acquiring a wide potential window and lower background current.45
The electrode modification with CIP@AuNPs/AuNRs composite was carried out in the following two successive steps:
2.5.1 Attachment of AuNRs to the PGE surface. PGE was initially modified by dip coating in an AuNRs suspension for an optimized time of 12 h to obtain an AuNRs-decorated electrode surface.
2.5.2 Surface imprinting. A schematic protocol for the fabrication of CIP-modified AuNRs/PGE is shown in Scheme 1. This involved in particular the “grafting from” approach for the immobilization of CIP onto the AuNRs-decorated PGE surface. Accordingly, a 0.05 mmol template (Ara-C) and 0.05 mmol of metal ion (Cu2+), each dissolved in 1.0 mL DMSO, were mixed together by shaking for 1 h at room temperature to form a stable complex (1
:
1). Afterwards, the monomer (MAC, 0.1 mmol/1 mL DMSO) and cross-linker (EGDMA, 1.0 mmol, 188.0 μL) in the presence of AIBN (5 mg in 200 μL DMSO) were added to this complex solution and mixed well to obtain a homogeneous pre-polymer solution. The whole content was deoxygenated with nitrogen for 10 min. Finally, 20 μL of this pre-polymer mixture was spin coated onto the AuNRs/PGE surface for 15 s at 2600 rpm, followed by free radical polymerization at 70 °C for 3 h. Since the polymeric film@nanorods composite was coated on the exposed PGE tip which had been levelled along the orifice of the Teflon tube, there was no extraneous residue hanging around the electrode surface. The template (Ara-C) molecules were extracted from the CIP-adduct by washing the electrode with 0.1 M HCl (0.5 mL) for 30 min. This eventually resulted in a CIP@AuNRs/PGE working electrode. The complete removal of the template was ensured, until no DPASV response was observed.
 |
| Scheme 1 Schematic protocol for the fabrication of CIP@AuNRs/PGE. | |
The CIP-modified electrodes were also fabricated in the presence of either Zn(II) or Ni(II) metal ions, in lieu of Cu(II). Similarly, ion imprinted polymer (IIP), Ara-C-imprinted polymer (Ara-C-IP), and non-imprinted polymer (NIP)-modified AuNRs/PGEs were fabricated for comparison. For IIP, only Cu(II) and for Ara-C-IP, only Ara-C were exclusively used as a template; whereas NIP was prepared in the absence of a template. To understand the efficacy of AuNRs over AuNPs, CIP@AuNPs/PGE was also obtained by following the identical method used for the fabrication of CIP@AuNRs-based PGE. Note that Cu(II) ions could be extracted from the IIP-adduct electrode by treatment with 0.1 M EDTA (0.5 mL) for 60 min.
2.6 Voltammetric procedure
For the electrochemical measurement, the test analyte was first accumulated by stirring for 90 s (accumulation time, tacc) at +0.1 V (accumulation potential, Eacc) vs. Ag/AgCl. After 15 s equilibration time, DPASV runs were scanned from −0.4 to +0.6 V vs. Ag/AgCl, using a pulse amplitude of 25 mV, pulse width of 50 ms, and scan rate of 10 mV s−1. CV runs were also recorded in the potential window −0.3 to +0.2 V at different scan rates (20–200 mV s−1) in anodic stripping mode. Since oxygen did not influence the anodic stripping, any deaeration of the cell content was not required. All DPASV runs for each concentration of the test analyte were quantified using the method of standard addition. The limit of detection (LOD) was calculated as three times the standard deviation of the blank measurement (in the absence of analyte) divided by the slope of the calibration plot between Ara-C concentration and DPASV current.46 Voltammetric measurements were also performed using the NIP-modified PGE, under identical operating conditions. All experiments were carried out at room temperature (25 ± 1 °C). All operating conditions used for voltammetric measurements were duly optimized, as discussed in ESI† (Section S1 and Fig. S1, ESI†).
2.7 Batch binding study
To evaluate the analyte binding capacity of CIP@AuNRs/AuNPs, separate batch binding experiments were performed. For this, 5.0 mg of CIP–AuNRs/AuNPs or NIP–AuNRs/AuNPs composite was added to Ara-C solutions (10 mL) in a varying concentration range (20–150.0 ng mL−1) and analyte adsorption allowed for 10 h, under dynamic conditions. The CIP composite saturated with analyte was separated out from the solution via centrifugation. The remaining (unbound) analyte in the aqueous solution was determined by UV-vis at 272 nm. The equilibrium binding amount of Ara-C [adsorption capacity (Q)] was calculated according to the equation:47 |
 | (1) |
where C0 and Ce (ng mL−1) are initial and equilibrium concentrations of the analyte, respectively, V (mL) is the volume of the initial solution, and W (g) is the weight of respective CIP@AuNRs/AuNPs composites.
3. Results and discussion
3.1 Electrodics of gold nanocrystals
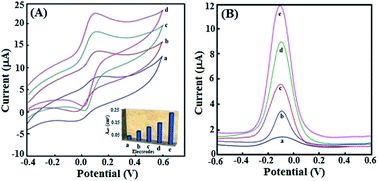
In order to comprehend the effect of gold nanocrystal morphology (AuNPs vis-a-vis AuNRs) on the electron-transferrability between the nanocrystals and the PGEs, one may attribute the differences not only to the different shapes of the nanocrystals but also to their different oxidation states. It is reported that the surface of gold nanorods may be partially oxidized to form Au+ and Au3+ on exposure to air, whereas AuNPs retain an Au0 oxidation state. The oxide of Au may serve as a mediator, facilitating an enhanced electrocatalytic ability toward the oxidation of the target analyte.48 Further, the AuNRs decorated PGE may have better electronic continuity because of the smaller number of interfacial boundaries between the nanorods, in comparison to spherical nanoparticles with a higher number of interfacial boundaries.49 Consequently, the electron-transfer rate on PGE modified with AuNRs might be higher compared to the PGE modified with AuNPs. This was evinced from the fact that the AuNPs/PGE showed a smaller CV anodic current of quasi-reversible nature with a higher peak separation (ΔEp = 120 mV) than that obtained with AuNRs/PGE (ΔEp = 70 mV), using an [Fe(CN)6]3−/4− (0.1 mM) probe at a scan rate (ν) 20 mV s−1 (Fig. 1A, curves a and c). One may attribute this to the slightly higher electrochemical surface area (Aeff) of AuNRs (Aeff = 11.6 × 10⁻² cm2) compared with AuNPs (Aeff = 8.4 × 10⁻² cm2), as calculated by applying the Randles–Sevcik equation.50 Electrochemical surface areas of different electrodes (bare PGE, AuNPs/PGE, CIP@AuNPs/PGE, AuNRs/PGE and CIP@AuNRs/PGE) are presented in Fig. 1A (inset) for comparison. Accordingly, Fig. 1B shows an increased DPASV response (curve e), with AuNRs/PGE having the highest Aeff in comparison to other electrodes. Thus, AuNRs based PGE has an edge in terms of electrodics, over all types of electrodes studied. Apparently, upon modification with CIP, AuNRs/PGE has the highest effective surface area (24.61 × 10⁻² cm2) (Fig. 1A, inset) which is approximately twice that (14.21 × 10⁻² cm2) of CIP@AuNPs/PGE. This tempted us to prefer CIP@AuNRs/PGE for highly sensitive analysis of Ara-C, in aqueous and real samples.
 |
| Fig. 1 (A) CV response for [Fe(CN)6]3−/4− probe: (a) AuNPs, (b) CIP@AuNPs, (c) AuNRs and (d) CIP@AuNRs modified PGEs with their Aeff values (inset). (B) DPASV response for [Fe(CN)6]3−/4− probe at (a) bare, (b) AuNPs, (c) CIP@AuNPs, (d) AuNRs and (e) CIP@AuNRs modified PGEs. | |
3.2 Role of metal ion in imprinting
Different metal ions (Cu(II), Zn, and Ni) were examined for complexation with Ara-C. Stability constants (β) of these complexes were calculated as supplied in the ESI (Section S2, ESI†). Accordingly, a higher β value (0.194) was obtained when Cu(II) was taken as a mediating ion; β values with Ni(II) and Zn(II) were found to be 0.035 and 0.051, respectively. Therefore, Cu(II) was the most appropriate metal for complexation in this work. The Cu(II) complexation with Ara-C might involve bindings to N(3) and O(2) groups in the chelate plane, in accordance with the mechanism reported for Cu(II) complexation with cytidine of similar structure.51 The imprinting of a “complex-template” in cooperation with the monomer (MAC) is depicted in Scheme 1. Both constituents [Cu(II) and Ara-C] of “complex-templates” are likely to affect the performance of the imprinted layer. This is evident from Table 1. Accordingly, CIP@AuNRs/PGE exclusively responded to Ara-C, whereas other modified PGEs, such as IIP@AuNRs/PGE, Ara-C-IP@AuNRs/PGE, and NIP@AuNRs@/PGE, were found to be unresponsive to Ara-C. This revealed that the presence of Cu(II) was inevitable in inducing electroactivity in the Ara-C, as described in Section 3.5.
Table 1 Role of Cu(II) ion in Ara-C determination
Electrode type |
Monomer amount (mmol) |
Ara-C amount (mmol) |
Cu amount (mmol) |
EGDMA amount (mmol) |
DPASV response (μA) |
After spiking Ara-C (25 ng mL−1) |
After spiking Cu(II) (25 ng mL−1) |
CIP@AuNRs/PGE (Cu–Ara-C imprinted) |
0.1 |
0.05 |
0.05 |
1.0 |
8.5 |
— |
IIP@AuNRs/PGE (Cu-imprinted) |
0.1 |
— |
0.05 |
1.0 |
— |
10.5 |
Ara-C-IP@AuNRs/PGE (Ara-C imprinted) |
0.1 |
0.05 |
— |
1.0 |
— |
— |
NIP@AuNRs/PGE (in absence of template) |
0.1 |
— |
— |
1.0 |
— |
— |
3.3 Spectral characterization
3.3.1 Spectroscopic evidence on the stoichiometry of complex-template [Cu(II)–Ara-C] and monomer complexation. The stoichiometry of the “complex-template” [Cu(II)–Ara-C] was determined by Job's method of continuous variation.52 For continuously varied individual molar concentrations of Cu(II) and Ara-C as well as for their mixed solutions with a total molar concentration, say 0.1 mmol, different UV spectra were recorded (Fig. S2A, ESI†). Accordingly, with decreasing molar concentration of CuSO4 and increasing Ara-C, the intensity in maximum absorbance at 600 nm was found to increase gradually until an optimum absorption intensity, at a molar ratio of CuSO4 (0.05 mmol) to Ara-C (0.05 mmol) equal to 1
:
1, was attained. Thereafter, it started decreasing with a further decrease in CuSO4 and an increase in Ara-C concentration. Absorbance values of various solutions, as measured at 600 nm, were corrected for the CuSO4 absorbance (assuming no complexation). The corrected absorbance values, ΔAmeas, were then plotted against the mole fraction of CuSO4 (Fig. S2B, ESI†). The resulting Job's plot exhibited a maximum at a CuSO4 mole fraction equal to 0.05. This corresponds to the formation of a stable complex between Cu(II) and Ara-C, with the molar composition equal to 1
:
1.Stoichiometry of the CIP-template adduct was also ascertained by UV-vis spectroscopy. The titration of the complex metal [Cu(II)–Ara-C] solution with the standard MAC solution revealed an optimum absorbance at 620 nm, where the Cu(II)–Ara-C–MAC ratio was 1
:
1
:
2. Herein, complexation with MAC was evident in a red shift of 20 nm (Fig. S2C, ESI†). The suggested geometrical arrangement of polymerizable complex [Cu(II)–Ara-C–MAC, (1
:
1
:
2)] is shown in Scheme 1. Since Cu has octahedral geometry, its two coordination sites can be occupied by one molecule of Ara-C via N(3) and O(2) bindings; while the other four coordination sites could be complexed with two discrete molecules of MAC involving their N and C
O functionalities. Note that the proposed geometry (1
:
1
:
2) is an optimum composition to obtain the stabilized complexation, because this may get destabilized under steric compression, if the monomer amount is exceeded in the complex, say 1
:
1
:
3 and beyond (Fig. S2C, ESI†).
After CIP-template adduct formation in the optimized pre-polymer mixture (1
:
1
:
2), template molecules were retrieved. The resulting CIP network was crosslinked using EGDMA so as to stabilize the molecular cavities generated. Other parameters such as crosslinker amount (1.0 mmol), polymerization time (3 h), and polymerization temperature (70 °C) were also optimized (Section S3, ESI†).
3.3.2 UV-vis and FT-IR spectra of imprinted AuNPs/AuNRs. UV-vis absorption spectroscopy is a useful tool to examine CIP modification on the respective surfaces of AuNPs and AuNRs. The MAC-Cys may have a strong effect on the UV-vis spectrum of AuNPs.53 The colloidal AuNPs normally absorb at λmax at about 528 nm.54 However, the height of this peak was found to be decreased after combination of AuNPs with MAC, for polymer growth. This was reflected by a change in colour from red to blue, accompanied by the emergence of an additional broad peak at ∼700 nm (Fig. 2A), due to an inherent effect of the anisotropic optical behaviour of AuNPs aggregates.53 On the other hand, AuNRs reportedly have two distinct localized surface plasmon resonance bands at 534 nm and 726 nm (Fig. 2D) due to the transverse electronic oscillation and longitudinal oscillation of electrons, respectively.49 The development of CIP-adduct@AuNRs revealed very small red-shifts of 3 nm in the transverse peak and 10 nm in the longitudinal sharp peak. One may attribute these red-shifts to be a consequence of changes in the surface refractive index, upon the modification of the thiol-containing polymeric film all along the surface of the nanorods.55
 |
| Fig. 2 (A) UV-vis spectra of AuNPs and CIP modified AuNPs; (B) TEM image of AuNPs, (C) TEM image of CIP modified AuNPs. (D) UV-vis spectra of AuNRs and CIP modified AuNRs; (E) TEM image of AuNRs, and (F) TEM image of CIP modified AuNRs. | |
FT-IR spectra (Fig. S3, ESI†) of monomer, template, CIP-adduct, and CIP are compared to support the suggested mechanism of analyte recapture. After immobilization of the CIP-adduct on the AuNPs/AuNRs modified PGE surface, the MAC S–H stretching vibration has disappeared, owing to Au–S linkages between the modified PGEs and the monomer. In addition, the C–S stretching band (675 cm−1) of MAC is also downward shifted to 630 cm−1 (Fig. S3A and C, ESI†). The major adsorption bands of Ara-C [superimposed OH–NH, 3265 cm−1; C2 (O), 1725 cm−1; and C
N stretch, 1560 cm−1, Fig. S3B, ESI†] are found to be shifted downward to 3213, 1712 and 1520 cm−1, respectively, after complexation with Cu(II) (Fig. S3C, ESI†). These peaks apparently disappeared after extraction of Ara-C from the CIP-adduct (Fig. S3D, ESI†). However, bands corresponding to the monomer [C
O stretch 1733 cm−1; amide I band 1647 cm−1; and amide II band 1620 cm−1] also shifted simultaneously to 1712, 1618 and 1570 cm−1, upon complexation with a Cu(II) ion. Interestingly, these bands remained unaltered even after template extraction. This supports the presence of Cu(II) in the CIP network, while Ara-C molecules were totally extracted. The template extraction efficacy was also confirmed by recording a UV-vis spectrum of the extract (collected after 30 min). This showed an exclusive peak at 272 nm corresponding to Ara-C; no peak corresponding to the Cu(II)–Ara-C complex at 600 nm is observed in the extract (Fig. S4, ESI†). This supported the fact that Cu(II) remained intact in the CIP motif, while template (Ara-C) molecules were removed from the polymer motif.
3.4 Surface morphology
According to TEM analysis of AuNPs, an average particle size distribution was measured (using Soft Visio Image software) within 22 nm, with a maximum at 16–17 nm (Fig. 2B, inset). On the other hand, AuNRs were found to have an optimum aspect ratio (length/diameter) of approximately 2.3 (Fig. 2E, inset). The CIP film coatings on the surfaces of AuNPs and AuNRs had thicknesses of 6 nm and 10 nm, respectively (Fig. 2C and F). Additional energy dispersive spectra (EDS) analysis was carried out to substantiate the presence of Cu(II) for the metal-mediated CIP growth on CIP@AuNPs/AuNRs modified PGEs. The EDS detects X-rays from the sample and provides useful information about the elemental distribution by elemental mapping of each component present in the polymer motifs (Fig. 3A and B). The exclusive presence of Cu(II) both in CIP-adduct and CIP indicates that only Ara-C molecules are extracted from the “complex-metal” in the polymer network.
 |
| Fig. 3 EDS images: (A) CIP-adduct@AuNRs and (B) CIP@AuNRs modified PGEs. AFM images: (C) CIP@AuNPs and (D) CIP@AuNRs modified PGEs. | |
AFM (two-dimensional) images for CIP@AuNPs/PGE (Fig. 3C) and CIP@AuNRs/PGE (Fig. 3D) revealed spherical particles and nanorods, respectively. Accordingly, CIP@AuNPs has shown a surface height of 63.6 nm (Rz), root mean square roughness of 5.3 nm (Rq) and arithmetic mean roughness of 3.8 nm (Ra). CIP@AuNRs/PGE has Rz, Rq and Ra values of 95.5, 6.8 and 4.6 nm, respectively. The distinctive Rz value with enhanced surface-height of the CIP@AuNRs composite may be attributed to the vertical tethering of modified nanorods, assuming a “brush-like” feature at the electrode surface. The respective thicknesses of CIP films on both AuNPs/PGE and AuNRs/PGE can be calculated using the following equation:56
|
z(x, y) = s(x, y) + t + Δz(x, y)
| (2) |
where
z(
x,
y) is the modified surface-height,
s(
x,
y) is the surface-height (14.8 nm) known for the bare PGE,
57 t is the average thickness, and Δ
z(
x,
y) is the inherent roughness (
Rq) of the CIP film. Accordingly, the mean thickness (
t) of the CIP film coated on AuNPs and AuNRs decorated PGEs could be calculated as 43.5 and 74.0 nm, respectively. Note that the method of ellipsometry iterated with transmittance is not well-suited in the present instance to determine the film thickness, because of the presence of absorbing species like
L-cysteine in the polymer motif. Spontaneity of linear adsorption of analyte in CIP cavities is found to be in agreement with the Langmuir adsorption isotherm, which suggests a Gibbs free energy change of −38.68 kJ mol
−1. For details on the Langmuir binding isotherm, see Section S4, ESI.
†
3.5 Cyclic voltammetry
Fig. 4A shows the CV runs of Ara-C (35.0 ng mL−1) on CIP@AuNPs and CIP@AuNRs/PGEs. These runs were recorded after analyte accumulation for 90 s, in the potential range −0.30 to +0.20 V with respect to Ag/AgCl at pH 7.2 and scan rates of 20 mV s−1, in the anodic stripping mode (CV runs at various scan rates of 20–200 mV s−1 are shown only for CIP@AuNRs/PGE). Interestingly, Ara-C revealed an irreversible anodic oxidation peak at −0.08 V vs. Ag/AgCl, notwithstanding the fact that Ara-C is electro-inactive in water. Thus, it might be surmised that Ara-C after complexing with Cu(II) turned electro-active, on account of the possible inhibition of tautomerization (H2N–C
N– ↔ HN
C–NH) in its six-membered ring. Herein, the tautomerization inhibition was facilitated by the charge-transfer complexation of a Cu(II) ion with N(3) and O(2) (tautomerization in the six-membered ring imparts electro-inactivity to Ara-C). In fact, a typical donor–accepter charge-transfer complex was formed, which behaved as electrochemically active in water.24,58 As can be seen in Fig. 4A, the observed anodic peak is shifted positively with increasing scan rate. This might be due to the fact that high energy is required for the oxidation of analyte in a relatively short time, at higher scan rates. The electrode process involved can tentatively be suggested as below:
 |
| Fig. 4 (A) CV response at CIP@AuNRs/PGE for Ara-C (35.0 ng mL−1) at different scan rates: (a) 20, (b) 50, (c) 100 and (d) 200 mV s−1 and CV at CIP@AuNPs/PGE for Ara-C (35.0 ng mL−1) at 20 mV s−1 (inset). (B) DPASV response in absence of Ara-C (curve a) at CIP@AuNRs/PGE and in presence of Ara-C (curves b–d) at NIP@AuNRs (50.0 ng mL−1), CIP@AuNPs (25.0 ng mL−1) and CIP@AuNRs (25.0 ng mL−1) modified PGEs, respectively. Inset figure shows reproducibility of CIP@AuNRs/PGE at different intervals of days. (C) DPASV response at NIP@AuNRs/PGE for Ara-C (75.45 ng mL−1) in blood plasma, (curve a), urine (curve d), and in pharmaceutical (curve g) samples. DPASV response at CIP@AuNRs/PGE in blood plasma (curve b and c), urine (curves e and f) and in pharmaceutics (curve h and i) duly spiked with 37.46 and 75.45 ng mL−1 Ara-C, respectively. | |
The radical so produced as an oxidation product apparently gets stabilized through the electronic transition, under the electron-withdrawing effect of the metal ion.59 The electro-oxidation of Ara-C was found to be negatively shifted with increasing pH (2.1–11.5), in accordance with the linear equation, Ep (V) = (−0.058 ± 0.005)pH + (0.551 ± 0.042) (R2 = 0.97). The slope, −0.058 mV per pH, of the linear curve suggests the involvement of 1e− and 1H+ for the oxidation. CV runs showed linear relationships between peak current (Ip) and square root of the scan rate (ν1/2) as well as between peak potential (Ep) and ln
ν (for CIP@AuNRs/PGE):
|
Ip (μA) = (34.0164 ± 4.0852)ν1/2 + (1.2364 ± 1.2424), R2 = 0.97
| (3) |
|
Ep (V) = (0.0444 ± 0.0034)ln ν + (0.0901 ± 0.0098), R2 = 0.99
| (4) |
This supported the idea that the anodic stripping is a diffusion-controlled process. The higher electrokinetic contribution from the brush-like AuNRs surface (vis-à-vis the AuNPs surface) could be supported with the estimation of heterogeneous electron transfer rate constants (k). The k values are observed to be 1.75 × 10⁻³ and 1.36 × 10⁻² cm s−1 at CIP@AuNPs/PGE and CIP@AuNRs/PGE, respectively (for details, see Section S5, ESI†). The approximately 10-fold greater k with CIP@AuNRs/PGE may be attributed to the higher diffusivity of analyte through pores along any two proximate bristles of coating, for unhindered analyte recapture in imprinted cavities of the CIP. In order to support this viewpoint, additional chronocoulometric measurements were performed (see Section S5, ESI†). Accordingly, surface coverages with 2.44 × 10⁻¹² mol (1.47 × 10¹² molecules) and 5.23 × 10⁻¹¹ mol (3.15 × 10¹³ molecules) of analyte and diffusion coefficients of 1.5 × 10⁻⁵ and 5.29 × 10⁻⁴ cm2 s−1 are obtained for CIP@AuNPs/PGE and CIP@AuNRs/PGE, respectively. The higher magnitudes of analyte rebinding on CIP@AuNRs/PGE, on account of the about 35 times greater diffusion coefficient than that of AuNPs based modified PGE, may be regarded as the significant contribution of the “brush-like” morphology of modified AuNRs on the tip of PGE. This contribution is in agreement with the reported electron transfer resistance from nanospherical materials.60
3.6 Estimation of Ara-C in aqueous samples
DPASV measurement is preferred over CV, as far as highly sensitive analysis is concerned. This is because DPASV (pulse height 25 mV, pulse width 25 ms) is carried out at a sufficient time scale of measurement compared to CV. In this work, the DPASV current response was measured for different concentrations of analyte at CIP@AuNPs/PGE and CIP@AuNRs/PGE. For this, different concentrations of analyte were added successively in 10.0 mL phosphate buffer (pH 7.2) under magnetic stirring and DPASV runs were recorded in quiescent conditions, under optimized operating analytical conditions. Fig. 4B shows typical DPASV runs of Ara-C (concentration 25.0 ng mL−1) on CIP@AuNPs/AuNRs decorated PGEs. Evidently, CIP@AuNRs/PGE responded with an approximately three times higher current compared to AuNPs-based PGE (runs c and d). DPASV runs for different concentrations of analyte were obtained at both electrodes. The corresponding linear calibration equations between DPASV peak current (Ip, μA) and concentration (C, ng mL−1) along with respective recoveries and limits of detection (LODs, S/N = 3) for aqueous and real samples are summarized in Table 2. Accordingly, DPASV measurements with an AuNRs-based electrode were obtained with high sensitivity in the wide concentration window. The proposed sensor did not reveal any current in the absence of analyte (Fig. 4B, run a) and also provided negligible response with NIP@AuNRs/PGE (Fig. 4B, run b), even at higher analyte concentration (50.0 ng mL−1). Apparently, Cu(II) remained intact with binding sites, without being affected under an anodic stripping scan. In view of the superiority of CIP@AuNRs/PGE over CIP@AuNPs/PGE in terms of highly sensitive performance, we have, henceforth, opted for the former electrode, for the analysis of Ara-C in aqueous and real samples. The proposed CIP-modified AuNRs/PGE sensor for Ara-C is compared with earlier work,13 by means of Student's t-test [tcal (2.86) < ttab (3.18), confidence level 95%] in the aqueous sample in the concentration range (15.0–50.0 ng mL−1). Although both methods are reproducible, the sensitivity of the proposed sensor (LODs = 0.19 ng mL−1) is realized to be superior to the earlier work (LODs = 97.28 ng mL−1). Furthermore, the proposed sensor is economically viable and eco-friendly, as compared to earlier work carried out with an Hg electrode. It is also worth comparing a CIP@AuNRs/PGE sensor with other known methods for the determination of Ara-C (Table S1, ESI†). Accordingly, earlier methods were not validated with real samples; whereas our sensor is capable of Ara-C analysis in real samples, without any matrix effect and false-positives. Further, previous methods had inferior detection sensitivities to evaluate stringent limits of Ara-C.
Table 2 Analytical results of DPASV measurements in aqueous and real samples
Electrode |
Sample |
Regression equation |
Range (ng mL−1) |
Recoverya (%) |
LODb (S/N = 3) (ng mL−1) |
RSDc (%) (n = 3) |
% recovery = (amount of analyte determined/amount of analyte taken) × 100. LOD (S/N = 3) calculated as three times the standard deviation of the blank (3σ) divided by the slope of the calibration plot. RSD (%) for three sets of LOD data. |
CIP@AuNPs/PGE |
Aqueous |
Ip = (0.131 ± 0.001)C + (0.001 ± 0.009), n = 9, R2 = 0.99 |
3.00–107.21 |
96.5–101 |
0.75 |
1.07 |
CIP@AuNRs/PGE |
Aqueous |
Ip = (0.353 ± 0.012)C + (0.225 ± 1.282), n = 9, R2 = 0.99 |
1.00–126.71 |
97–100 |
0.19 |
0.16 |
Blood plasma (50 times diluted) |
Ip = (0.361 ± 0.005)C + (0.024 ± 0.316), n = 8, R2 = 0.99 |
1.44–123.24 |
96.5–101 |
0.25 |
1.28 |
Urine (50 times diluted) |
Ip = (0.367 ± 0.005)C + (0.527 ± 0.343), n = 8, R2 = 0.97 |
1.92–122.35 |
98.3–99.4 |
0.20 |
1.40 |
Pharmaceutical (51 × 106 times diluted) |
Ip = (0.363 ± 0.003)C + (0.069 ± 0.130), n = 8, R2 = 0.97 |
1.96–125.50 |
97.4–01.2 |
0.19 |
2.27 |
Binding affinities of CIP@AuNRs (Q = 66.5 ng g−1) and CIP@AuNPs (Q = 52.7 ng g−1) vis-à-vis corresponding NIP-based electrodes (Q = 21.25 ng g−1) were also explored for Ara-C by batch binding equilibrium experiments (Fig. S5 and Section S6, ESI†).
3.7 Cross-reactivity and interference studies
The test analyte (Ara-C) and some structurally identical compounds like cytosine, cytidine, glucose (Glu), 6-thioguanine (6TG), 6-mercaptopurine (6MP), 5-fluorouracil (5FU), uric acid (UA), and glycine (Gly) were investigated using CIP@AuNRs/PGE and NIP@AuNRs/PGE to explore analyte selectivity, cross-reactivity and possible interferences. Accordingly, CIP@AuNRs/PGE was found to be highly selective for Ara-C in comparison with the competitors, because of the presence of specific cavities in the polymer network. Both CIP and NIP-modified electrodes revealed some DPASV responses for all the interferents, when studied individually (Fig. S6†). This non-specific contribution may be included in the final result. Fortuitously, we have been able to mitigate such contributions on an NIP-modified electrode simply by water-washings (n = 3, 1.0 mL). Therefore, as a safeguard, CIP@AuNRs/PGEs were also subjected to similar washing treatment, after analyte recapture in the molecular cavities. We have also examined the parallel cross-reactivity with a binary mixtures of template and interferent(s) (taken in 1
:
1 and 1
:
100 concentration ratios). The selectivity coefficient (k) and relative selectivity coefficient (k′) for the binding of Ara-C in the presence of competitor species can be obtained using the following relationships: |
 | (5) |
|
 | (6) |
where Itemplate is the DPASV response of the template solution and Iinterferent is the current response of the interferent(s) when measured individually. Selective coefficients for CIP and NIP-based electrodes were denoted kCIP and kNIP, respectively. The k and k′ values for Ara-C with respect to interferent(s) are summarized in Table 3. A substantial magnitude of selectivity coefficients (8–15%) was observed for all the interferents on the CIP-modified sensor. An approximately unit selectivity coefficient is tantamount to equal current response of both template and interferent(s), under the limit of experimental error, on the NIP-based sensor. The k and k′ values signify selectivity gained by the imprinting process. For all interferent(s), k and k′ values show almost similar behaviour of the NIP-sensor toward a non-specific contribution. The distinctive behaviour of the CIP-based sensor could be based on the fact that the interferent(s), which are structurally identical like cytidine, cytosine, UA and smaller molecules like 6TG, 6MP, 5FU, have a fair chance of approaching the imprinting sites, but they still mismatch the imprinting sites for binding, in terms of chemical affinity and size. In particular, cytidine, being very similar to Ara-C in terms of structure and size, has shown some non-specific binding (k = 0.13, k′ = 0.12; Table 3). However, the non-specific adsorption of cytidine could be curtailed from the MIP/NIP electrodes, after water-washings. Nevertheless, one can estimate the imprinting factor (IF = 18.57, ICIP/INIP) of Ara-C with the CIP/NIP-based sensors, before subjecting them to the washing treatment. In a similar tune, the binding factors for all interferents on the CIP-modified sensor with respect to the NIP-sensor, i.e. ICIP/INIP, are found to be insignificant in the range 1.3–2.3 (Table 3).
Table 3 The selectivity coefficients (k) and relative selectivity coefficients (k′) values obtained on the CIP@AuNRs/PGEa,b
Compound |
ICIP (μA) |
INIP (μA) |
k (MIP) |
k (NIP) |
k′ |
k = selectivity coefficient was calculated as Iinterferent/IAra-C. k′ = relative selectivity coefficient was calculated as kMIP/kNIP. |
Ara-C |
26.0 |
1.4 |
— |
— |
— |
Glu |
2.7 |
1.7 |
0.10 |
1.21 |
0.08 |
Cytidine |
3.5 |
1.5 |
0.13 |
1.07 |
0.12 |
6MP |
2.3 |
1.5 |
0.08 |
1.10 |
0.08 |
UA |
2.5 |
1.9 |
0.09 |
1.35 |
0.06 |
Cytosine |
3.2 |
1.5 |
0.12 |
1.07 |
0.11 |
5FU |
3.2 |
1.0 |
0.12 |
0.71 |
0.16 |
6TG |
2.6 |
1.6 |
0.10 |
1.10 |
0.09 |
Gly |
1.8 |
1.6 |
0.07 |
1.14 |
0.06 |
Mix. of interferents |
3.8 |
2.1 |
0.15 |
1.5 |
0.1 |
3.8 Reproducibility, stability, selectivity, and cross-reactivity of CIP@AuNRs/PGE
In order to explore the reproducibility of the proposed sensor during fabrication, as many as five sensors were made independently under identical preparation conditions, and examined for Ara-C (25.0 ng mL−1) evaluation. All results were found within a 1.4% relative standard deviation (RSD) in the aqueous medium. The most attractive feature with the use of CIP@AuNRs/PGE for electro-oxidation of Ara-C is the easy renewal of the surface for the next use, by the method of template extraction. To examine the intraday measurement precision, multiple runs were obtained for Ara-C at a fixed concentration (37.46 ng mL−1), using any single electrode (duly regenerated between the two consecutive runs) for either of the real samples (blood plasma, urine and pharmaceutics). Accordingly, the results of 21 successive runs are found to be consistent with RSD 2.07% (for brevity, three successive runs are shown in Fig. 4C for each sample). Insofar as the interday stability of an electrode is concerned, the current response was measured daily; the current was found to be unaltered over a period of 14 days and a decrease of 1.6% in current response occurred on 15th day (Fig. 4B inset). Thus, the proposed sensor possesses good reproducibility and ruggedness toward the quantitative assay of Ara-C, in aqueous and real samples. Thermal stability of bulk CIP was also examined by TGA (Section S7 and Fig. S7, ESI†). It is worthwhile noting that the imprinted system was found to be stable up to 275 °C.
3.9 Practical applications
To validate the proposed method, the CIP@AuNRs/PGE was used for Ara-C evaluation in real samples by applying the standard addition technique. For this, the blood plasma and urine samples were diluted by as much as 50 fold to combat the matrix effect. The proposed sensor was also applied to the detection of Ara-C in a pharmaceutical sample (51 × 106 fold diluted for attaining the detection range of concentrations). The corresponding results are portrayed in Table 4. The representative DPASV curves in real samples (only two different concentrations of Ara-C for each sample) are shown in Fig. 4C. Evidently, DPASV peaks are found to be symmetrical for blood plasma (curves b and c), urine (curves e and f), and pharmaceutics (curves h and i). NIP@AuNRs/PGE did not respond to Ara-C in all types of samples (Fig. 4C, curves a, d and g). A sample behaviour of real samples, studied in terms of linear regression equation, range, recovery and LOD, is depicted in Table 2. Interestingly, the extensive dilution of real samples did not result in a deviation of their sample behaviour from that of the aqueous sample. As a matter of fact, the slopes of the calibration equations and detection sensitivities of all the real samples studied are very close to those of aqueous solution. This indicates the feasibility of real sample analysis without any matrix effect. In particular, the endogenous concentration of Ara-C (Table 4) is found to be in agreement with the certified value of Ara-C printed on the injection cover. Thus, the proposed CIP@AuNRs/PGE sensor entails higher selectivity, sensitivity, simplicity, and clinical applicability for Ara-C determination in real samples.
Table 4 Analytical results of DPASV measurements in blood plasma, urine and pharmaceutical samples
Samples |
Concentration (ng mL−1) |
Determined value ± SDa (ng mL−1) |
Recovery (%) |
RSDb (%) |
SD = standard deviation of three replicate values. RSD = relative standard deviation. Endogenous concentration shown in parentheses (certified value = 100 × 106 ng mL−1). |
Blood plasm (50 times diluted) |
3.47 |
3.41 ± 0.04 |
98.4 |
1.1 |
15.21 |
15.21 ± 0.20 |
99.0 |
1.4 |
50.34 |
50.08 ± 0.60 |
99.5 |
1.2 |
Urine (50 times diluted) |
5.23 |
5.07 ± 0.08 |
97.0 |
1.5 |
22.11 |
21.90 ± 0.24 |
99.5 |
1.1 |
60.13 |
60.12 ± 0.78 |
100.0 |
1.3 |
Pharmaceutical (51 × 106 times diluted) |
1.96 (99.9 × 10⁶)c |
1.90 ± 0.03 |
97.0 |
1.5 |
10.04 |
9.83 ± 0.12 |
98.0 |
1.2 |
25.46 |
24.82 ± 0.27 |
97.5 |
1.1 |
4. Conclusions
In this work, for the first time, we are reporting a comparative study of CIP@AuNPs and CIP@AuNRs modified PGEs in terms of electrochemical sensing of Ara-C, in aqueous samples. These sensors realized detection sensitivities as low as 0.19 and 0.75 ng mL−1, respectively. The imprinting factor of the imprinted polymer film was found to be as high as 18.57. The proposed CIP@AuNRs-based sensor is observed to be better than CIP@AuNPs/PGE, in terms of faster electrode kinetics (k = 1.36 × 10⁻² vis-a-vis 1.75 × 10⁻³ cm s−1) and higher diffusivity (D = 5.29 × 10⁻⁴ vis-a-vis 1.5 × 10⁻⁵ cm2 s−1). The modified sensor was also validated for Ara-C analysis in the complicated matrices of biological fluids and pharmaceutics. This work is significant to monitor Ara-C ultra-trace level for an adequate supplementation of the drug in cancer patients.
Acknowledgements
Authors thank Council of Scientific and Industrial Research-University Grant Commission (CSIR-UGC), New Delhi (R./Dev./Ch./(UGC-SRF-260)/S-1) for granting a senior research fellowship to one of us (RS).
References
- B. S. Li and X. T. Xie, J. Tongji Univ., Med. Sci., 2002, 23, 68 Search PubMed.
- A. F. Mistiran, A. A. Dzarr and S. H. Gan, Toxicol. Mech. Methods, 2010, 20(8), 472–481 CrossRef CAS PubMed.
- E. Ersvaer, A. K. Brenner, K. Vetås, H. Reikvam and Ø. Bruserud, BMC Pharmacol. Toxicol., 2015, 16, 1–16 CrossRef CAS PubMed.
- Z. Cai, X. Zhang, D. F. Lu and J. N. Gan, Bull. Korean Chem. Soc., 2012, 33(No. 1), 171 CrossRef CAS.
- M. J. Hilhorst, G. Hendriks, M. W. J. van Hout, H. Sillén and N. C. Merbel, Future Sci., 2011, 3, 1603–1611 CAS.
- L. Yuandong, L. Ningsheng, W. Jingsong and L. Yi, China Pharm., 2006, 17, R96 Search PubMed.
- J. Braess, J. Pfortner, C. C. Kaufmann, B. Ramsauer, M. Unterhalt, W. Hiddemann and E. Schleyer, J. Chromatogr. B: Anal. Technol. Biomed. Life Sci., 1996, 676, 131–140 CrossRef CAS PubMed.
- S. N. Murthy, A. Rohini, K. E. Pravallika, A. Prameela Rani and S. A. Rahaman, Int. J. Sci. Prog. Res., 2013, 4(12), 4573–4576 Search PubMed.
- W. L. Jin, Acta Med. Sin., 2000, 13, 437 Search PubMed.
- Y. Hsieh, C. J. G. Duncan and M. Liu, J. Chromatogr. B: Anal. Technol. Biomed. Life Sci., 2007, 854, 8–12 CrossRef CAS PubMed.
- Y. B. Sun, J. Sun, B. Wen, S. L. Shi, Y. J. Xu, Y. Chen, Y. J. Wang, C. Q. Pan, C. Y. Zhang, T. Zhang and Z. He, J. Chromatogr. B: Anal. Technol. Biomed. Life Sci., 2008, 870, 121–125 CrossRef CAS PubMed.
- C. Teijeiro and D. Marin, J. Electroanal. Chem., 1992, 337, 119–131 CrossRef.
- D. Marin and C. Teijeiro, Bioelectrochem. Bioenerg., 1992, 28, 417–424 CrossRef CAS.
- M. Erdem, R. Say, A. Ersoz, A. Denizli and H. Turk, React. Funct. Polym., 2010, 70, 238–243 CrossRef CAS.
- H. S. Lee and J. Hong, J. Chromatogr. A, 2000, 868, 189–196 CrossRef CAS PubMed.
- L. Qin, X. W. He, W. Zhang, W. Y. Li and Y. K. Zhang, Anal. Chem., 2009, 81, 7206–7216 CrossRef CAS PubMed.
- A. Gultekin, A. Ersoz, D. Hur, N. Y. Sarıozlu, A. Denizlid and R. Say, Appl. Surf. Sci., 2009, 256, 142–148 CrossRef.
- T. A. Sergeyevaa, O. A. Slinchenko, L. A. Gorbach, V. F. Matyushov, O. O. Brovko, S. A. Piletsky, L. M. Sergeeva and G. V. Elska, Anal. Chim. Acta, 2010, 659, 274–279 CrossRef PubMed.
- J. Margolis, Conductive Polymers and Plastics, Chapman and Hall, New York, 1989, pp. 2–11 Search PubMed.
- B. Ertan, T. Eren, I. Ermis, H. Saral, N. Atar and M. L. Yola, J Colloid Interface Sci., 2016, 470, 14–21 CrossRef CAS PubMed.
- N. Atar, M. L. Yola and T. Eren, Appl. Surf. Sci., 2016, 362, 315–322 CrossRef CAS.
- E. B. Özkütük, S. E. Diltemiz, E. Özalp, R. Say and A. Ersöz, Mater. Sci. Eng., C, 2013, 33, 938–942 CrossRef PubMed.
- A. Gültekin, G. Karanfil, S. Sönmezoğlu and R. Say, Mater. Sci. Eng., C, 2014, 42, 436–442 CrossRef PubMed.
- T. Murata, Y. Morita, Y. Yakiyama, K. Fukui, H. Yamochi, G. Saito and K. Nakasuji, J. Am. Chem. Soc., 2007, 129, 10837–10846 CrossRef CAS PubMed.
- M. Guo, H. Fang, R. Wang, Z. Yang and X. Xu, J. Mater. Sci.: Mater. Med., 2011, 22, 1985–1992 CrossRef CAS PubMed.
- K. Szot, M. J0nsson-Niedziolk, E. Roznieck, F. Marken and M. Opallo, Electrochim. Acta, 2013, 89, 132–138 CrossRef CAS.
- L. Y. Jin, X. Gao, H. Chen, L. S. Wang, Q. Wu, Z. C. Chen and X. F. Lin, J. Electrochem. Soc., 2013, 160, 6–12 CrossRef.
- P. Poudel and Q. Qiao, Nanoscale, 2012, 4, 2826–2838 RSC.
- X. Ren, D. Chen, X. Meng, F. Tang, A. Du and L. Zhang, Colloids Surf., B, 2009, 72, 188–192 CrossRef CAS PubMed.
- J. Narang, N. Malhotra, G. Singh and C. S. Pundir, Biosens. Bioelectron., 2015, 66, 332–337 CrossRef CAS PubMed.
- M. C. Daniel and D. Astruc, Chem. Rev., 2004, 104, 293–346 CrossRef CAS PubMed.
- H. Liao and J. H. Hafner, Chem. Mater., 2005, 17, 636–641 CrossRef.
- D. Pissuwan, S. M. Valenzuela and M. B. Cortie, Trends Biotechnol., 2006, 24, 62–67 CrossRef CAS PubMed.
- S. E. Skrabalak, J. Chen, L. Au, X. Lu, X. Li and Y. Xia, Adv. Mater., 2007, 19, 3177–3184 CrossRef CAS PubMed.
- G. Sun, H. Liu, Y. Zhang, J. Yu, M. Yan and X. Song, New J. Chem., 2015, 39, 6062–6067 RSC.
- R. Ahmad, N. Félidj, L. Boubekeur-Lecaque, S. Lau-Truong, S. Gam-Derouich, P. Decorse, A. Lamouri and C. Mangeney, Chem. Commun., 2015, 51, 9678–9681 RSC.
- A. R. M. N. Afrooz, S. T. Sivalapalan, C. J. Murphy, S. M. Hussain, J. J. Schlager and N. B. Saleh, Chemosphere, 2013, 91, 93–98 CrossRef CAS PubMed.
- A. Abbas, L. Tian, J. J. Morrissey, E. D. Kharasch and S. Singamaneni, Adv. Funct. Mater., 2013, 23, 1789–1797 CrossRef CAS PubMed.
- S. Utku, E. Yılmaz, D. Türkmen, L. Uzun, B. Garipcan, R. Say and A. Denizli, J. Biol. Chem., 2008, 36, 291–304 Search PubMed.
- Y. Xiao, H. X. Ju and H. Y. Chen, Anal. Chim. Acta, 1999, 391, 73–82 CrossRef CAS.
- M. Chirea, A. Cruz, C. M. Pereira and F. Silva, J. Phys. Chem. C, 2009, 113, 13077–13087 CAS.
- W. Ahmed, C. Glassa and J. M. Ruitenbeek, Nanoscale, 2014, 6, 13222–13227 RSC.
- B. Nikoobakht and M. A. El-Sayed, Langmuir, 2001, 17, 6368–6374 CrossRef CAS.
- N. R. Jana, L. Gearheart and C. J. Murphy, Adv. Mater., 2001, 13, 1389 CrossRef CAS.
- W. Gao and J. Song, J. Electroanal. Chem., 2005, 576, 1–7 CrossRef CAS.
- D. A. Skoog, F. T. Holler and T. A. Neiman, Principles of Instrumental Analysis, Harcourt Brace College Publishers, Orlando, 5th edn, 1998 Search PubMed.
- S. F. Lo, S. Y. Wang, M. J. Tsai and L. D. Lin, Chem. Eng. Res. Des., 2012, 90, 1397–1406 CrossRef CAS.
- J. Zheng, L. Jing and S. Yanbin, Electrochem. Commun., 2007, 9, 2739–2743 CrossRef.
- Y. H. Won, K. Huh and L. A. Stanciu, Biosens. Bioelectron., 2011, 26, 4514–4519 CrossRef CAS PubMed.
- A. J. Bard and L. R. Faulker, Electrochemical Methods, Wiley, New York, 2nd edn, 2001 Search PubMed.
- I. Samasundaram, K. M. Kommiya and M. Palaniandavar, J. Chem. Soc., Dalton Trans., 1991, 2083–2089 RSC.
- P. Job, Ann. Chim., 1928, 9, 113–203 CAS.
- A. Mocanu, I. Cernica, G. Tomoaia, L. D. Bobos, O. Horovitz and M. T. Cotisel, Colloids Surf., A, 2009, 338, 93–101 CrossRef CAS.
- A. Majzik, L. Fülöp, E. Csapó, F. Bogár, T. Martinek, B. Penkea, G. Bíró and I. Dékány, Colloids Surf., B, 2010, 81, 235–241 CrossRef CAS PubMed.
- Y. Gong, J. Liu, R. Liu, J. Wang, C. Niu, W. Zhu, D. Xu, Z. Hu, M. Li and Y. Zhao, RSC Adv., 2016, 6, 174–178 RSC.
- L. Y. Beaulieu, A. D. Rutenberg and J. R. Dahn, Microsc. Microanal., 2002, 8, 422–428 CrossRef CAS PubMed.
- B. B. Prasad and I. Pandey, Sens. Actuators, B, 2013, 186, 407–416 CrossRef CAS.
- B. B. Prasad, D. Kumar, R. Madhuri and M. P. Tiwari, Biosens. Bioelectron., 2011, 28, 117–126 CrossRef CAS PubMed.
- C. Costentin, V. Hajj, M. Robert, J. M. Saveant and C. Tard, J. Am. Chem. Soc., 2010, 132, 10142–10147 CrossRef CAS PubMed.
- X. Zhang, A. Gu, G. Wang, Y. Wei, W. Wang, H. Wu and B. Fang, CrystEngComm, 2010, 12, 1120–1126 RSC.
Footnote |
† Electronic supplementary information (ESI) available: Figures showing optimizations of polymer composition, FT-IR, DPASV response for analyte and interferents, TGA, table for comparison of different methods. See DOI: 10.1039/c6ra14097a |
|
This journal is © The Royal Society of Chemistry 2016 |
Click here to see how this site uses Cookies. View our privacy policy here.