DOI:
10.1039/C6RA14048C
(Paper)
RSC Adv., 2016,
6, 73063-73069
Mechanism for anomalous luminescence behaviour of Eu2+-doped red-emitting magnesium nitride phosphors
Received
30th May 2016
, Accepted 6th July 2016
First published on 19th July 2016
Abstract
A series of novel red-emitting phosphors Mg3−xN2:xEu2+ (0 ≤ x ≤ 0.08) were successfully synthesized by solid-state reactions at low temperature. The grains of the resulting phosphors showed good dispersibility with diameters of about 14–20 μm; some needle-like crystals gradually increased in length and thickness as the sintering time increased. The excitation spectra of the Mg3N2:Eu2+ phosphors showed strong excitation in the range 250–450 nm, with a dominant excitation peak around 428 nm. At excitation wavelengths <428 nm, the phosphors exhibited a broadband red emission peaking at about 612 nm with a tail on the long wavelength side. The emission peak positions of the Mg3−xN2:xEu2+ (0 ≤ x ≤ 0.08) phosphors shifted from 621 to 609 nm as the Eu2+ concentration increased and the emission intensity was at a maximum at x = 0.05. The mechanism of the shift in emission was explained by adjusting the cationic composition of the phosphors. The emission peaks of Mg3N2:Eu2+ were influenced by the nephelauxetic effect, the crystal field environment and the Stokes shift. Based on experimental data, we propose an underlying mechanism of thermal quenching and elucidated the large thermal quenching of Mg3N2:Eu2+ using a configurational coordinate diagram. These results indicate that Mg3N2:Eu2+ could be used in the development of white light-emitting diodes.
1. Introduction
There is currently much interest in the development of white light-emitting diodes (LEDs) as a result of their high energy efficiency, long lifetime and environmentally friendly properties.1,2 Phosphor-converted white LEDs are considered to be the simplest, most cost-effective and most reliable type of solid-state lighting and are assembled by combining a blue or near-ultraviolet (N-UV) LED chip with phosphors.3–5 The continued improvement in these devices requires not only advances in the LED chips, but, more importantly, the development of novel down-converting phosphors.
As new members of the phosphor family, nitride phosphors possess high chemical and physical stabilities and show small thermal quenching and an intense luminescence. They have therefore attracted attention as host materials for phosphors doped with rare earth elements.6,7 The spectral properties of the activator ions (e.g. Eu2+ and Ce3+) are strongly influenced by the surrounding environment (e.g. the symmetry, covalence, coordination, bond length, site size and crystal field strength).8 Coordinating with nitrogen causes a stronger nephelauxetic effect and the centre of gravity of the 5d states of the activator ions will shift to lower energies, which leads to a red-shifted photoluminescence. Several novel nitride phosphors with interesting properties have been reported, e.g. Sr[LiAl3N4],9 M[Mg2Al2N4] (M = Ca, Sr, Ba)10 and Mg3GaN3.11 However, nitride phosphors are still scarce due to their exacting preparation conditions (high temperature, high N2 pressure and air-sensitive starting powders). Therefore novel nitride phosphors synthesized in a simpler and less costly manner are urgently required.
Mg3N2 has attracted much attention as a ceramic with high thermal conductivity and the ability to reversibly store hydrogen.12–14 Defect-related photoluminescence with a strong yellow to red emission has been reported in Mg3N2.15 Mg–N compounds are usually synthesized at lower temperatures (≤1275 K) than traditional nitrides (≥1725 K).10,11,16 In contrast to the physical and chemical characteristics, the relationship between the structures and luminescent properties of Mg3N2 doped with rare earth elements has not been discussed. We therefore designed a new red-emitting phosphor Mg3N2:Eu2+ sintered at low temperatures and investigated its photoluminescence properties and thermal stability. The mechanism for the emission shift resulting from the introduction of Eu2+ into the Mg3N2 host was studied in detail.
2. Experimental section
2.1 Experimental
The binary nitride precursor Mg3N2 was prepared by the reaction of pure magnesium metal (Mg, AR, Sinopharm Chemical Reagent Co. Ltd, China) under a flow of dry nitrogen at 600 °C for 1 h, followed by annealing at 800 °C for 5–8 h in a nitrogen atmosphere in a horizontal tube furnace. EuF3 was used as a dopant to synthesize Mg3−xN2:xEu2+ (0 ≤ x ≤ 0.08) (Aldrich Chemical Co., Milwaukee, 99.99% metal basis), but other doping agents (e.g. EuCl2, Eu metal) could also be used. The obtained products were canary yellow powders.
2.2 Characterization
The phase purity was determined using an X-ray diffractometer (Rigaku D/Max-2400) at a scan rate of 2° min−1 and intervals of 0.02° in the range 2θ with Cu Kα radiation (λ = 1.5405 Å). The crystal structure was refined by the Rietveld method using the General Structure Analysis System software suite. The morphologies of the samples were examined using a scanning electron microscope (Hitachi-4800). The diffuse reflectance spectra of the samples were collected from finely ground samples using an UV-vis spectrophotometer (PE lambda950) with BaSO4 as a reference in the range 200–700 nm. The reflection spectra were converted to absorbance spectra by the Kubelka–Munk method. The quantum efficiency (QE), photoluminescence (PL) and photoluminescence excitation (PLE) spectra of the samples were recorded using a fluorescence spectrophotometer (FLS-920T) equipped with a 450 W Xe light source and double excitation monochromators. The temperature-dependent luminescence measurements were carried out between 25 and 250 °C in steps of about 25 °C at a heating rate of 20 °C min−1 using the HORIBA JOBIN YVONFluorlog-3 spectrofluorometry system.
3. Results and discussion
3.1 Crystal structure and phase identification
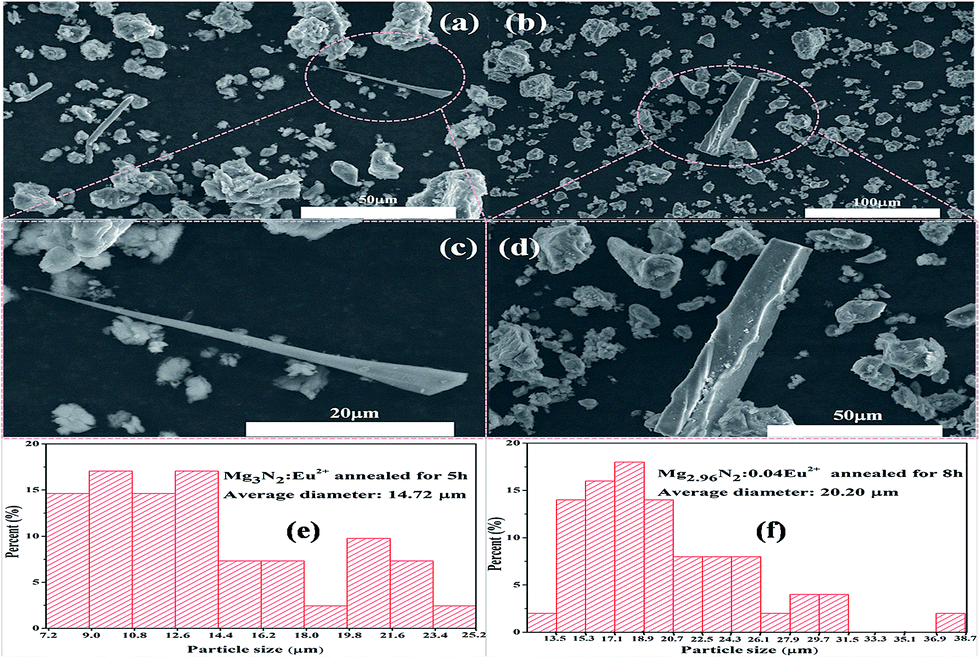
The structure of the obtained phosphor was determined by scanning electron microscopy (SEM). Fig. 1a shows the morphologies of Mg2.95N2:0.05Eu2+. The photomicrographs show an irregular morphology and the particles are well dispersed. Fig. 1c shows some needle-like crystalline particles. When the sintering time was increased from 5 to 8 h, the needles gradually become thicker and longer (Fig. 1b and d). Similar needle-like microstructures are commonly observed in hot-pressed nitride phosphors, but rarely in phosphors obtained at atmospheric pressure. This phenomenon is believed to be a result of the preferential grain growth induced during densification.5 The particle size distributions for sintering times of 5 and 8 h for Mg3N2:Eu2+ were investigated using the Nano Measurer program and the average diameters were 14.72 and 20.20 μm. Although the particle morphology in the Mg3N2:Eu2+ phosphor was needle-like crystals, the influence of the shape of the phosphor particles on their practical application became weaker after sieving and milling. Similar behaviour has been reported in Eu2+-doped β-SiAlON phosphors, which have been successfully applied in LEDs.17
 |
| | Fig. 1 SEM micrographs and particle size distributions of Mg3N2:0.05Eu2+ with sintering times of (a, c and e) 5 and (b, d and f) 8 h. | |
To determine the crystal structure of the synthesized samples, the Mg2.95N2:0.05Eu2+ compounds were investigated using the General Structure Analysis System program.18 Fig. 2 shows the experimental, calculated, background and difference results for the XRD reference of Eu-doped Mg3N2 and the host Mg3N2 at room temperature. All the observed peaks satisfied the reflection condition. Table 1 gives the final parameters of the crystallography and the refinement data. No impurity phase was found in the sample, which confirms that all the samples were a single phase. The preferred orientation was successfully corrected using spherical harmonics functions and R-factors. The Rp values converged to 9.98 and 10.06% for the host Mg3N2 and Eu-doped Mg3N2, respectively. The Rwp values were calculated to be 11.87 and 12.13% the host Mg3N2 and Eu-doped Mg3N2, respectively. The final refinement data indicated that the powder samples were well crystallized in a cubic unit cell of space group Ia![[3 with combining macron]](https://www.rsc.org/images/entities/char_0033_0304.gif) with lattice constants of a = b = c = 9.9528(1) Å; the cell volume was 985.91(2) Å3. Fig. 2c shows that Mg3N2 crystallizes in an anti-bixbyite structure, which is often referred to as a C-sesquioxide type. In this defect type of the fluorite structure, distorted cubes are filled by the closest packing of the nitrogen atoms and the magnesium atoms occupy the tetrahedral holes in an ordered manner. The characteristic structural units are all edge-sharing MgN4 tetrahedra, which expand indefinitely in three dimensions. However, such a connection type is not the most stable configuration. The edge-sharing connection type will reduce the interatomic distance of two neighbouring cations and increase the electrostatic repulsive force between them. According to Pauling's third rule,19 this effect will reduce the stability of the structure, which contributes to the luminescence properties.
with lattice constants of a = b = c = 9.9528(1) Å; the cell volume was 985.91(2) Å3. Fig. 2c shows that Mg3N2 crystallizes in an anti-bixbyite structure, which is often referred to as a C-sesquioxide type. In this defect type of the fluorite structure, distorted cubes are filled by the closest packing of the nitrogen atoms and the magnesium atoms occupy the tetrahedral holes in an ordered manner. The characteristic structural units are all edge-sharing MgN4 tetrahedra, which expand indefinitely in three dimensions. However, such a connection type is not the most stable configuration. The edge-sharing connection type will reduce the interatomic distance of two neighbouring cations and increase the electrostatic repulsive force between them. According to Pauling's third rule,19 this effect will reduce the stability of the structure, which contributes to the luminescence properties.
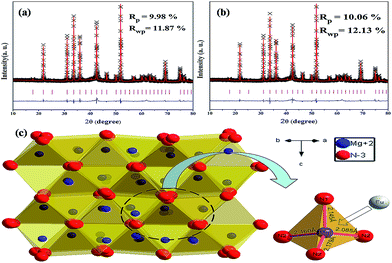 |
| | Fig. 2 Peak position (purple line), experimental (crosses) and calculated (red solid line) XRD profiles and their difference (blue line) for the Rietveld refinements of (a) Mg3N2 and (b) Mg2.95N2:0.05Eu2+. (c) Crystal structure of Mg3N2. | |
Table 1 Refinement data for Mg2.95N2:0.05Eu2+
| Formula |
Mg2.95N2:0.05Eu2+ |
| Crystal system |
Cubic |
| Space group |
Ia(206) |
![[thin space (1/6-em)]](https://www.rsc.org/images/entities/char_2009.gif) |
| Lattice parameters |
| a (Å) |
9.9528(1) |
| Cell volume (Å3) |
985.91(2) |
| Z |
16 |
|
| Reliability factors |
| Rwp |
0.1187 |
| Rp |
0.0998 |
| χ2 |
3.125 |
3.2 XRD analysis
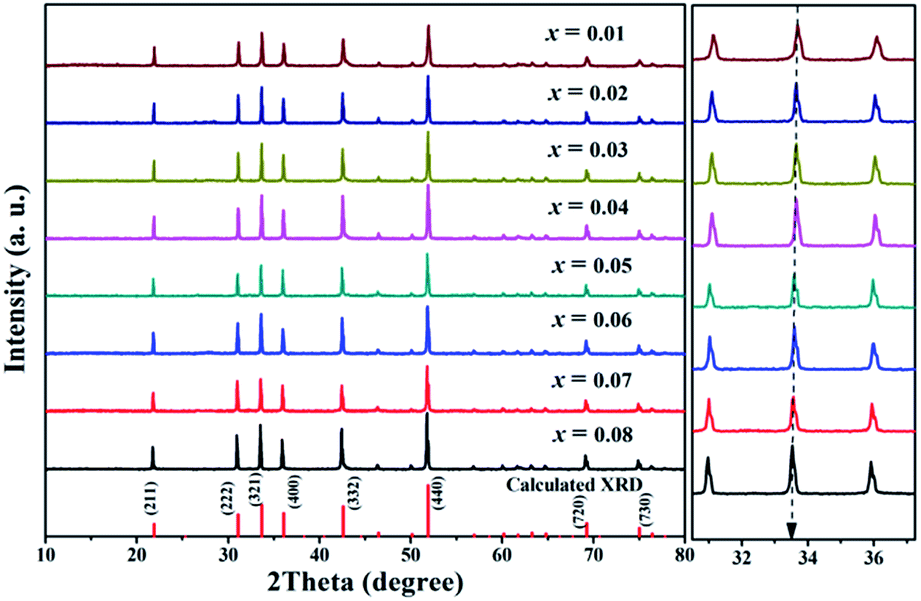
Fig. 3 shows the XRD patterns of the synthesized Mg3−xN2:xEu2+ (0.01 ≤ x ≤ 0.08) samples. The XRD profiles fitted well with the calculated data, indicating that the obtained samples were a single phase and that the rare earth ions had been successfully incorporated in the Mg3N2 host lattices. Importantly, a small shift in the diffraction peaks was observed when doping Eu2+ into Mg3N2 because the effective ionic radius of Mg2+ is smaller than that of Eu2+ in four coordination.20 This can be explained using the Bragg equation (2dsinθ = nλ).21
 |
| | Fig. 3 XRD patterns of Mg3−xN2:xEu2+ samples (0.01 ≤ x ≤ 0.08). | |
3.3 Diffuse reflectance spectrometry of Mg3N2:Eu2+
Fig. 4 demonstrates the DRS results for undoped and Eu2+-doped Mg3N2. The Mg3N2 host material showed optical absorption over the ≤500 nm spectral region. A sharp absorption band over the 420–480 nm N-UV and blue range was also seen and was ascribed to a near band edge excitation.15 A flag profile ranging from 200 to 420 nm in the spectra represents a band-to-band excitation. When the Eu2+ ions were doped into the Mg3N2 host, the reflection spectrum showed no obvious change in position or shape, but the absorption in the range 410–500 nm, overlapping with the near band edge excitation, was larger. This is probably because the transition of Eu2+ from the 4f7 ground state to the 4f65d1 excitation state was similar to the near band edge transition in the host lattice. The band gap of the Mg3N2 host can be estimated according to the equation:22| | |
[F(R∞hν)]n = A(hv − Eg)
| (1) |
where hν is the photon energy, A is a proportional constant, Eg is the energy of the band gap, n = 2 for a direct transition or n = 1/2 for an indirect transition and F(R∞) is a Kubelka–Munk function defined as:| | |
F(R∞) = (1 − R)1/2/2R = K/S
| (2) |
where R, K and S are the reflection, absorption and scattering coefficients, respectively. By adopting the methods proposed by Cao et al.,23 the optical bandgap energy of Mg3N2 was determined to be 2.68 eV by extrapoling to [F(R∞)hν]1/2 = 0.
 |
| | Fig. 4 Diffuse reflectance spectra of the Mg3N2 host and the Eu-doped phosphor. Inset shows the curve of [F(R∞)hν]1/2 vs. hν for Mg3N2. | |
3.4 PLE and PL properties of Mg3N2:Eu2+
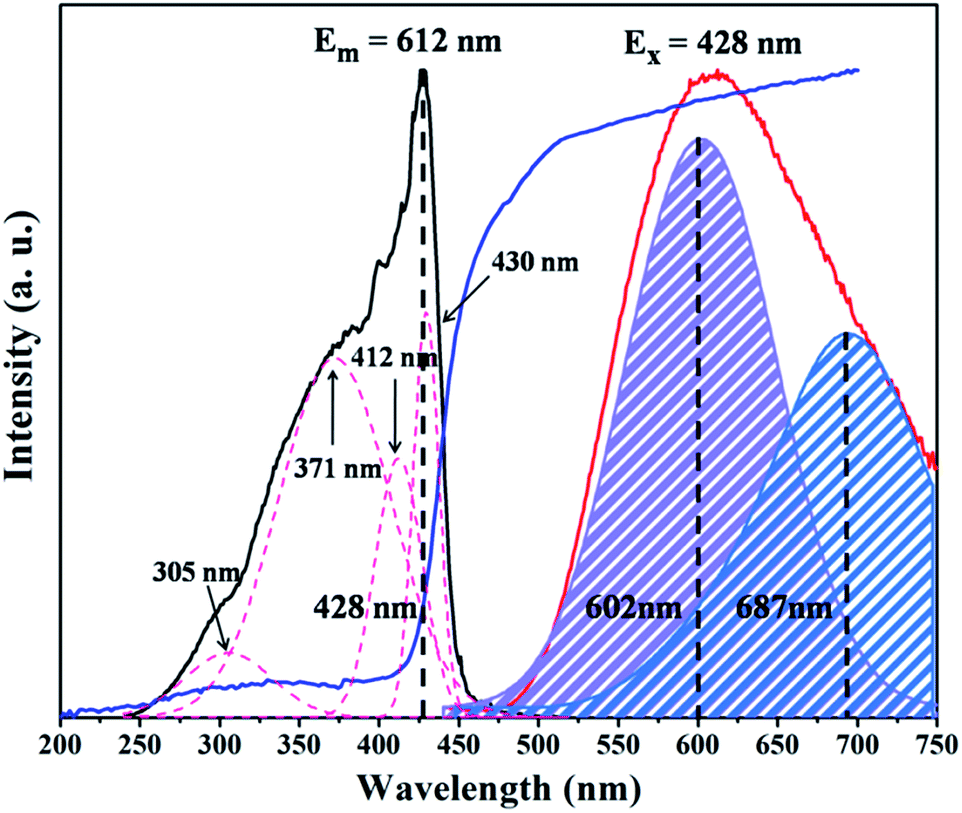
Fig. 5 shows the diffuse reflection spectrum and excitation and emission spectra of the as-prepared Mg2.95N2:0.05Eu2+ powders. The excitation spectrum at 612 nm shows a broad excitation band of Eu2+ from 250 to 450 nm, which coincides with the diffuse reflection spectrum. The excitation band can be decomposed into four Gaussian sub-bands peaking at about 305, 371, 412 and 430 nm. Edge-sharing MgN4 tetrahedra in an Mg3N2 lattice will decrease the rigidity of the host crystal lattice. To clarify this, we calculated the Stokes shift of Mg3N2:Eu2+ by taking twice the energy difference between the zero phonon line energy and the energy of the emission maximum. The spectral position of the zero phonon line could be estimated from the intersection of the excitation and emission spectra. Using the intersection point (465 nm) between the excitation and emission curves, the lowest excited state of the 7FJ multiplet of the 4f6 configuration (zero phonon line) was evaluated to be 2.67 eV. The value of the Stokes shift for Eu2+ in Mg3N2 is 10800 cm−1. Table 2 summarizes the Stokes shift in common nitride phosphors. The calculated Stokes shift was larger than those of common nitride red phosphors, such as Sr2Si5N8 (3050 cm−1) and CaAlSiN3 (2200 cm−1).24,25 It is well known that a large Stokes shift is desirable because this avoids the reabsorption of the emitted light by the emitting centre.
 |
| | Fig. 5 Diffuse reflection spectrum and excitation and emission spectra of the Mg2.95N2:0.05Eu2+ phosphor. | |
Table 2 Crystal-field splitting estimated from the energy difference between the highest and lowest observed 5d excitation levels of Eu2+; centre of gravity estimated from the average observed 5d absorption levels of Eu2+
| Compound |
Stokes shift (cm−1) |
Crystal field splitting (cm−1) |
Centre of gravity (cm−1) |
| Ca2Si5N8 |
3400 |
22500 |
28900 |
| Sr2Si5N8 |
3050 |
23000 |
28300 |
| Ba2Si5N8 |
3350 |
22000 |
28700 |
| CaAlSiN3 |
2200 |
26000 |
26000 |
| SrAlSi4N7 |
3700 |
14400 |
25400 |
| CaSiN2 |
4850 |
20300 |
27400 |
| SrSiN2 |
6500 |
11200 |
27300 |
| Mg3N2 |
10800 |
9530 |
26800 |
The emission spectrum consisted of one broad, asymmetrical band extending from 500 to 800 nm and centred at about 612 nm (FWHM ∼ 180 nm) with a tail at the long wavelength side. The asymmetry of the red emission band could be decomposed into two Gaussian sub-bands centred at 687 and 602 nm. Between these two sub-bands, the lower energy component corresponded to the nitrogen vacancy as a candidate for the emission centre. Such a defect-related photoluminescence phenomenon was clearly observed for the new phosphor, which agrees with the results reported by Uenaka and Fang.15,26 The higher energy component centred at 602 nm was attributed to the 4f65d–4f7 transition of Eu2+. The observed unusual long wavelength excitation and emission bands resulted from the nitrogen-rich surroundings of the Eu2+ ions. Both the higher formal charge of N3− compared with O2− and the lower electronegativity of nitrogen (3.04) compared with oxygen (3.44) would lead to a larger crystal field splitting of the 5d levels and a lower energy for the centre of gravity of the 5d states. Therefore this long wavelength emission of Eu2+ was as expected.
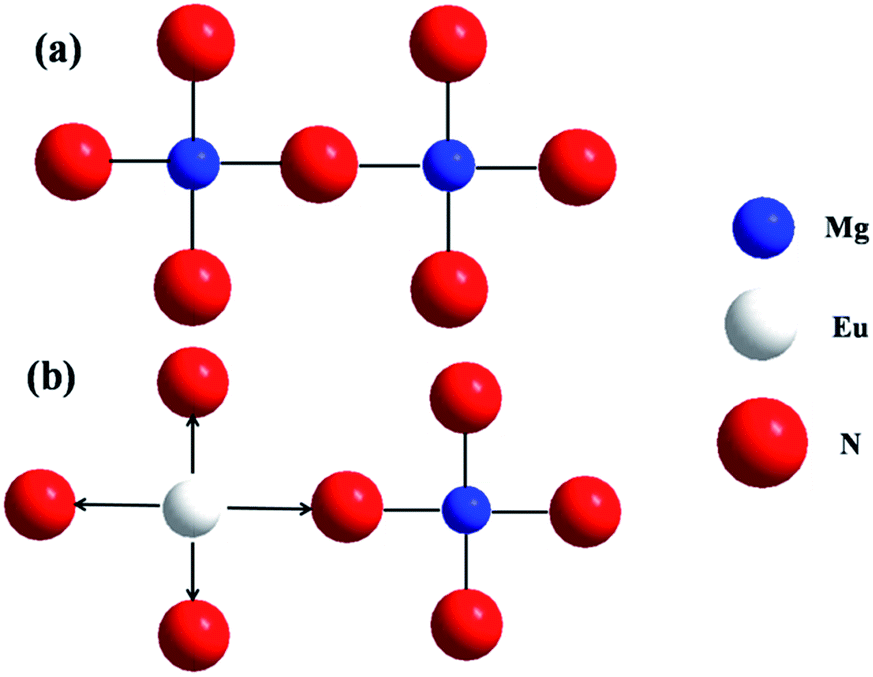
Fig. 6 shows the PL intensity of Mg3−xN2:xEu2+ (0 ≤ x ≤ 0.08) as a function of the Eu2+ concentration in the phosphor with excitation at 428 nm. With no rare earth element doping, the host phosphor showed a deep red emission peak located near 690 nm, which corresponds to the lower energy Gaussian sub-band emission. With an increase in the concentration of the dopant Eu2+, the PL intensity increased and the emission peak shifted to about 620 nm. When the Eu2+ concentration was 0.05, the emission intensity reached a maximum and then decreased as the concentration of Eu2+ increased as a result of the concentration quenching effect. The internal QEs of Mg3−xN2 for x = 0 and x = 0.05 excited at 428 nm were 9.91 and 21.2%, respectively. A red shift is often observed on increasing the Eu2+ content in phosphors, which is attributed to the reabsorption of Eu2+.27 However, in our experiment the peak position showed an anomalous blue shift with an increase in the concentration of Eu2+. Such a blue shift phenomenon has not previously been reported in nitride or oxygen phosphors. Therefore systematic models for the substitution of rare earth elements were used to explain this phenomenon. Fig. 7 is a schematic diagram of the tunable space size of Eu2+ in Mg3N2. When substitution occurs, it will always cause a contraction of the lattice for smaller ions and an expansion of the lattice for larger ions. For Eu2+ introduced into the Mg3N2 structure, the cell lattice will expand because the radius of the Eu2+ ion is larger than that of the Mg2+ ion. Hence the expanded cell lattice reflects a looser and longer Eu–N distance than the original unsubstituted Mg–N of the x = 0 sample. As the Eu2+ activator is introduced, a larger degree of relaxation may occur in the lattice around the Eu2+ ions, which provides a weak covalent coordination environment for the Eu2+ activator. Therefore the photoluminescence will show a blue shift because the Eu2+ accommodation will progressively decrease the covalent character and the crystal field strength with increasing x.
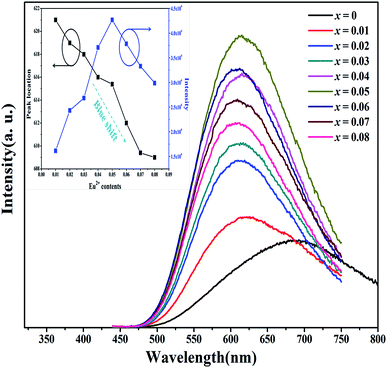 |
| | Fig. 6 Emission spectra of Mg3−xN2:xEu2+ (0 ≤ x ≤ 0.08) under excitation at 428 nm (inset shows the dependence of the peak position and emission intensity on the Eu2+ ion concentration). | |
 |
| | Fig. 7 Schematic diagram for (a) host Mg3N2 and (b) the tunable space size of Eu2+ in Mg3N2. | |
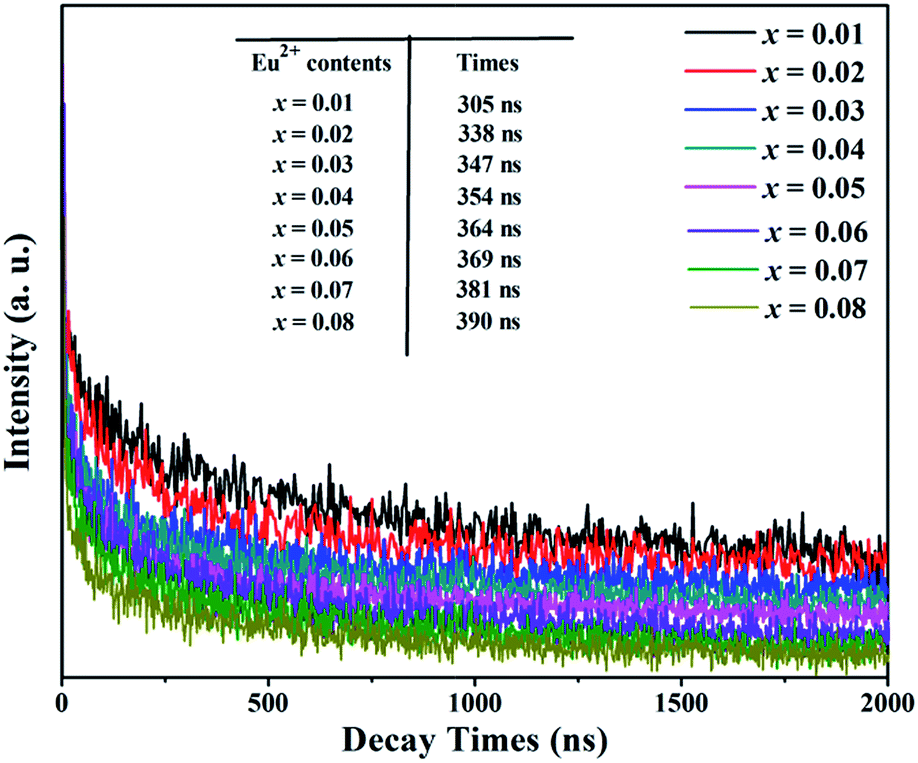
To confirm that the broadband emission originated from the Eu2+ sites, the room temperature lifetimes were measured (Fig. 8). All the samples were excited at 428 nm and monitored at 621 nm. The effective lifetimes of the decay curves for Eu2+ emission were evaluated using the equation:28
| |
 | (3) |
 |
| | Fig. 8 Decay curves of the Mg3−xN2:xEu2+ phosphors with different Eu2+ contents. | |
The calculated decay times were 305, 338, 347, 354, 364, 369, 381 and 390 ns. The values of decay times are identifiable for the 5d–4f transitions of Eu2+, usually μs.29 This shows that the decay times decrease monotonically with an increase in the Eu2+ content, which is typical of energy transfer and eventually causes concentration quenching.
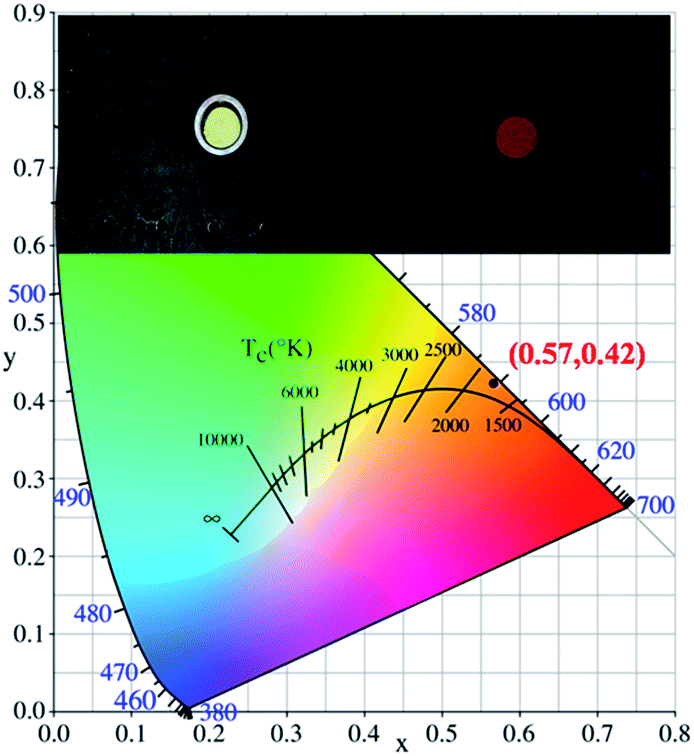
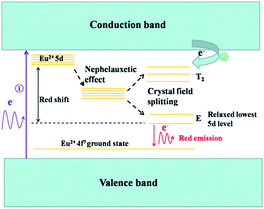
Fig. 9 shows a schematic diagram of the energy levels of the red-emitting Mg3N2:Eu2+ phosphors. The energy level diagram was suggested from spectroscopic analyses of the diffuse reflectance and PLE spectra. Mg3N2:Eu2+ is indirectly excited under N-UV irradiation. The electrons transfer from the valance band to the conduction band (① in Fig. 9) because the excitation energy is larger than the bandgap energy of the host crystal. As reported by Dorenbos,30 when the highest excited energy level is close to the conduction band, the electrons located in the conduction band contributes to the emission of light. Therefore particle electrons located at the conduction band relax to the excited state along the route ②, which corresponds to the near band edge excitation. Subsequently, the broad red emission of Eu2+ is followed by radiative decay from the relaxed lowest 5d band to the 4f ground state. Fig. 10 shows the Commission International de l'Eclairge chromaticity of the Mg2.95N2:0.05Eu2+ phosphor. On excitation at 428 nm, the phosphor emits a red light with chromaticity coordinates of (0.57, 0.42).
 |
| | Fig. 9 Schematic diagram of the energy levels of Eu2+ in Mg3N2. | |
 |
| | Fig. 10 CIE coordinates of the Mg2.95N2:0.05Eu2+ phosphor. Inset shows Mg2.95N2:0.05Eu2+ phosphor in daylight and on excitation at 365 nm in UV box. | |
3.5 Temperature stability
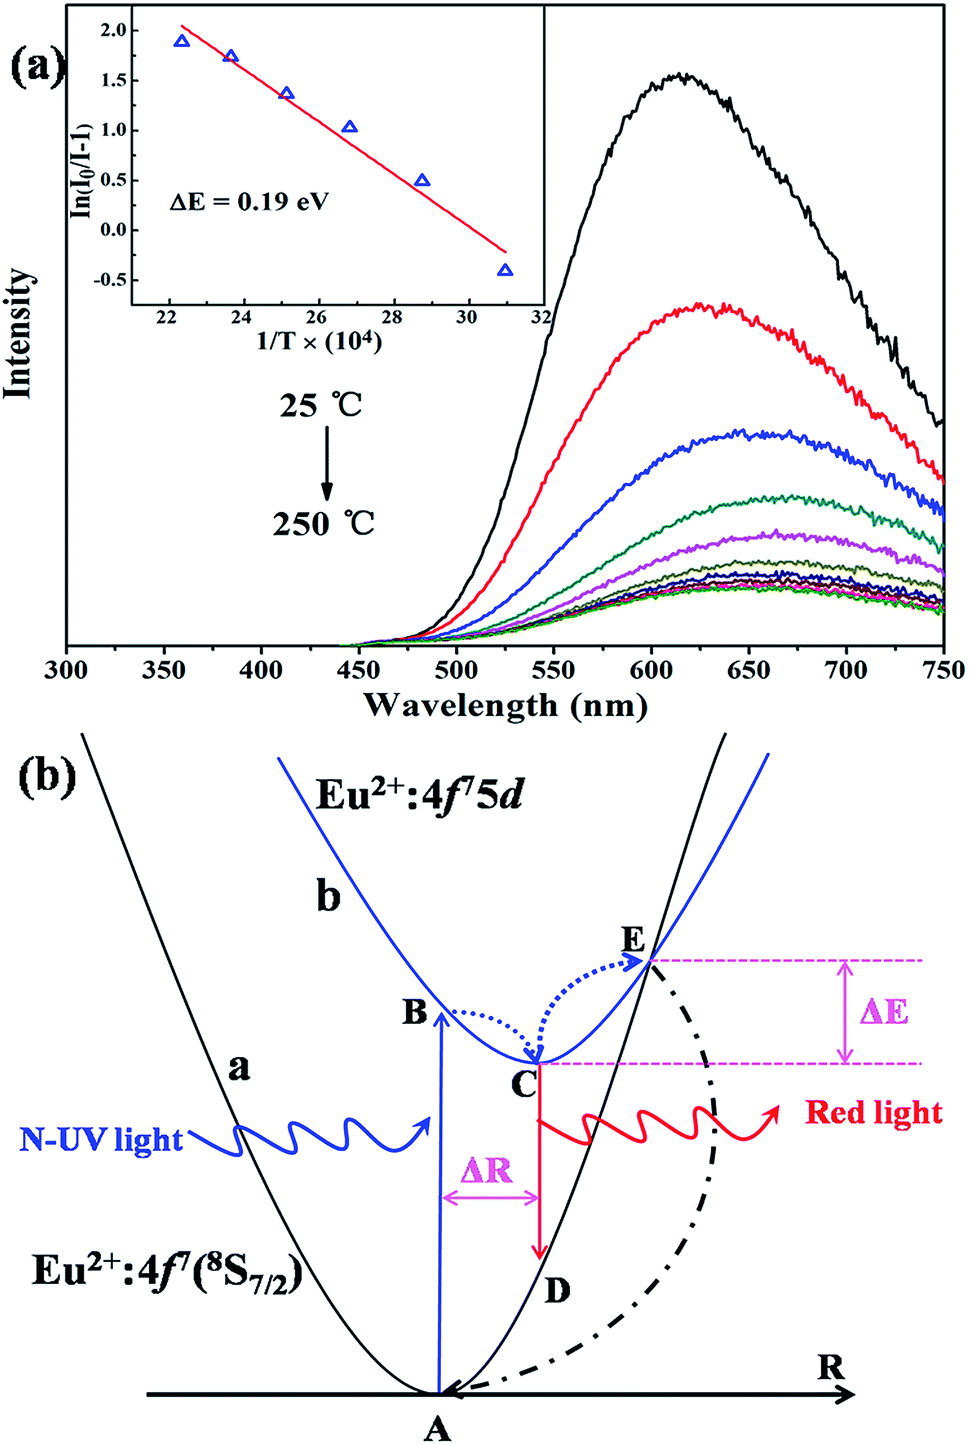
The thermal stability of phosphors is an important issue to be considered in their application in high-power LEDs. Fig. 11a show the temperature-dependent relative emission intensity of Mg3N2:0.05Eu2+ under 428 nm excitation. The thermal properties rapidly decrease with increasing temperature and the intensity decreases to 21% (150 °C) of the initial value. The large thermal quenching corresponds to the large Stokes shift. To further understand the temperature dependence of the PL, the activation energy was calculated using the Arrhenius equation:31| |
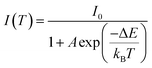 | (4) |
where I0 and I(T) refer to the PL intensity at the initial temperature and testing temperature T, respectively. ΔE is the activation energy, A is a constant and kB is Boltzmann's constant. The inset of Fig. 11a plots ln[(I0/I)] vs. 1/(kBT) and shows a straight line from 25 to 250 °C with slope ΔE. The value of ΔE was 0.19 eV, which is smaller than that of a commercial nitride phosphor.32 This phenomenon of large thermal quenching can be explained by the configurational coordinate diagram in Fig. 11b. To simplify the discussion, we assumed that the excited states and ground states of Eu2+ can be expressed by a single curve. Curves a and b represent the ground and excited states of Eu2+, respectively. A and C are the lowest positions of curves a and b. B and D are points on the b and a curves. E is the crossing point of a and b. ΔE is the energy difference between C and E. ΔR is the change from the ground state to the excited state along the R axis, which we called the Stokes shift. The system was initially in the 4f7(8S7/2) ground state, indicated by point A on parabola a. Under N-UV light, the electrons were excited to the excited state from A to point B on parabola b. At room temperature, most of the electrons fell to point C by the subsequent lattice relaxation and return to the ground state from C to D, producing the red emission of Eu2+. With increasing temperature, however, more electrons overcame the barrier ΔE under electron–phonon coupling and directly tunnelled to the ground state point A, which resulted in the rapid decrease in the observed luminescence intensity. This explains why a large Stokes shift will result in a small ΔE and a large degree of thermal quenching.
 |
| | Fig. 11 (a) Temperature dependence of emission spectra of Mg2.95N2:0.05Eu2+ excited at 428 nm and (b) configurational coordinate diagram of the ground and excited states of Eu2+. | |
The other spectral feature is the red shift of the peak positions in the emission spectra with increasing temperature. This red shift can be explained by the Varshini equation for temperature dependence33
| |
 | (5) |
where
E(
T) is the energy difference between the excited state and the ground state at temperature
T,
E0 is the energy difference at 0 K, and
a and
b are fitting parameters. At high temperatures the symmetry of the luminescent centre is distorted by the change in bond length, which enhances the John–Teller effect.
34 This leads to a decrease in the transition energy and the emission peak is red-shifted as the temperature increases.
4. Conclusion
A novel Eu-doped red-emitting Mg3N2:Eu2+ phosphor was successfully synthesized via a solid-state reaction at constant pressure and low temperature. The crystal structure, bandgap and photoluminescence properties were investigated. Under N-UV irradiation, the Mg3N2:Eu2+ phosphor exhibited a broad red emission centred at about 612 nm. An anomalous blue shift in the emission spectra was observed with increasing Eu2+ concentration. The relationship between the structure and the photoluminescence properties was investigated. These results may be useful in anticipating the photoluminescent properties of nitride phosphors with similar structures to Mg3N2 doped with rare earth elements.
Acknowledgements
This work was supported by the Specialized Research Fund for the Doctoral Program of Higher Education (no. 20120211130003), the National Natural Science Funds of China (grant no. 51372105) and the Fundamental Research Funds for the Central Universities (no. lzujbky-2014-231). We thank for the Gansu Province Development and Reform Commission for support.
Notes and references
- S. Nakamura, T. Mukai and M. Senoh, Appl. Phys. Lett., 1994, 64(13), 1687–1689 CrossRef CAS.
- W. B. Im, S. Brinkley, J. Hu, A. Mikhailovsky, S. P. DenBaars and R. Seshadri, Chem. Mater., 2010, 22, 2842 CrossRef CAS.
- P. P. Dai, X. T. Zhang, L. L. Bian, S. Lu, Y. C. Liu and X. J. Wang, J. Mater. Chem. C, 2013, 1, 4570–4576 RSC.
- F. Kang, H. Zhang and L. Wondraczek, et al., Chem. Mater., 2016, 28(8), 2692–2703 CrossRef CAS.
- M. Peng, X. Yin and P. A. Tanner, et al., Chem. Mater., 2015, 27(8), 2938–2945 CrossRef.
- Z. Y. Mao, Y. C. Zhu, L. Gan, F. F. Xu, Y. Wang and D. J. Wang, J. Mater. Chem., 2012, 22, 824–826 RSC.
- W. R. Liu, C. W. Yeh, C. H. Huang, C. C. Lin, Y. C. Chiu, Y. T. Yeh and R. S. Liu, J. Mater. Chem., 2011, 21, 3740–3744 RSC.
- X. F. Li, J. Budai, F. Liu, J. Howe, J. H. Zhang, X. J. Wang, Z. J. Gu, C. J. Sun, R. S. Meltzer and Z. W. Pan, Light: Sci. Appl., 2013, 2, e50 CrossRef.
- P. Pust, V. Weiler and C. Hecht, et al., Nat. Mater., 2014, 13(9), 891–896 CrossRef CAS PubMed.
- P. Pust, F. Hintze and C. Hecht, et al., Chem. Mater., 2014, 26(21), 6113–6119 CrossRef CAS.
- F. Hintze, N. W. Johnson and M. Seibald, et al., Chem. Mater., 2013, 25(20), 4044–4052 CrossRef CAS.
- Z. Lenčéš, K. Hirao and Y. Yamauchi, et al., J. Am. Ceram. Soc., 2003, 86(7), 1088–1093 CrossRef.
- Y. Kojima, Y. Kawai and N. Ohba, J. Power Sources, 2006, 159(1), 81–87 CrossRef CAS.
- U. Ash-Kurlander, G. E. Shter and S. Kababya, et al., J. Phys. Chem. C, 2013, 117(3), 1237–1246 CAS.
- Y. Uenaka and T. Uchino, J. Phys. Chem. C, 2014, 118(22), 11895–11901 CAS.
- S. R. Römer, P. Kroll and W. Schnick, J. Phys.: Condens. Matter, 2009, 21(27), 275407 CrossRef PubMed.
- K. Takahashi, K. Yoshimura and M. Harada, et al., Sci. Technol. Adv. Mater., 2016 DOI:10.1088/1468-6996/13/1/015004.
- A. C. Larson and R. B. Von Dreele, General Structure Analysis System, LANSCE, MS-H805, Los Alamos, New Mexico, 1994 Search PubMed.
- J. K. Burdett and T. J. McLarnan, J. Am. Chem. Soc., 1982, 104(19), 5229–5230 CrossRef CAS.
- R. D. Shannon, Acta Crystallogr., Sect. A: Cryst. Phys., Diffr., Theor. Gen. Crystallogr., 1976, 32(5), 751–767 CrossRef.
- Z. G. Xia, Y. Y. Zhang, M. S. Molokeev, V. V. Atuchin and Y. Luo, Sci. Rep., 2013, 3, 3310 Search PubMed.
- M. L. Balmer, Y. L. Su, H. W. Xu, E. Bitten, D. McCready and A. Navrotsky, J. Am. Ceram. Soc., 2001, 84(1), 153 CrossRef CAS.
- G. Cao, L. K. Rabenberg, C. M. Nunn and T. E. Mallouk, Chem. Mater., 1991, 3, 149–156 CrossRef CAS.
- Y. Kim, J. Kim and S. Kang, J. Mater. Chem. C, 2013, 1(1), 69–78 RSC.
- Z. Zhang, M. Otmar and A. Delsing, et al., J. Mater. Chem., 2012, 22(19), 9813–9820 RSC.
- C. M. Fang, R. A. De Groot and R. J. Bruls, et al., J. Phys.: Condens. Matter, 1999, 11(25), 4833 CrossRef CAS.
- Z. Xia, X. Wang, Y. Wang, L. Liao and X. Jing, Inorg. Chem., 2011, 50, 10134–10142 CrossRef CAS PubMed.
- F. P. Du, Y. Nakai, T. Tsuboi, Y. Huang and H. J. Seo, J. Mater. Chem., 2011, 21, 4669 RSC.
- S. H. M. Poort, A. Meyerink and G. Blasse, J. Phys. Chem. Solids, 1997, 58, 1451 CrossRef CAS.
- P. Dorenbos, J. Phys.: Condens. Matter, 2003, 15, 2645–2665 CrossRef CAS.
- S. Bhushan and M. V. Chukichev, J. Mater. Sci. Lett., 1988, 7(4), 319–321 CrossRef CAS.
- X. Piao, K. Machida and T. Horikawa, et al., Chem. Mater., 2007, 19(18), 4592–4599 CrossRef CAS.
- Y. P. Varshini, Physica, 1967, 34, 149 CrossRef.
- R. Englman, The Jahn-Teller effect in molecules and crystals[M], Wiley-Interscience, New York, 1972 Search PubMed.
|
| This journal is © The Royal Society of Chemistry 2016 |
Click here to see how this site uses Cookies. View our privacy policy here.