DOI:
10.1039/C6RA13990F
(Paper)
RSC Adv., 2016,
6, 80994-81000
Recovery of ITO nanopowder from a waste ITO target by a simple co-precipitation method
Received
30th May 2016
, Accepted 18th August 2016
First published on 19th August 2016
Abstract
A simple co-precipitation method was used to recover ITO as a nanopowder from the waste ITO target residue in sputtering chambers. The waste ITO target was dissolved in HCl and then ammonia solution was added to make indium tin hydroxide (ITO precursor). After heat treatment up to 400 °C for 6 h, the colour of the ITO precursor changed from white to yellow. The prepared ITO nanopowder was homogeneous with a size of 10 nm and a polycrystalline structure. Over 95 wt% of ITO was recovered using this method. The In/Sn weight ratio was estimated to be 10![[thin space (1/6-em)]](https://www.rsc.org/images/entities/char_2009.gif) :1, which is very close to commercial ITO. We tried to scale-up the preparation procedure by 20 times to reduce the amount of acid for a more environmentally friendly approach. The particle size was about three times larger than that obtained from the small scale and the In/Sn ratio was slightly different. However, they were still close to commercial ITO.
:1, which is very close to commercial ITO. We tried to scale-up the preparation procedure by 20 times to reduce the amount of acid for a more environmentally friendly approach. The particle size was about three times larger than that obtained from the small scale and the In/Sn ratio was slightly different. However, they were still close to commercial ITO.
Introduction
Indium tin oxide (ITO) is widely used in transparent conductive electrodes (TCE) for flat panel displays because it has shown excellent electrical conductivity and optical transparency. For these reasons, the consumption of ITO has increased during the last few decades. Indium is a rare material on earth. Nevertheless, it is used in many industrial fields. The world's reserve of indium is 16000 tons while the current annual consumption is about 1400 tons.1 Due to expected indium resource depletion and a subsequent rapid rise in price, several countries have monopolized indium business to control the price. The price of indium has been increasing rapidly. According to the Metal Bulletin, indium price increased by 41.4% from $495/kg in Dec. 2012 to $700/kg in Dec. 2014.2 Therefore, many countries that consume this material without a local supply have difficulties in the production of TCE. Nowadays, the study of TCE without indium has become a hot issue with materials such as graphene,3,4 metal nanowire,5 conducting polymer6 and zinc oxide.7 However, these materials cannot fully replace ITO yet. This is not only because the manufacturing process for TCE is difficult and the cost is high, but also because electrical conductivity and optical transparency problems can occur. ITO can only be used as a basic TCE material until the next decade. Indium is also used in the solar industry. Murphy et al.8 and Chung et al.9 reported that the Copper Indium Gallium Selenide (CIGS) solar industry is expected to increase rapidly and therefore the consumption of indium will increase. Consequently, the global indium resource is being exhausted owing to flat panel display (FPD) and CIGS solar industry growth. One way to avoid the supply difficulty is the recovery or recycling of secondary indium production i.e. discarded liquid crystal display (LCD),10–12 CIGS solar cell13 and waste sputtering target.14–18 Among these, waste sputtering targets are very important because the amount of discarded indium resources is much higher than in other secondary indium productions. ITO targets are usually used for the ITO coated onto glass substrates with the magnetron sputtering method. However, in this process, less than 30% of the ITO target is used and 70% remains in the chamber in the form of sludge.19 For these reasons, many research groups have performed studies on the recovery and recycling of indium (or ITO) from secondary indium production. Several recovery methods have been reported such as solvent extraction,13,14,20–23 spray pyrolysis,16 vacuum metallurgy separation.24,25 Among these, the solvent extraction method using HCl is widely used for the recovery of indium because the HCl shows effective leaching properties of the ITO.14,20,22,23 However, recently most studies of recovery or recycling are solvent extraction and only focused on the recovery of indium itself. Studies related to the recovery of ITO nanopowder from secondary indium production hardly exist. Obviously, the recovery of indium is very important. However, the main demand for indium in related industries is in the form of ITO.26 Therefore, we concluded that the direct preparation of ITO without separating the indium and tin from ITO target waste is economically efficient for the industrial field by reducing the number of steps involved.
Recently, Cha et al.18 reported preparation of ITO ink from waste ITO scrap. However, the formation mechanism of ITO nano powder and scaled up for application to the industrial field were not discussed. In this study, we focused our attention on the recovery of reusable ITO nanopowder from waste ITO targets by using the co-precipitation method and investigation of characteristics such as thermal behavior, crystal structure, particle size, composition, chemical state, and In/Sn ratio for the as-prepared ITO nanopowder. Furthermore, we studied the feasibility of mass production and a more environmentally friendly approach.
Experiment
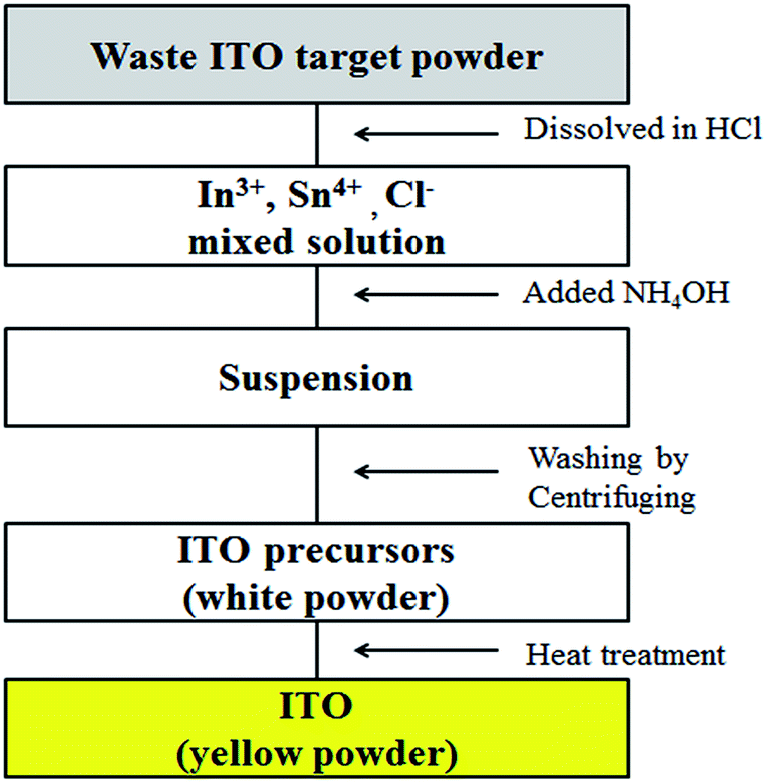
A waste ITO sputtering target was received from the KETI research institute (Dr Hong). Hydrochloric acid (extra pure grade, 36%, Samchun Chemical, Seoul, Korea) was used as a dissolving agent. Ammonia solution (extra pure grade, 28%, Samchun Chemical, Seoul, Korea) was used to prepare the ITO precursor. 1.0 g of waste ITO target powder (dark gray) and 30 mL of HCl were added to a 100 mL round bottom flask equipped with a magnetic stirring bar and reflux condenser. The flask containing the reaction mixture was placed in a silicone oil bath and heated to 100 °C for 2 h with vigorous stirring. After all the waste ITO target powder was dissolved in HCl, the solution was cooled to room temperature. NH4OH was added dropwise (1.5 mL min−1) to the solution until the pH reached about 9.6 with vigorous stirring for 2 h until a suspension of the ITO precursor (white) appeared. The suspension included the ITO precursor and NH4Cl by-product. The product was centrifuged and washed five times with deionized water to remove the by-product NH4Cl. The white ITO precursor powder was dried in an oven at 60 °C for 12 h. Finally, nano sized pure ITO powder (yellow) was obtained after heat treatment up to 400 °C for 6 h. The preparation process for ITO nano-particles using the co-precipitation method is summarized in Scheme 1. Thermogravimetric and differential thermal analysis (TGA/DTA) curves were obtained in the range of ambient temperature to 1000 °C with a heating rate of 10 °C min−1 in air at atmospheric pressure by using Seiko Exstar 7300. The surface morphology and size of the ITO nanopowder were obtained by field-emission scanning microscopy (FESEM: JEOL JSM-7000F) and high-resolution transmission electron microscopy (HRTEM: JEOL JEM ARM 200F). The chemical composition was observed by using energy dispersive X-ray spectroscopy (EDS). The chemical states of ITO were also investigated with X-ray photoelectron spectroscopy (XPS: VG Microtech ESCA2000), using Al Kα radiation as the exciting source. All binding energies (BE) were referenced to the C 1s peak at 284.6 eV. Powder X-ray diffraction (PXRD) patterns were obtained by Rigaku MAX-2200 using Cu Kα radiation. The surface area and average particle size were calculated from N2 adsorption–desorption isotherms at 77 K by using BELSORP II-mini volumetric adsorption equipment. The In and Sn compositions were determined by inductively coupled plasma (ICP, Perkin Elmer, ICP Optima 43DV) analysis.
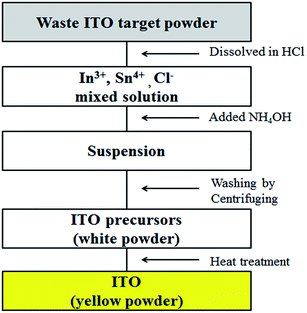 |
| | Scheme 1 Process for ITO nanopowder prepared from waste ITO target. | |
Result and discussions
ITO nanopowder was prepared from the waste ITO target following using co-precipitation method in that pH control of ITO dissolved solution and heat treatment on ITO precursors were very important. Fang27 reported that high pH value increases the ITO yield and conversion rate for indium from co-precipitate solution (In3+ + Sn4+). Hence, the pH was controlled up to 9.6 for the precipitation of both In(OH)3 and Sn(OH)4. The formation of ITO was attributed to the thermal dehydration of In(OH)3 and Sn(OH)4 mixture, according to the following chemical reactions.28| | |
In3+ + Sn4+ → In(OH)3 + Sn(OH)4
| (1) |
| | |
In(OH)3 + Sn(OH)4 → (In1–xSnx)OOH + H2O
| (2) |
| | |
(In1–xSnx)OOH → In2Sn1–xO5–y + H2O
| (3) |
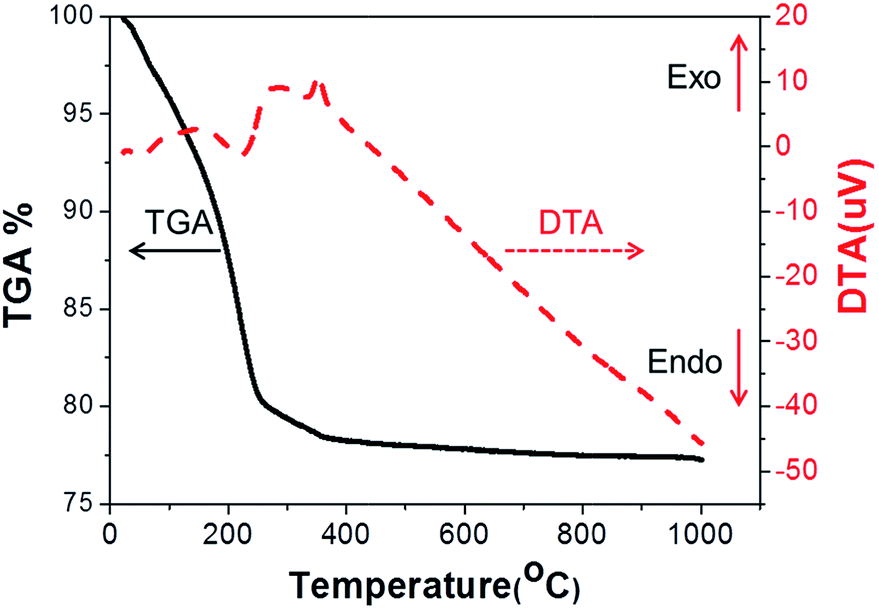
The thermal behaviour of the as-prepared ITO precursor including chemical decomposition and phase transition was confirmed by using TGA/DTA. As shown in Fig. 1, TG analysis showed three weight loss stages in the temperature range of 23–1000 °C. In the first stage, weight loss of 9.2% was observed in the range of 23–170 °C corresponding to the evaporation of physically adsorbed water and solvent.29 Therefore, a small and broad endothermic DTA peak was also observed. Greater weight loss of 10.4% between 170 and 252 °C was observed in the second stage, during which the DTA curve showed an endothermic reaction. These results indicate that phase transition from the mixture of In(OH)3 and Sn(OH)4 to In1–xSnxOOH (InSnOOH) (eqn (2)). InSnOOH was formed as an intermediate phase from low heat treatment (<252 °C). For the last stage, weight loss of 1.8% occurred between 252 to 350 °C, which indicates phase transition from InSnOOH to ITO (eqn (3)).30 The DTA curve showed an exothermic peak for the same temperature range due to the formation of crystallized metal oxide at 350 °C.30–33 Therefore, crystallized In2Sn1–xO5–y (ITO) was obtained at higher temperatures (>350 °C). Based on this thermal analysis, the ITO precursor was thermally treated with 400 °C to obtain well crystallized ITO.
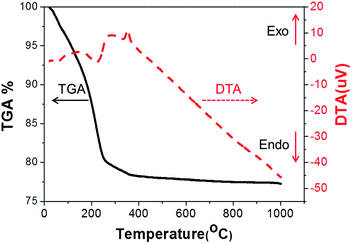 |
| | Fig. 1 TGA (black solid line) and DTA (red dashed line) curve for the ITO precursor. | |
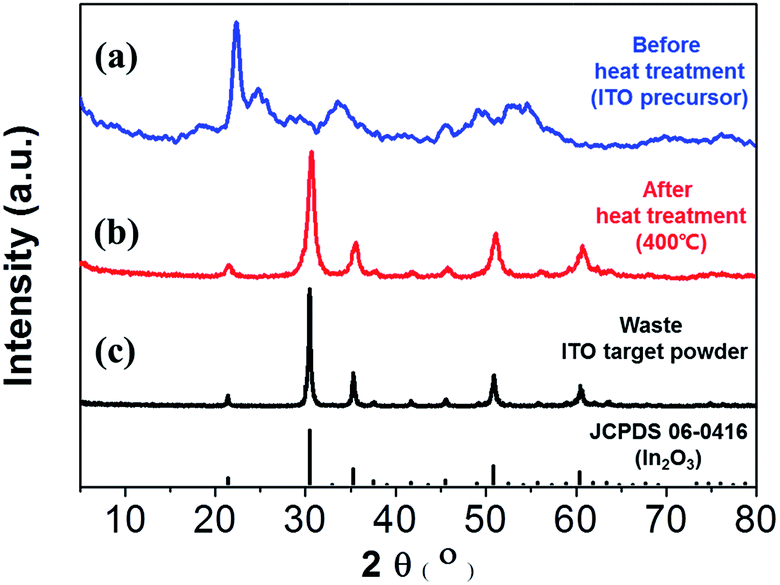
Fig. 2 shows the X-ray diffraction patterns of the waste ITO target powder and the white precipitate before and after heat treatment at 400 °C. Before heat treatment (ITO precursor) appeared amorphous with a little crystalline phase in Fig. 2(a). The heat treatment caused a structural transformation as shown in Fig. 2(b). The peaks with 2θ values of 30.4°, 35.5°, 50.9°, and 60.7° were associated with the crystal planes of (222), (400), (440) and (622), respectively, for ITO.34,35 These planes matched the cubic bixbyite structure of In2O3 (JCPDS no. 06-0416).
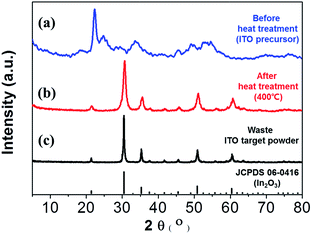 |
| | Fig. 2 Comparison of XRD patterns before heat treatment (a), after heat treatment (b) at 400 °C and waste ITO target powder (c). | |
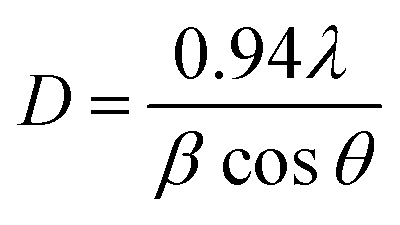
The sharp and strong diffraction peaks such as the (222) plane showed that the ITO was well crystallized. This pattern was compared to that obtained from a waste ITO target as in Fig. 2(c). The two patterns had similar structures. The crystallite sizes of the sample after heat treatment and the waste ITO target powder were estimated with the Debye–Scherrer equation:36
| |
 | (4) |
where
D is the crystallite size,
λ is the X-ray wavelength (0.1541 nm) and
β is the full width at half maximum (FWHM) in radians to the (222) diffraction peak. The after heat treatment and waste ITO target powder were about 10.01 and 43.02 nm in size, respectively. The XRD pattern of the waste ITO target showed very sharp peaks, which was attributed to grain growth during the sintering process.
37 Generally, preparation of the ITO target requires high temperatures (1200–1600 °C) for the sintering process. Therefore, the crystallite size of the waste ITO target was bigger than that of the prepared ITO nanopowder. The diffraction pattern was not observed in SnO
2 because the Sn
4+ ions were doped into the In
2O
3 lattice through a co-precipitation process.
38
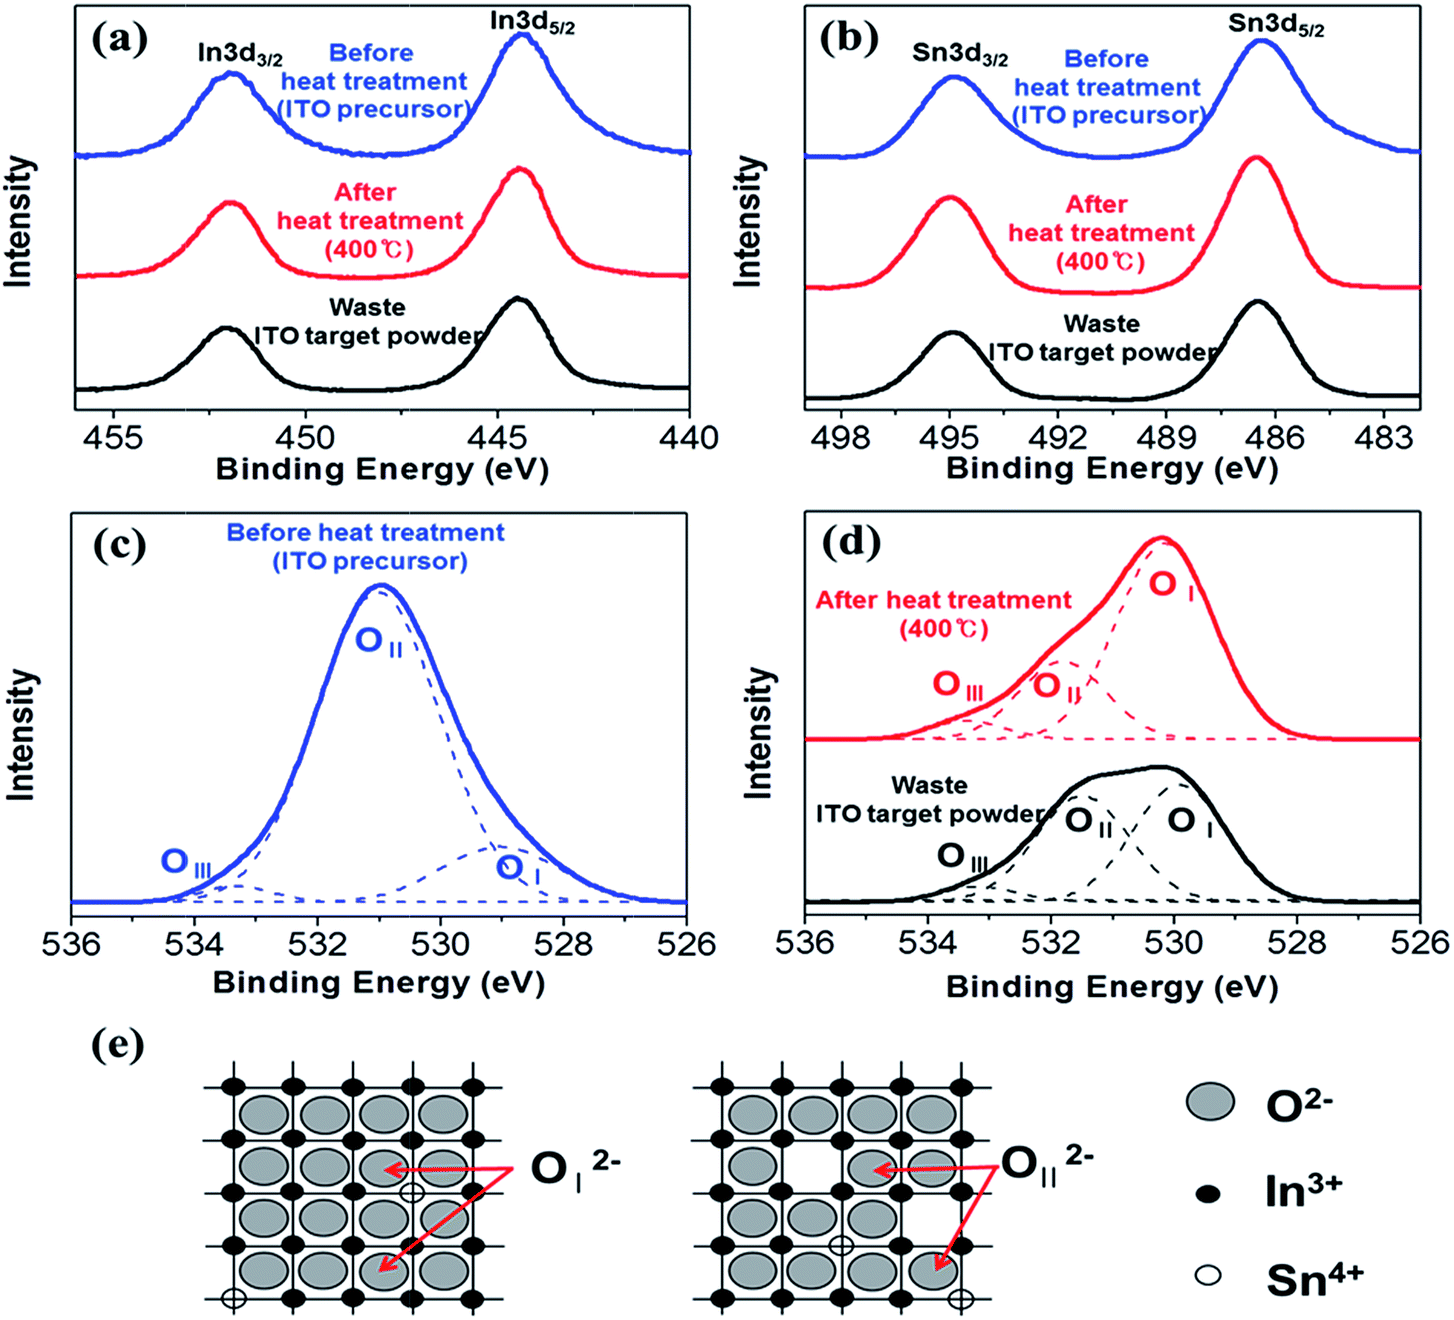
XPS spectra before (top) and after (middle) heat treatment are compared with that of waste ITO target powder (bottom) in Fig. 3. Table 1 summarizes the binding energies (BE) in Fig. 3. As shown in Fig. 3(a), there are two peaks located at 444.4 eV and 451.9 eV for each sample, corresponding to spin–orbit splitting of the In 3d5/2 and In 3d3/2 states, respectively. These correspond to the In3+ bonding state, specifically In2O3. Furthermore, the Sn BE for each sample is shown in Fig. 3(b). The Sn 3d5/2 and Sn 3d3/2 peaks are located at ∼486.5 eV and 494.9 eV, respectively. These values are attributed to the Sn4+ bonding state from SnO2. The In 3d and Sn 3d BEs from the as prepared ITO nanopowder were in excellent agreement with the waste ITO target (Table 1). Fig. 3(c) shows the O 1s XPS spectrum. The spectrum was deconvoluted to three Gaussian–Lorentzian peaks. The original sample showed three component peaks based on OI at 529.0 eV, OII at 531.0 eV, and OIII at 533.3 eV. This demonstrated that the small OI peak was primarily on the outer surface of the ITO precursor.39 The maximum intensity OII peak at 531.0 eV was attributed to the oxygen in metal hydroxide (metal = In, Sn).40 The highest BE of the 533.3 eV peak from OIII may be due to adsorbed water molecules.39,40 On the other hand, OII after heat treatment and in the ITO target powder were not easily assigned as shown in Fig. 3(d). The BE of oxygen in metal hydroxide was overlapped despite the hydroxide to oxide phase transition caused by thermal dehydration. According to the ITO ionic structure (see Fig. 3(e)), the O2− lattice ion was located in two different regions, which were full complements of the six nearest-neighbour O2− ions (OI2−) and oxygen deficient regions (OII2−).41 The BEs after heat treatment were 529.9 and 531.6 eV while those for the waste ITO target powder were 529.9 and 531.5 eV. BEs from the sample after heat treatment were approximately equal to those of the waste ITO target powder. However, the OII peak from the sample after heat treatment showed lower intensity then the OII peak of the waste ITO target because the number of oxygen vacancies differed with the heat treatment temperature. From this result, we can conclude that the number of oxygen vacancies in different samples differed from each other. The lower BE of 529.9 eV indicated a full complement of six nearest-neighbour O2− ions (OI) and the higher BE of 531.5 and 531.6 eV indicated oxygen deficient regions (OII). According to XPS analysis, the chemical states of the as-prepared ITO nanopowder did not change compared with a typical ITO.
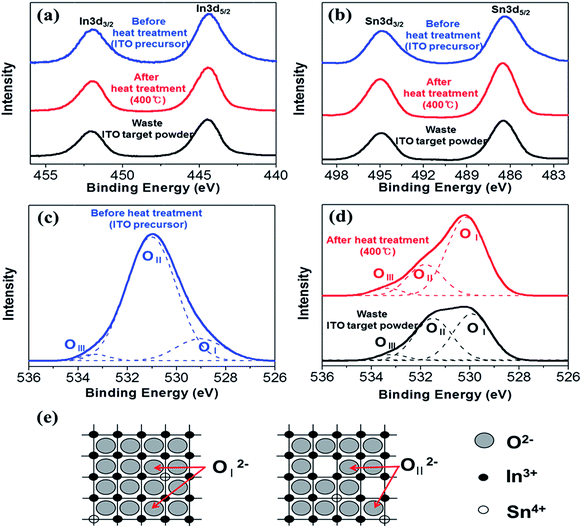 |
| | Fig. 3 XPS spectra of the samples before heat treatment and after heat treatment at 400 °C alongside waste ITO target powder; (a) indium 3d, (b) Tin 3d, (c) oxygen 1s before heat treatment (d) oxygen 1s after heat treatment and (e) schematic diagram of ITO ionic structure.41,42 | |
Table 1 Summary of binding energies
| Sample |
In (3d5/2) (eV) |
Sn (3d5/2) (eV) |
O (1s) (eV) |
| Before heat treatment |
444.4 |
486.4 |
529.0 |
| 531.0 |
| 533.3 |
| After heat treatment |
444.4 |
486.5 |
529.9 |
| 531.6 |
| 533.0 |
| Waste ITO target |
444.4 |
486.5 |
529.9 |
| 531.5 |
| 533.2 |
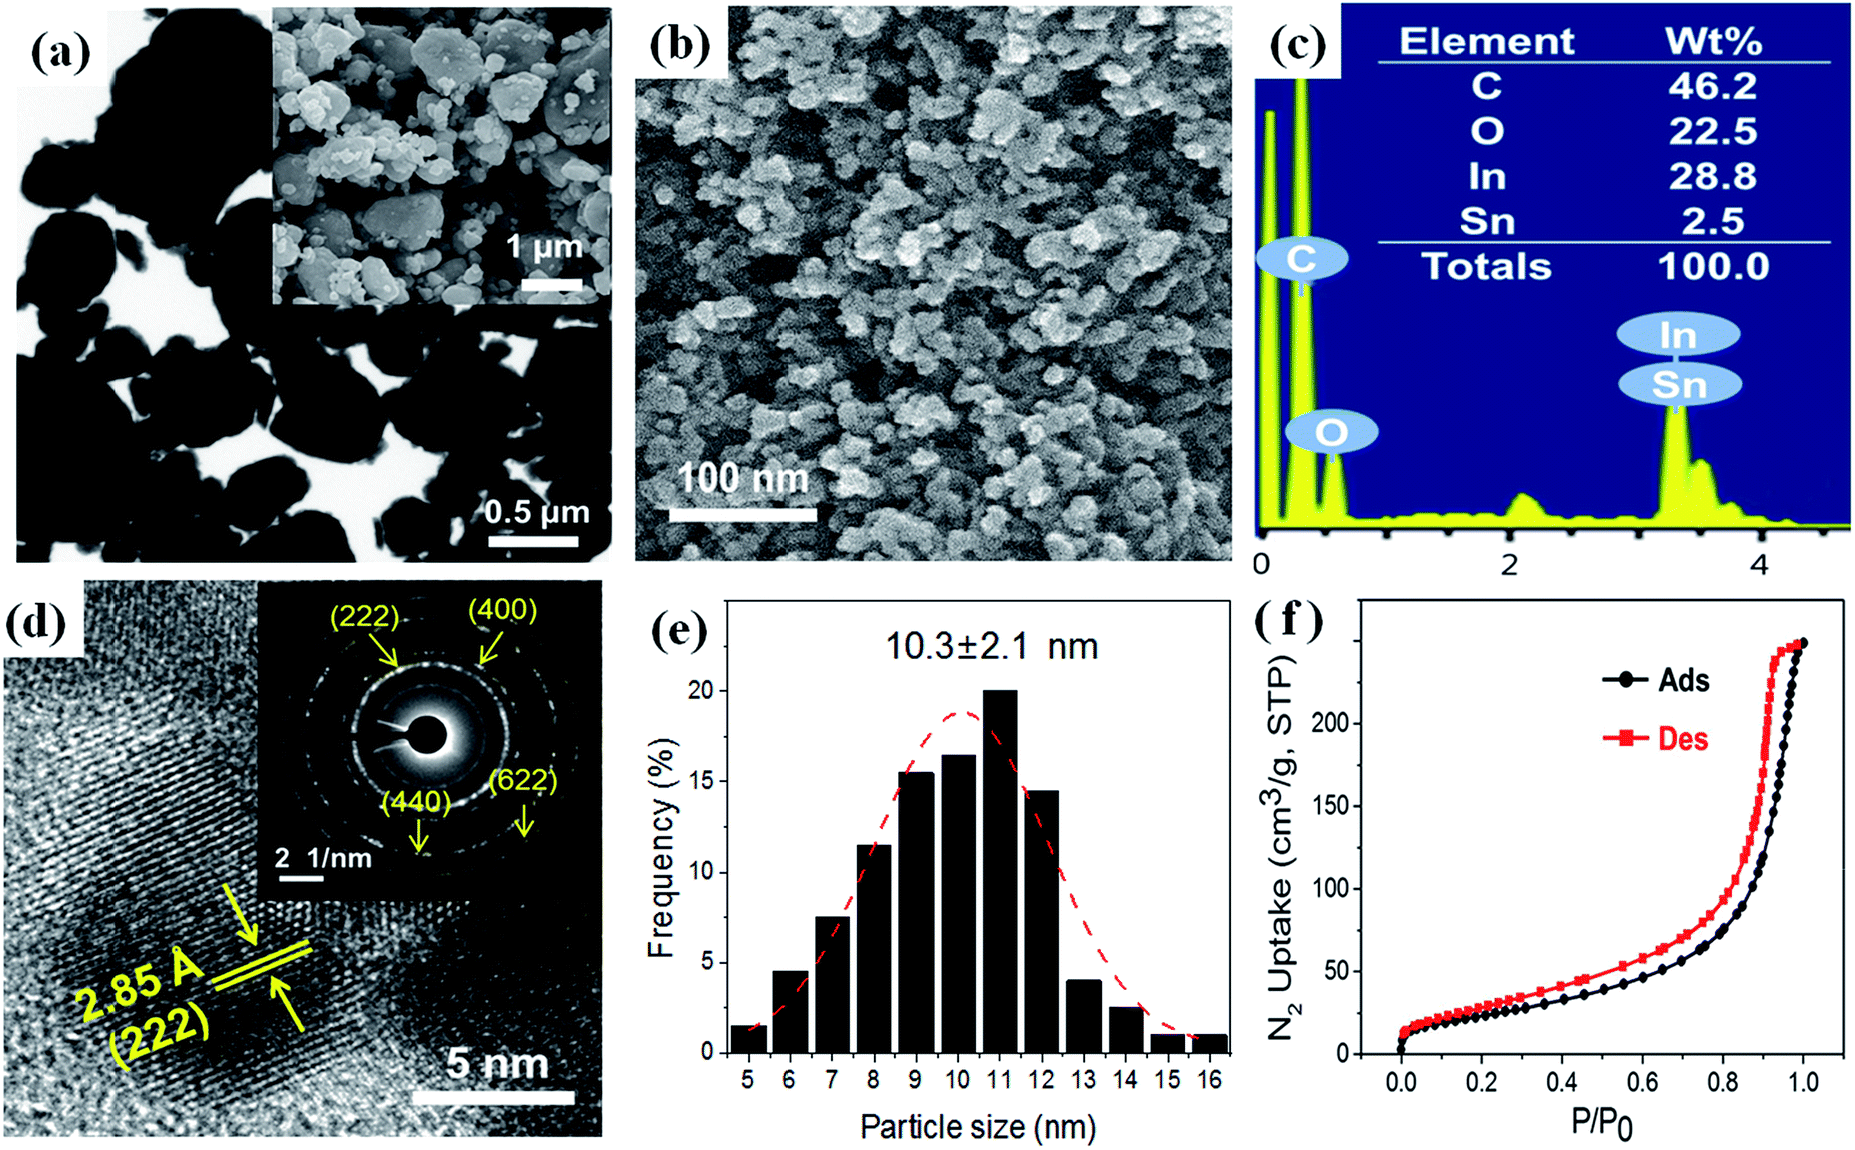
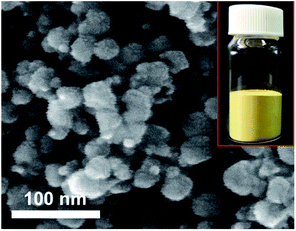
The shape and composition of the as-prepared ITO nanopowder were characterized by using FESEM, HRTEM, SAED and EDS. Fig. 4(a), the waste ITO target powder shows irregular shapes in micro size. On the other hands, as-prepared ITO powder showes an aggregated form of the homogeneous spheres of and nano scale as shown in Fig. 4(b). According to EDS analysis in the Fig. 4(c), the prepared ITO consists of O, In, and Sn. The weight ratio of In and Sn was estimated to be 11.5:1, which is in good agreement with the original ITO target. The HRTEM image in Fig. 4(d) shows that the interplanar d spacing of the prepared ITO nano particle was about 2.85 Å, which corresponds to the (222) lattice plane of In2O3. Fig. 4(d) inset, the SAED pattern of the as-prepared ITO nanopowder shows the polycrystalline diffraction rings indexed to the (222), (400), (440) and (622) planes indicating the polycrystalline structure of the ITO. This results show good agreement with the XRD pattern.
 |
| | Fig. 4 Characterization results of as-prepared ITO (b–f) and compared to the shape of waste ITO target powder (a); (a) TEM image (inset shows FESEM image) of waste ITO target powder, characterization of as-prepared ITO (b) FESEM image (c) EDS spectrum (d) HRTEM image (inset shows SAED pattern), (e) particle size distribution histogram (f) nitrogen adsorption–desorption isotherms curve. | |
The average particle sizes and distribution were determined by measuring 200 particles in random regions as shown in Fig. 4(e). The average size of the ITO nano particles was 10.3 ± 2.1 nm. Fig. 4(f) shows the nitrogen adsorption–desorption isotherms curve at 77 K for ITO nanopowder and a surface area of 87.69 m2 g−1 was obtained. The BET curve shows a typical type II isotherm, which indicated a non-porous material.43 BET analysis can also be used to approximate the particle size by using following equation.44
| |
 | (5) |
where
S is the BET surface area,
ρ is the solid density,
d is the particle size. The mean particle size of the calculated ITO nanopowder was about 9.6 nm, which is in reasonable agreement with the HRTEM results.
The weight percentages of the In and Sn compositions were determined for each sample by ICP analysis and are summarized in Table 2. The composition of In and Sn in the as-prepared ITO nanopowder were about 72.6 wt% and 7.4 wt%, respectively. The In and Sn weight ratio were estimated to be 9.8:1, which is in good agreement with the ITO target.
Table 2 Summary of indium and tin compositions by ICP analysis
| Elements |
Unit: (wt%) |
| ITO target |
In/SnOH |
Prepared ITO |
| In |
70.2 |
56.5 |
72.6 |
| Sn |
6.9 |
5.8 |
7.4 |
| In/Sn |
10.2 |
9.7 |
9.8 |
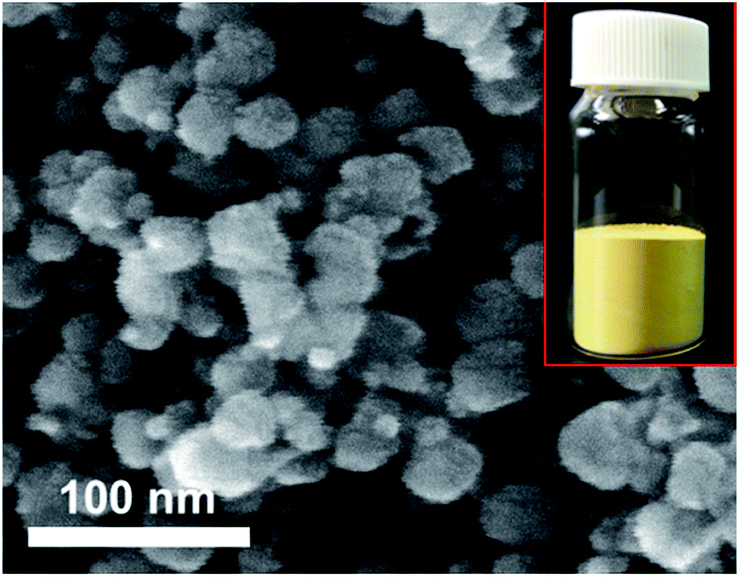
The prepared ITO nanopowder should be scaled up for application to the industrial field. We carried out an experiment to scale up the powder preparation 20 fold. The prepared ITO powder is shown in Fig. 5 inset and has a similar colour to commercial ITO. We obtained the prepared ITO nanopowder (19.1 g) from waste ITO target (20 g) with a high recovery yield (95.5%). In this case, the particle size was about three times larger than the 1 g scale as shown in Fig. 5. Even though the particle size changed, the samples still had similar or smaller sizes compared to commercial ITO nanopowder.
 |
| | Fig. 5 SEM image of ITO nanopowder prepared by scale-up. | |
The acid is absolutely necessary material in industrial field such as semiconductor cleaning/etching and metal smelting/refining etc. Critical environmental problems such as soil acidification and acid rain have been partly attributed to the use of the acid. We considered that reducing the use of the acid is helping to solve these environmental problems. In this study, HCl is necessary for dissolution of the waste ITO target. 600 mL of HCl was needed to dissolve 20 g of waste ITO target powder using the conventional process. Therefore, we reduced to half the amount of HCl required, creating an environmentally friendly approach. The In and Sn compositions and the In/Sn ratio were determined for each sample by ICP analysis and are summarized in Table 3. 20 g of waste ITO target powder was dissolved in 600 mL of HCl and the composition of In and Sn were determined to be 72.5 wt% and 7.3 wt%, respectively. After reduction of the amount of HCl to half, the composition of In and Sn were 73.3 wt% and 7.5 wt% respectively. Furthermore, the dissolution time for the ITO target powder was increased by 2.3 times, and we could prepare large scale ITO nanopowder with a more environmentally friendly process. With a reduced amount of HCl, longer reaction times and energy are required for dissolving the ITO target. According to our results, the compositions changed slightly after reducing the amount of HCl used, however, the In/Sn ratio was very close to commercial ITO.
Table 3 Amount of HCl depending on indium and tin composition
| Sample |
Unit (%) |
| Prepared ITO using HCl 600 mL (scale-up) |
Prepared ITO using HCl 300 mL (scale-up) |
| In |
72.5 |
73.3 |
| Sn |
7.3 |
7.5 |
| In/Sn ratio |
9.9 |
9.8 |
Conclusions
We have successfully recovered ITO nanopowder from waste ITO target by using a co-precipitation method. This method can be used easily and inexpensively to recover ITO. Furthermore, it has a high recovery yield of 95.5%. Thermal phase transition for the prepared ITO nanopowder was confirmed by thermal analysis. The ITO precursor to the ITO phase transformation occurred between 252 and 350 °C with thermal dehydration. We obtained well crystallized ITO after heat treatment at 400 °C and it showed a cubic bixbyite structure. The prepared ITO nanopowder showed a homogeneous spherical shape and the average particle size was 10.3 ± 2.1 nm. We successfully scaled up the synthetic route to prepare 19.1 g of ITO nanopowder for application to the industrial field. The In and Sn compositions and In/Sn ratio of the prepared ITO were in fairly close agreement both at the 1 g scale and for the scale-up results. For a more environmentally friendly approach, we prepared ITO nanopowder on a large scale by reducing to half the amount of HCl needed. The In/Sn ratio was very close to commercial ITO. We anticipate that the ITO nanopowder obtained in this work can be applied to electronic ink in the fabrication of conductive tin film and this procedure could also be applied to recovery works of large scale for use in the industrial field.
Acknowledgements
This paper was supported by the National Research Foundation of Korea (NRF-2016 R1A2B1015504, Y. Son), (NRF-2015M3C1A3002152, W. S. Yun) and (NRF-2015R1D1A1A01060947, D. Choi).
Notes and references
- Global and china ITO sputtering targets industry research report 2013–2016, http://www.researchinchina.com/Htmls/Report/2014/6872.html, accessed 05, 30, 2016.
- Inventory & Metal Bulletin's Price of 99.99% Purity Indium, http://www.smg-indium.com/Docs/SMG_NMV_Current_Price.pdf, accessed 05, 30, 2016.
- W. Du, S. Qi, Y. Zhu, P. Sun, L. Zhu and X. Jiang, Chem. Eng. J., 2015, 262, 658–664 CrossRef CAS.
- L. Wang, Y. Cheng, Z. Liu, X. Yi, H. Zhu and G. Wang, ACS Appl. Mater. Interfaces, 2016, 8, 1176–1183 CAS.
- C. Hwang, J. An, B. D. Choi, K. Kim, S.-W. Jung, K.-J. Baeg, M.-G. Kim, K. M. Ok and J. Hong, J. Mater. Chem. C, 2016, 4, 1441–1447 RSC.
- M. Vosgueritchian, D. J. Lipomi and Z. Bao, Adv. Funct. Mater., 2012, 22, 421–428 CrossRef CAS.
- H. Wagata, N. Ohashi, K.-i. Katsumata, H. Segawa, Y. Wada, H. Yoshikawa, S. Ueda, K. Okada and N. Matsushita, J. Mater. Chem., 2012, 22, 20706–20712 RSC.
- M. D. Murphy, and C. Mikolajczak, Indium Corporation Tech paper, 2011 Search PubMed.
- Y. Chung and C.-W. Lee, J. Electrochem. Sci. Technol., 2012, 3, 95–115 CrossRef CAS.
- D. Choi, S.-J. Hong and Y. Son, Materials, 2014, 7, 7662–7669 CrossRef.
- D. Choi, Y. S. Kim and Y. Son, RSC Adv., 2014, 4, 50975–50980 RSC.
- H. Yoshida, S. Izhar, E. Nishio, Y. Utsumi, N. Kakimori and S. A. Feridoun, Sol. Energy Mater. Sol. Cells, 2014, 125, 14–19 CrossRef CAS.
- Y.-S. Zimmermann, C. Niewersch, M. Lenz, Z. h. Z. Kül, P. F.-X. Corvini, A. Schäffer and T. Wintgens, Environ. Sci. Technol., 2014, 48, 13412–13418 CrossRef CAS PubMed.
- H.-N. Kang, K.-Y. Kim and J.-Y. Kim, Green Chem., 2013, 15, 2200–2207 RSC.
- Y. Li, Z. Liu, Q. Li, Z. Liu and L. Zeng, Hydrometallurgy, 2011, 105, 207–212 CrossRef CAS.
- J.-K. Yu, S.-G. Kang, K.-C. Jung, J.-S. Han and D.-H. Kim, Mater. Trans., 2007, 48, 249–257 CrossRef CAS.
- S.-J. Hsieh, C.-C. Chen and W. C. Say, Mater. Sci. Eng., B, 2009, 158, 82–87 CrossRef CAS.
- S.-J. Cha, S.-J. Hong and J. Y. Lee, J. Korean Phys. Soc., 2015, 67, 986–990 CrossRef CAS.
- G. Phipps, C. Mikolajczak and T. Guckes, Renewable Energy Focus, 2008, 9, 56–59 CrossRef.
- S. Virolainen, D. Ibana and E. Paatero, Hydrometallurgy, 2011, 107, 56–61 CrossRef CAS.
- H. N. Kang, J.-Y. Lee and J.-Y. Kim, Hydrometallurgy, 2011, 110, 120–127 CrossRef CAS.
- J. Yang, T. Retegan, B.-M. Steenari and C. Ekberg, Sep. Purif. Technol., 2016, 166, 117–124 CrossRef CAS.
- T. Kato, S. Igarashi, Y. Ishiwatari, M. Furukawa and H. Yamaguchi, Hydrometallurgy, 2013, 137, 148–155 CrossRef CAS.
- E. Ma, R. Lu and Z. Xu, Green Chem., 2012, 14, 3395–3401 RSC.
- L. Zhan and Z. Xu, Environ. Sci. Technol., 2014, 48, 14092–14102 CrossRef CAS PubMed.
- L. T. Peiró, G. V. Méndez and R. U. Ayres, Environ. Sci. Technol., 2013, 47, 2939–2947 CrossRef PubMed.
- Z. Fang, H. Assaaoudi, R. I. Guthrie, J. A. Kozinski and I. S. Butler, J. Am. Ceram. Soc., 2007, 90, 2367–2371 CrossRef CAS.
- K. Yanagisawa, C. Udawatte and S. Nasu, J. Mater. Res., 2000, 15, 1404–1408 CrossRef CAS.
- C. R. Patra and A. Gedanken, New J. Chem., 2004, 28, 1060–1065 RSC.
- W. Ho and S. Yen, Thin Solid Films, 2006, 498, 80–84 CrossRef CAS.
- N. Fukuda, Y. Watanabe, S. Uemura, Y. Yoshida, T. Nakamura and H. Ushijima, J. Mater. Chem. C, 2014, 2, 2448–2454 RSC.
- M. Seetha, D. Mangalaraj and Y. Masuda, Adv. Sci., Eng. Med., 2011, 3, 202–212 CrossRef CAS.
- A. Solieman, M. Zayed, S. Alamri, N. Al-Dahoudi and M. Aegerter, Mater. Chem. Phys., 2012, 134, 127–132 CrossRef CAS.
- P. S. Devi, M. Chatterjee and D. Ganguli, Mater. Lett., 2002, 55, 205–210 CrossRef.
- A. Kulkarni, K. H. Schulz, T. Lim and M. Khan, Thin Solid Films, 1999, 345, 273–277 CrossRef.
- J. I. Langford and A. Wilson, J. Appl. Crystallogr., 1978, 11, 102–113 CrossRef CAS.
- H. Wang, X. Xu, J. Zhang and C. Li, J. Mater. Sci. Technol., 2010, 26, 1037–1040 CAS.
- B. Xu, B. Yang, Y. Guo, D. Liu, Q. Yu and S. Wei, J. Alloys Compd., 2011, 509, 4538–4542 CrossRef CAS.
- Y.-H. Liau, N. F. Scherer and K. Rhodes, J. Phys. Chem. B, 2001, 105, 3282–3288 CrossRef CAS.
- N. I. Kovtyukhova and T. E. Mallouk, Chem. Mater., 2010, 22, 4939–4949 CrossRef CAS.
- J. C. Fan and J. B. Goodenough, J. Appl. Phys., 1977, 48, 3524–3531 CrossRef CAS.
- J. Kim, P. Ho, D. Thomas, R. Friend, F. Cacialli, G.-W. Bao and S. Li, Chem. Phys. Lett., 1999, 315, 307–312 CrossRef CAS.
- K. S. Sing, Pure Appl. Chem., 1985, 57, 603–619 CrossRef CAS.
- A. B. Corradi, F. Bondioli and A. M. Ferrari, Chem. Mater., 2001, 13, 4550–4554 CrossRef CAS.
|
| This journal is © The Royal Society of Chemistry 2016 |
Click here to see how this site uses Cookies. View our privacy policy here.