Self-organized helical superstructure of photonic cellulose loaded with upconversion nanoparticles showing modulated luminescence

Haijing Jianga, Donglei Zhoub, Dan Qua, Guang Chua, Wen Xub, Hongwei Song*b and Yan Xu*a
aState Key Laboratory of Inorganic Synthesis and Preparative Chemistry, Jilin University, 2699 Qianjin Street, Changchun 130012, China. E-mail: yanxu@jlu.edu.cn
bState Key Laboratory of Integrated Optoelectronics, College of Electronic Science and Engineering, Jilin University, 2699 Qianjin Street, Changchun 130012, China. E-mail: songhw@jlu.edu.cn

Received 28th May 2016 , Accepted 30th July 2016

First published on 1st August 2016


Abstract

The ability to manipulate the color output of nanomaterials is important for applications like optoelectronic devices, light emitting display and lasers. Here, a self-organized helical superstructure of photonic cellulose loaded with upconversion nanoparticles of NaYF4:Yb,Er has been realized. The modulated upconversion luminescence of the photonic composite film of cellulose-NaYF4:Yb,Er has been demonstrated with the mechanism proposed.
Introduction

Cellulose is the most abundant and renewable natural polymer on earth. Its intrinsic attributes render it a promising choice for environmentally friendly applications.1 Cellulose nanocrystals (CNC), derived from natural cellulose (plant, microbial) by sulfuric acid hydrolysis, may self assemble forming a chiral nematic structure showing colorful iridescence when the helical pitch is in the order of the wavelength of visible light. Chirality is largely present in nature. A chiral molecule has point chirality at a single stereogenic atom, for example, an asymmetric carbon is a main feature inducing molecular chirality for biological molecules such as polysaccharides, proteins and DNA.2 A chiral object, such as human hands, that the right hand is the non-superimposable mirror image of the left hand. Brilliant iridescent colors of marble berries are originated from the chiral nematic organization of cellulose in plant cell walls3 and the colorful iridescence of beetle exoskeletons arises from the solid-state chiral nematic assembly of chitin-protein composite fibers.4 Nature showcases fabulous examples of smart materials with unique optical properties rendered by helical organization of mesogens.

Since 2010, considerable attention has been devoted to developing chiral nematic CNC-based functional materials. Among which, CNC has been used as a template for free-standing chiral nematic mesoporous films by direct deposition,5 and by reverse replication.6 By organizing rare-earth species into a chiral nematic structure, ZrO2:Eu3+, Y2O3:Eu3+ and YVO4:Eu3+ have been fabricated showing chiroptical properties.7 By cooperative assembly, a series of new chiral nematic composite films have been developed, to name a few, AgNP–SiO2, AuNR–CNC, AuNC–CNC and poly(p-phenylenevinylene)-organosilica, exhibiting modulated functional activity.8

Upconversion particles are luminescent materials that convert a near-infrared excitation to a visible emission through two-photon or multi-photon processes.9 They are advantageous over organic fluorophores and semiconducting quantum dots due to photochemical stability, narrow emission bandwidths and large anti-Stokes shifts. Upconversion nanoparticles are promising for use as luminescent probes in biological labeling and imaging technology because of their remarkable penetration depth, and the absence of autofluorescence under infrared excitation.10 A photonic crystal is a periodic dielectric nanostructure that affects light propagation. It contains regularly repeating regions of high and low dielectric constant allowing or prohibiting photon propagation depending on the wavelength. Prohibited band of wavelengths is called photonic band gap (PBG). Photonic crystal is capable of driving light propagation along particular directions and stopping it along others, making it ideal for use as a tool to modulate light propagation.11 Though disputable about what happens to the wavelengths at the sides of a band gap, a credible explanation is that a decrease in the density of states within the PBG range is accompanied by an increase in the density of states at the sides of the PBG.12 Studies show that photonic crystals are capable of modulating the spontaneous emission of organic dyes,13 quantum dots14 and rare earth ions.12a It has been shown that the spontaneous emission of upconversion nanoparticles can be modulated when hosted in opal or inverse opal structures.15 A photonic superstructure has been assembled by incorporating chiral molecular switch and upconversion nanoparticles, which shows reversible and tunable reflection by tuning the power density of irradiating near infrared light.16

Chiral nematic CNC is a one-dimensional photonic crystal. It would be worthwhile to explore its capability of modulating the spontaneous emission of upconversion nanoparticles to achieve color tuning. To the best of our knowledge, such work has not been explicitly exploited. Here, we report a free-standing luminescent and iridescent composite film of CNC–NaYF4:Yb,Er by an evaporation-induced coassembly method. NaYF4:Yb,Er, which is a binary dopant system (Yb3+/Er3+), is chosen for its sharp multiple visible emission by near infrared excitation. Owning to the ladder-like arranged energy levels of Yb3+, high-efficiency photon upconversion can be obtained by lamp excitation or continuous wave lasers with moderate excitation densities. Our work demonstrates the ability of the CNC–NaYF4:Yb,Er composite film in modulating the spontaneous emission of NaYF4:Yb,Er, which opens up a new avenue for color tuning of upconversion nanoparticles.

Experimental section

Materials

All chemicals were used as received without further purification. Yttrium nitrate hexahydrate (Y(NO3)3·6H2O, AR 99.5%), ytterbium nitrate pentahydrate (Yb(NO3)3·5H2O, 99.9%) and erbium nitrate pentahydrate (Er(NO3)3·5H2O, 99.9%) were purchased from Aladdin Industry Corporation. Polyethyleneimine (PEI, ca.30% in water) was purchased from TCI Industry Corporation. Sodium chloride (NaCl, AR), ammonium fluoride (NH4F, AR), sulphuric acid (H2SO4, AR) and ethylene glycol (EG, AR) were all purchased from Beijing Chemical Works. Cellulose cotton pulp board was purchased from Hebei Paper Group of China.

Synthesis of cellulose nanocrystal (CNC)

For the preparation of CNC, 50 g of bleached commercial cotton pulp was milled using a commercial pulper containing 1000 mL of deionized water, followed by oven-drying. Next, 30 g of milled pulp was hydrolysed in 300 mL of 64 wt% H2SO4 (1 g pulp/10 mL H2SO4) aqueous solution under vigorous stirring at 50 °C for 90 min. The pulp slurry was diluted with a large amount of cold deionized water to stop the hydrolysis, and allowed to precipitate overnight. The supernate was poured out and the remaining suspension was centrifuged three times to remove all soluble cellulose materials. Finally, the white thick suspension was placed into a Millipore ultrafiltration cell (model 8400) to wash with deionized water, dialysed against slow running water for several days until the pH of solution was stable at about 2.4. The thick pulp slurry from the Millipore cell can be diluted to a desired concentration.

Synthesis of water-soluble NaYF4:Yb,Er

Water-soluble NaYF4:Yb,Er were synthesized through a solvothermal method. 2.5 mmol of NaCl, 1.33 g of PEI, 0.798 mmol of Y(NO3)3·6H2O, 0.20 mmol of Yb(NO3)3·5H2O, and 0.002 mmol Er(NO3)3·5H2O were dissolved in 15 mL EG under vigorous stirring until the solution became transparent. Then 4 mmol of NH4F in 10 mL EG was added to it. Stir until we got a homogeneous solution, and then the whole mixture was transferred into a 25 mL Teflon-lined stainless steel autoclave. The autoclave was sealed and heated at 200 °C for 2 h. After the autoclave cooled down to room temperature naturally, NaYF4:Yb,Er nanoparticles were harvested by centrifugation and washed with deionized water three times, and then redispersed in water for further use.

Synthesis of CNC–(NaYF4:Yb,Er)x

For CNC–(NaYF4:Yb,Er)2.8%, 0.5 mL NaYF4:Yb,Er suspension of a certain concentration was added to 5 mL of 3 wt% CNC suspension and stirred for about two hours to get homogeneous suspension. The mixed suspension was poured into a Petri dish and allowed to evaporate for more or less 3 days under ambient conditions. After dried, an iridescent composite film of CNC–NaYF4:Yb,Er was obtained. By the thermogravimetric measurement, the mass fraction of NaYF4:Yb,Er nanoparticles in the film was 2.8%. In the whole film, the molar amount of the NaYF4:Yb,Er upconversion nanoparticles was 3.55 × 10⁻⁵ mol.

Characterization

Powder X-ray diffraction (XRD) patterns were recorded using a Rigaku D/Max 2550 X-ray diffractometer (Cu K radiation, λ = 1.5406 Å). The surface morphologies were characterized using scanning electron microscopy (SEM), on a JEOL-6700F field emission scanning electron microscope at an accelerating voltage of 3 kV. Transmission electron microscopy (TEM), high resolution transmission electron microscopy (HRTEM) and mapping analyses were conducted on a FEI Tecnai G2S-Twin with a field emission gun operating at 200 kV. UV-visible spectra were recorded by mounting free-standing films perpendicular to the beam path on a Shimadzu UV-1800 UV-visible spectrophotometer. Dynamic Light Scattering (DLS) measurement was conducted on ZETASIZER Nano-ZS90. Circular dichroism (CD) spectra were recorded on a BioLogic MOS-450 spectropolarimeter and the results were from the transmittance mode. The samples were mounted normal to the beam. Polarized optical microscopy (POM) images were conducted on Leica DM400M microscope with images taken by polarizers in a perpendicular arrangement. The emission spectra were measured using an Andor Shamrock SR-750 spectrometer. A photomultiplier combined with a monochromator was used for signal collection. A continuous 980 nm diode laser was used to pump the samples to investigate the steady state spectra. Energy dispersive X-ray (EDX) analysis was performed using a JEOL-IE350 probe. The helical pitch was tuned by ultrasonic treatment using Sonics VCX750. The thermogravimetric analysis (TG) was conducted on NETZSCH STA 449C.

Results and discussion

A binary dopant system of NaYF4 with fixed Yb3+/Er3+ molar ratio of 20/0.2, designated as NaYF4:Yb,Er, was prepared according to reported procedures, during which PEI was used to stabilize Yb3+ ions and control nanocrystal growth.15 More experimental data were provided in ESI. The chiral luminescent composite films of CNC–NaYF4:Yb,Er are self-organized from CNC and NaYF4:Yb,Er driven by electrostatic attractions. CNC, obtained from cotton pulp by sulfuric acid hydrolysis,1 carries negative charges and is nanorod-like with an average diameter and length of ∼17 nm and ∼200 nm, respectively (Fig. S1a). The NaYF4:Yb,Er suspension is transparent to visible light. It contains positively charged nanocrystals with an average diameter of ∼20 nm (Fig. S1b). As shown in Fig. S1c, all peaks on the powder X-ray diffraction pattern can be indexed to cubic NaYF4 (JCPDS 77-2042). Composite films of CNC loaded with different amount of NaYF4:Yb,Er nanoparticles are designated as CNC–(NaYF4:Yb,Er)x, which means the mass fraction of NaYF4:Yb,Er nanoparticles in the composite film is x. The mass fraction of NaYF4:Yb,Er nanoparticles was obtained by the measurement of TG (Fig. S2). Compositional analysis by the energy-dispersive X-ray spectroscopy (EDX) reveals the presence of elemental Yb and Er (Fig. S3). The electrokinetic potentials (ζ-potentials) of the NaYF4:Yb,Er and CNC suspensions are +39 and −47 mV, respectively, based on the DLS measurement. Counter charges carried by CNC and NaYF4:Yb,Er drive the cooperative assembly, however, causes flocculation when the NaYF4:Yb,Er loading is above 4%. The chiral nematic features of the composite films are described using CNC–(NaYF4:Yb,Er)2.8% as an illustration. The film appears red in color at normal incidence that arises likely from the chiral nematic ordering (Fig. 1a). The color of the film turns golden yellow when viewed at oblique incidence (Fig. 1b). The angle-dependent color is a reflection of structural coloration, giving the wavelength reflected by a chiral nematic structure expressed as λ = navgP[thin space (1/6-em)]sin[thin space (1/6-em)]θ, where navg is the average refractive index, P is the helical pitch, θ is the incident angle and λ is the reflected wavelength. Polarized optical microscopy (POM) shows strong birefringence caused by anisotropic when the sample is viewed between crossed polarizers (Fig. 1c). The fingerprint texture in Fig. S4 further demonstrates the formation of chiral nematic phase. SEM analysis reveals left-handed chiral nematic ordering of CNC–(NaYF4:Yb,Er)2.8% (Fig. 1d).
image file: c6ra13894b-f1.tif
Fig. 1 Characterizing the chiral nematic film of CNC–(NaYF4:Yb,Er)2.8%. (a) Photograph taken at normal incidence showing a red-colored film. (b) Photograph of the same film taken at oblique incidence appears golden yellow showing the angle-dependent coloration. (c) POM image showing strong birefringence when the sample is viewed between crossed polarizers. (d) High magnification SEM showing the helical pitch in an order of several hundred nanometers. Inset: a low magnification SEM of the same film.

Circular dichroism (CD) spectra show a strong positive signal confirming that the observed color arises from the selective reflection of left-handed polarized light (Fig. 2a). We need to be aware that anisotropic effect in the films could exhibit both linear dichroism and birefringence properties. The linear/birefringence possibility of the composite solid film could be eliminated by measuring the films at different angle perpendicular to the beam and the “front and back” measurements (Fig. S5). So we could conclude the CD signal comes from the chiral nematic structure of the composite films. The UV-vis spectra show that the reflection peaks are centered at 650 nm in agreement with the red color of the composite film (Fig. 2b and 1a). It is interesting to note that the peak reflection wavelength of the composite film is blueshifted by about 140 nm compared to the chiral nematic CNC film. The blueshift that occurs to the composite film indicates a shorter helical pitch likely caused by the electrostatic attraction between CNC and NaYF4:Yb,Er. The distribution of NaYF4:Yb,Er nanoparticles is relatively uniform in the film based on the high magnification TEM and EDX elemental mapping (Fig. 2c and S6). The TEM image of CNC film without NaYF4:Yb,Er has been shown in Fig. S7 for comparison, which will further confirm the existence of upconversion nanoparticles. The X-ray diffraction peaks at 14.90°, 16.52°, 22.81° are assigned to type I cellulose (JCPDS 50-2241) (Fig. 2d). NaYF4:Yb,Er is iso-structural to the cubic NaYF4 phase (JCPDS 77-2042) based on the diffraction peaks at 28.23°, 32.73°, 46.91° and 55.49° on the XRD pattern and no other crystalline phases found except for type I cellulose, suggesting that Yb3+ and Er3+ occupy lattice position. The XRD pattern of CNC film without NaYF4:Yb,Er has been given in Fig. S8. High resolution TEM shows lattice fringes with a d spacing of 0.31 nm (Fig. 2c, inset), in agreement with d111 = 0.316 nm of cubic NaYF4.


image file: c6ra13894b-f2.tif
Fig. 2 Characterizing the CNC–(NaYF4:Yb,Er)x composite films, x = 0%, 1.9%, 2.8% and 4.0%. (a) CD spectra. (b) UV-vis spectra, PBG of CNC at 788 nm. (c) High magnification TEM showing uniform distribution of NaYF4:Yb,Er nanoparticles. Inset: HRTEM showing d111 = 0.31 nm. (d) XRD patterns.

The influence of the NaYF4:Yb,Er loading on the chiral nematic structure of the composite film is examined. The UV-vis spectra show a slight redshift of the reflection peak position with increasing NaYF4:Yb,Er loading at x = 1.9–4.0% (Fig. 2b). High magnification SEM shows that chiral nematic ordering is well preserved for the composite films at x = 1.9–4.0% (Fig. S9a–c). At x = 5.2%, loss of chiral nematic ordering has been observed (Fig. S9d). At x ≥ 6.4%, disrupted chiral nematic structures of CNC–NaYF4:Yb,Er are obtained (Fig. S9e and f). For verification, a control composite film of CNC–NaYF4:Yb,Er was prepared from the same mixed suspension with the photonic stop band of CNC at 650 nm. Similar redshift of the reflection peak position happens at n = 1.9–4.0% (Fig. S10). The redshift of the reflection attributes to the higher navg as a result of increased loading of NaYF4:Yb,Er. Loss of chiral nematic ordering is due to the flocculation caused by the electrostatic attraction between CNC and NaYF4:Yb,Er.

Upon excitation at 980 nm, NaYF4:Yb,Er exhibits characteristic sharp emission peaks at 415 nm, 542 nm and 655 nm, assigned to the 2H9/24I15/2, (2H11/2, 4S3/2) → 4I15/2 and 4F9/24I15/2 transitions of Er3+, respectively (Fig. S11).17 These peaks correspond to blue, green and red emissions, respectively, resulting in an overall yellowish color. To study the effect of PBG of the CNC host on the spontaneous emission of NaYF4:Yb,Er, the emission spectra of three CNC–(NaYF4:Yb,Er)2.8% films with respective PBG at 650 nm, 550 nm and 340 nm were recorded upon excitation at 980 nm, designated as CNC650–(NaYF4:Yb,Er)2.8%, CNC550–(NaYF4:Yb,Er)2.8% and CNC340–(NaYF4:Yb,Er)2.8%, respectively. Ultrasonication has a significant influence on the helical pitch.18 So it has been a very effective method to tune the PBG of the film. We usually took 40 mL original CNC suspension to be treated by ultrasonic for different time, generally tens of seconds, to get different helical pitch of chiral nematic film after evaporation. Obviously, the ultrasonic time which we need can also be affected by the different parameters of the ultrasonic equipment. Usually the amplitude was set to be 20%. The detailed data on the variation of helical pitch by ultrasonic treatment can be seen in Fig. S12 of the SEM images and Table S1. The UV-vis spectra, CD spectra and POM characterizing the CNC650–(NaYF4:Yb,Er)2.8%, CNC550–(NaYF4:Yb,Er)2.8% and CNC340–(NaYF4:Yb,Er)2.8% films are shown in Fig. 3. Fig. S13 is the low magnification POM of three composite films which show strong birefringence. For comparison, the emission spectra of the corresponding reference, designated as Ref650, Ref550 and Ref340, respectively, prepared by grinding respective CNC–(NaYF4:Yb,Er)2.8% film to destroy the chiral nematic ordering, were recorded under the same conditions. The SEM images of the grinding sample have been shown in Fig. S14.


image file: c6ra13894b-f3.tif
Fig. 3 Characterizing the CNC–(NaYF4:Yb,Er)2.8% film with respective PBG of 650 nm, 550 nm and 340 nm. (a) UV-vis spectra. (b) CD spectra. (c–e) POM showing birefringence.

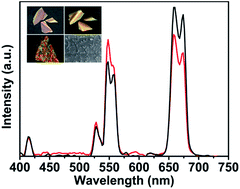
The room temperature emission spectra of CNC650–(NaYF4:Yb,Er)2.8% are shown in Fig. 4a. The excitation power of the 980 laser diode was set to be 0.45 W during the measurement. The power density was 143 mW mm−2. All the samples were measured and compared with the same excitation power density and in the measurements the optical circuit remained unchanged. The spectra are normalized in the 415 nm peak position which is far away from the PBG of 550 nm and 650 nm to compare the changes of red emission and green emission. It is fascinating to observe that the intensity of red emission at 630–680 nm decreases significantly, while the intensity of green emission at 520–570 nm increases compared to Ref650. The red emission falls close to the PBG at 650 nm whose propagation is therefore suppressed. The green emission with the wavelength at the edge of the stop band (band edge) propagates at reduced group velocity due to resonant Bragg scattering, leading to enhanced optical gain and stimulated photoemission. For verification of the PBG effect on the spontaneous emission, the room temperature emission spectra of CNC550–(NaYF4:Yb,Er)2.8% were recorded. Notably, the intensity of the green emission in the range of 520–570 nm decreases, the intensity of the red emission in 630–680 nm increases compared to that of Ref550 (Fig. 4b). The decrease in intensity of the green emission again reflects the suppressed light propagation around the photonic band gap at 550 nm and the enhanced emission in 630–680 nm is due to the slow photon effect of photonic cellulose. The emission spectra of CNC340–(NaYF4:Yb,Er)2.8% are not affected as the photonic band gap of 340 nm is out of the range of red and green emissions (Fig. 4c). We conclude that chiral nematic structure of CNC is capable of modulating the spontaneous emission of upconversion nanoparticles. The photographs of three composite films CNC650–(NaYF4:Yb,Er)2.8%, CNC550–(NaYF4:Yb,Er)2.8% and CNC340–(NaYF4:Yb,Er)2.8% irradiated by 980 nm laser of the same power in darkness are shown in the inset of Fig. 4a–c. The color of CNC650–(NaYF4:Yb,Er)2.8% is brightly yellowish due to intensified green emission while the color of CNC550–(NaYF4:Yb,Er)2.8% is more reddish due to the intensified red emission. Fig. 4d illustrates the relationship between the intensity ratio of the red emission to green emission I(4F9/24I15/2)/I((2H11/2, 4S3/2)–4I15/2) and the photonic band gap. Before the photonic band gap reaches 500 nm, the branch ratios of I(4F9/24I15/2)/I((2H11/2, 4S3/2)–4I15/2) remain constant. When the PBG reaches 500 nm, the branch ratio decreases sharply. It is because the emission centered at 542 nm locates at the edge of the PBG, leading to an intensity gain of green emission. When the PBG reaches 550 nm, matching the location of green emission, causing a significant suppression, hence, branch ratio increases. After the PBG goes to 590 nm, the branch ratio remains the same as PBG falls before 500 nm. The same principle applies to the red emission when the PBG goes to 650 nm. These results are in consistent with the previous report.19


image file: c6ra13894b-f4.tif
Fig. 4 Room temperature emission spectra: (a) CNC650–(NaYF4:Yb,Er)2.8% (red) and Ref650 (black). Inset: photographs of CNC650–(NaYF4:Yb,Er)2.8% irradiated by 980 nm laser. (b) CNC550–(NaYF4:Yb,Er)2.8% (red) and Ref550 (black). Inset: photographs of CNC550–(NaYF4:Yb,Er)2.8% irradiated by 980 nm laser. (c) CNC340–(NaYF4:Yb,Er)2.8% (red) and Ref340 (black). Inset: photographs of CNC340–(NaYF4:Yb,Er)2.8% irradiated by 980 nm laser. (d) Intensity ratio of I(4F9/24I15/2)/I((2H11/2, 4S3/2)–4I15/2) of the composite films as a function of photonic stop band gap.

To determine the number of photons involved in the upconversion luminescence for CNC–(NaYF4:Yb,Er)2.8%, the relationship between the luminescent intensity and the pumping power is established. As shown in Fig. 5a and b, the intensity of both red and green emission increases linearly with pumping power in ln–ln plots and the slopes are approximated to be around 2, conforming to a two-photon populating process. The slope for the blue emission is approximately 3, which is in consistent with a three-photon populating process (Fig. 5c). The detailed populating and emission processes for the Er3+,Yb3+ codoped composite film under 980 nm irradiation are illustrated in Fig. 5d. Yb3+ absorbs NIR photon causing an upward transition from 2F7/2 to 2F5/2, which resonantly donates energy to adjacent Er3+, when falling back to 2F7/2 ground state. This process promotes Er3+ ion from ground state of 4I15/2 to excited state of 4I11/2. The Er3+ ions can be populated to higher excited states via a similar resonant energy transfer from Yb3+ (4I11/24F7/2 or 4I13/24F9/2) owing to the energy level match. The super-excited Er3+ ions relax non-radiatively or by resonant energy transfer to 2H11/2, 4S3/2 and 4F9/2 states. As the electrons return to their ground state, green emission corresponding to 525 and 542 nm, and red emission centered at 655 nm take place via a two-photon upconversion process. Moreover, the 4F9/2 state of Er3+ has ability to accept another NIR photon from Yb3+ to arrive at a much higher excited state of 4G11/2. Relaxation of the 2H9/2 state coupled with 2H9/2 to 4I15/2 transition is realized in a three-photon process.


image file: c6ra13894b-f5.tif
Fig. 5 The ln–ln plot of the emission intensity: (a) 655 nm, (b) 542 nm and (c) 415 nm. (d) Illustration of the energy transfer process for CNC–NaYF4:Yb,Er under 980 nm irradiation.

Conclusions

In summary, self-organized superstructure loaded with upconversion nanoparticles has been developed. The optical property of the upconversion nanoparticles has been successfully modulated by tuning the position of photonic band gap of CNC host. Possible energy transfer mechanism of the composite film has been proposed. The current work opens a new avenue to modulate light propagation leading to color tuning for upconversion nanoparticles.

Acknowledgements

Y. Xu is grateful to the financial support: NNSC (21171067 & 21373100), Jilin Provincial Talent Funds (802110000412) and Tang Aoqing Professor Funds of Jilin University (450091105161). H. W. Song acknowledges financial support: NNSC (11374127) and National 973 project (2014CB643506).

Notes and references

  1. Y. Habibi, L. A. Lucia and O. J. Rojas, Chem. Rev., 2010, 110, 3479 CrossRef CAS PubMed.
  2. L. N. Johnson, Eur. Rev., 2005, 13, 77 CrossRef.
  3. S. Vignolini, P. J. Rudall, A. V. Rowland, A. Reed, E. Moyroud, R. B. Faden, J. J. Baumberg, B. J. Glover and U. Steiner, Proc. Natl. Acad. Sci. U. S. A., 2012, 109, 15712 CrossRef CAS PubMed.
  4. V. Sharma, M. Crne, J. O. Park and M. Srinivasarao, Science, 2009, 325, 449 CrossRef CAS PubMed.
  5. (a) K. E. Shopsowitz, H. Qi, W. Y. Hamad and M. J. Maclachlan, Nature, 2010, 468, 422 CrossRef CAS PubMed; (b) K. E. Shopsowitz, W. Y. Hamad and M. J. MacLachlan, J. Am. Chem. Soc., 2012, 134, 867 CrossRef CAS PubMed.
  6. K. E. Shopsowitz, A. Stahl, W. Y. Hamad and M. J. MacLachlan, J. Mater. Chem. C, 2012, 51, 6886 CAS.
  7. (a) G. Chu, J. Feng, Y. Wang, X. Zhang, Y. Xu and H. Zhang, Dalton Trans., 2014, 43, 15321 RSC; (b) G. Chu, W. Xu, D. Qu, Y. Wang, H. Song and Y. Xu, J. Mater. Chem. C, 2014, 2, 9189 RSC; (c) G. Chu, X. Wang, T. Chen, W. Xu, Y. Wang, H. Song and Y. Xu, J. Mater. Chem. C, 2015, 3, 3384 RSC.
  8. (a) H. Qi, K. E. Shopsowitz, W. Y. Hamad and M. J. MacLachlan, J. Am. Chem. Soc., 2011, 133, 3728 CrossRef CAS PubMed; (b) A. Querejeta-Fernandez, G. Chauve, M. Methot, J. Bouchard and E. Kumacheva, J. Am. Chem. Soc., 2014, 136, 4788 CrossRef CAS PubMed; (c) M. Schlesinger, M. Giese, L. K. Blusch, W. Y. Hamad and M. J. MacLachlan, Chem. Commun., 2015, 51, 530 RSC; (d) G. Chu, X. Wang, T. Chen, J. Gao, F. Gai, Y. Wang and Y. Xu, ACS Appl. Mater. Interfaces, 2015, 7, 11863 CrossRef CAS PubMed; (e) G. Chu, X. Wang, H. Yin, Y. Shi, H. Jiang, T. Chen, J. Gao, D. Qu, Y. Xu and D. Ding, ACS Appl. Mater. Interfaces, 2015, 7, 21797 CrossRef CAS PubMed; (f) T. D. Nguyen, W. Y. Hamad and M. J. MacLachlan, Adv. Funct. Mater., 2014, 24, 777 CrossRef CAS.
  9. F. Auzel, Chem. Rev., 2004, 104, 139 CrossRef CAS PubMed.
  10. (a) J. Zhou, Z. Liu and F. Li, Chem. Soc. Rev., 2012, 41, 1323 RSC; (b) F. Wang and X. Liu, Chem. Soc. Rev., 2009, 38, 976 RSC.
  11. G. Von Freymann, V. Kitaev, B. V. Lotsch and G. A. Ozin, Chem. Soc. Rev., 2013, 42, 2528 RSC.
  12. (a) E. Bovero and F. C. J. M. Van Veggel, J. Am. Chem. Soc., 2008, 130, 15374 CrossRef CAS PubMed; (b) J. D. Joannopoulos, P. R. Villeneuve and S. Fan, Nature, 1997, 386, 143 CrossRef CAS.
  13. A. F. Koenderink, L. Bechger, H. P. Schriemer, A. Lagendijk and W. L. Vos, Phys. Rev. Lett., 2002, 88, 143903 CrossRef PubMed.
  14. D. Englund, D. Fattal, E. Waks, G. Solomon, B. Zhang, T. Nakaoka, Y. Arakawa, Y. Yamamoto and J. Vuckovic, Phys. Rev. Lett., 2005, 95, 013904 CrossRef PubMed.
  15. S. Xu, W. Xu, Y. Wang, S. Zhang, Y. Zhu, L. Tao, L. Xia, P. Zhou and H. Song, Nanoscale, 2014, 6, 5859 RSC.
  16. L. Wang, H. Dong, Y. Li, C. Xue, L. D. Sun, C. H. Yan and Q. Li, J. Am. Chem. Soc., 2014, 136, 4480 CrossRef CAS PubMed.
  17. F. Wang and X. Liu, J. Am. Chem. Soc., 2008, 130, 5642 CrossRef CAS PubMed.
  18. M. Giese, L. K. Blusch, M. K. Khan and M. J. MacLachlan, Angew. Chem., Int. Ed., 2015, 54, 2888 CrossRef CAS PubMed.
  19. W. Wang, H. Song, X. Bai, Q. Liu and Y. Zhu, Phys. Chem. Chem. Phys., 2011, 13, 18023 RSC.

Footnote

Electronic supplementary information (ESI) available: Figures such as SEM, TEM, UV-vis spectra, XRD, TG, POM, emission spectra and EDX elemental analysis. See DOI: 10.1039/c6ra13894b

This journal is © The Royal Society of Chemistry 2016