
Multifunctional ferritin nanocages for bimodal imaging and targeted delivery of doxorubicin into cancer cells†
Hanchun Yaoab,
Xiaofei Longa,
Li Caoa,
Man Zenga,
Weiwei Zhaoa,
Bin Du*ab and
Jie Zhou*ab
aSchool of Pharmaceutical Sciences, Zhengzhou University, Zhengzhou 450001, China. E-mail: dbpaper@sina.com; zhj_paper@sina.com; Fax: +86 371 67739546; Tel: +86 371 67781902
bCollaborative Innovation Center of New Drug Research and Safety Evaluation, Henan Province, Zhengzhou, 450001, China
First published on 3rd October 2016
Abstract
Recently, drug delivery systems with tumor-targeting potential have been highly desirable for improving the efficacy and applicability of drugs. With its cage structure, apoferritin (AFn) is very suitable as a drug carrier. This study describes an alternative strategy for the delivery of an anticancer drug (DOX) by encapsulating it in the cavity of AFn. The encapsulation (AFn/DOX) was achieved by manipulating the pH-dependent unfolding–refolding process of AFn at pH 2.0 and 7.4, respectively. Carbon dots (Cdots) were selected as the fluorescent probe attached to the surface of AFn nanoshells, which were of low toxicity and had good fluorescent properties. Cdots were synthesized by a simple and green strategy for imaging by using both down and upconversion fluorescence. Targeted drug delivery and multimodal imaging based on magnetic fields can be used advantageously to integrate tumor diagnosis and treatment. In this system, AFn/DOX was decorated onto the surface of iron oxide nanoparticles (IONPS), which can greatly improve the biocompatibility of IONPS. The work provides a promising strategy for tumor diagnosis by fluorescence and MR imaging. Furthermore, the pH-sensitive AFn/DOX release of the drug from the AFn nanoshells was also observed by varying the pH during the treatment both in vitro and in vivo. The system also can selectively kill cancer cells in highly localized regions via its excellent magnetically targeted abilities.
1. Introduction
In recent years, the development of novel drug carriers for targeted cancer therapy with high efficiency and specificity has been of paramount importance and is one of the major topics in current nanomedicine. Carbon materials such as carbon nanotubes have been examined as drug delivery vehicles, but poor water solubility and inefficient transport limit their potential application. Meanwhile, their poor biocompatibility makes them accumulate easily in the body, producing toxicity. Demineralized ferritin, i.e. apoferritin (AFn), has been shown to be a promising vehicle for targeted delivery of drugs. Ferritin universally exists in all kinds of organisms and has a lot of unique properties, such as good biocompatibility, non-toxicity and no obvious immune response.1 It has a cage-like nanostructure, which provides two interfaces, one outside and one inside for possible functional loading.2 There are many reports about ferritin modified with functional motifs (such as antibodies,3–5 peptides6,7 or small molecules8) or contrast agents,9–12 and the cavity can be used as a reaction chamber to synthesize highly crystalline and monodispersed nanoparticles.13–15Recently, it was found that the assembly of ferritin is pH dependent, despite its rigidity under physiological conditions.16–18 The nanoarchitecture can be broken down in an acidic environment and restored, almost intact, by retuning the pH to 7.4. As a drug delivery vehicle, ferritin can reduce the side effects of drugs and improve the efficiency of drug treatment. These unique properties, especially the diversity of loading mechanisms, make ferritin a potentially powerful nanoplatform on which to construct multifunctional nanoagents for imaging and therapy.19–21
Various imaging reagents have been used in drug delivery systems for the diagnosis of disease. New NPs called carbon dots (Cdots) have emerged and attracted growing interest in analytical and medical fields. Cdots exhibit excellent fluorescent properties with high photostability, high quantum yield, water solubility and favourable biocompatibility.22,23 They can be synthesised using a simple, cost-effective and environmentally friendly method on a large scale. Thus, these Cdot-based materials hold great promise in nanotechnology and nanomedicine. In particular, their luminescent properties such as visible and upconversion fluorescence of Cdots are extremely important for fundamental and practical applications.24 Ashmi Mewada et al. used Cdots to label a BSA–FA–DOX complex for cellular imaging.25 This was performed using epifluorescence microscopy, which showed bright green coloured fluorescence due to internalization of Cdots specifically targeted with folic acid in HeLa cells.
Magnetite nanoparticles (MNPs), in particular iron oxides, have been widely applied in biomedical fields due to their low toxicity and good compatibility.26–30 They have been approved by the Food and Drug Administration for use in vivo and have been utilized in magnetic separation of biological entities, thermal therapy, magnetic resonance imaging (MRI), and drug delivery. MNPs can be manipulated by external magnetic fields which can penetrate human tissues, indicating the possibility for magnetic targeting.31–33 In this study, we used IONPS as the core for magnetic resonance imaging and targeted delivery of drugs.
In this study, we exploit not only the reassembly properties of apoferritin to synthesize AFn/DOX composites for cancer therapy but also the bioimaging of Cdots that are water-soluble and have low cytotoxicity.34,35 Apoferritin was prepared from ferritin using a reductive dissolution process. Cdots were synthesized by a simple and green strategy with abundant amino groups on the surface. And they were attached to the surface of AFn nanoshells via amido bonds for fluorescent labels. Moreover, Fe3O4 nanoparticles were used as a core surrounded by AFn nanoshells for MR imaging and magnetically targeted delivery. Herein, a tumor-targeting ferritin cage nanostructure with multi-functional characteristics for drug therapy and MRI/fluorescence imaging (Fig. 1) was developed. The bioimaging and tumor-targeting efficacy of the nanosystem were examined using tumor cells and tumor-bearing mouse models. Furthermore, in vivo MR imaging of tumor-bearing mice has also been realized using this nanosystem. The nanosystem developed in this work may be a promising tool for cancer theranostic applications.
 | ||
| Fig. 1 Schematic illustration of design of Fe3O4–AFn/DOX–Cdots composite. | ||
2. Experimental
2.1 Materials
Ferritin was purchased from Sigma-Aldrich Co. LLC. FeCl3·6H2O, FeCl2·4H2O, sodium acetate (NaAc), N-(3-dimethylamino propyl-N′-ethylcarbodiimide)hydrochloride (EDC·HCl), and dimethyl sulfoxide (DMSO) were obtained from Sigma-Aldrich Co. LLC. N-Hydroxysuccinimide (NHS) was bought from CIVI-CHEM. Doxorubicin (purity > 98%) was purchased from Dalian Mellon, biological pharmaceutical Co. LLC. 3-(4,5-Dimethylthiazol-2-yl)-2,5-diphenyltetrazolium bromide (MTT) was bought from Biotopped. Fetal bovine serum (FBS) and heparin sodium were bought from Gibco Invitrogen. The dialysis bags (MWCO = 8000) were obtained from Spectrum Laboratories Inc. All other chemicals used were of analytical reagent grade. Ultrapure water (18.2 MΩ cm at 25 °C) prepared on a Milli-Q water system was used throughout all the experiments.2.2 Synthesis of carboxyl ferroferric oxide and carbon dots
Firstly, Fe3O4 particles were prepared by co-precipitation from Fe2+ and Fe3+ ions with ammonia solution under N2 conditions at 80 °C. Briefly, 2.35 g of FeCl3·6H2O and 0.86 g of FeCl2·4H2O were dissolved in 40 mL of water in a three-neck flask. The chemical precipitation was achieved under vigorous magnetic stirring by adding 5 mL of NH3·H2O (28%) solution. During the process, the temperature was maintained at about 80 °C under N2 conditions. After 30 min, citric acid (2 mL, 0.5 g mL−1) was added into the mixture. Then, it was heated up to 95 °C and reaction continued for 90 min. The Fe3O4 nanoparticles were recovered from the reaction mixture by a magnetic bar and then washed with water. The obtained product was subjected to freeze-drying equipment until the black powder of Fe3O4 was obtained, which was weighed and analyzed spectrophotometrically.The Cdots were synthesized by a rapid one-step procedure with a microwave by pyrolyzing citric acid in the presence of PEI2500, using the method suggested by Alfonso Salinas-Castillo, et al.23 Briefly, 1 g of citric acid and 0.2 g of PEI2500 were dissolved in 20 mL of hot water. Then, the solution was placed in a domestic microwave and heated at 180 °C for 3 min at maximum power (850 W). Then it was cooled down to room temperature and dissolved in sufficient water. The undissolved substance was removed by filtration and the filtered fluid was dialyzed against ultrapure water for 48 h to eliminate the residual PEI2500. The purified solution was subjected to continuous vacuum heating until a black coloured powder of pure Cdots was obtained, which was weighed and re-dissolved in ultrapure water and used accordingly. An amount of the powder was dissolved and the resulting solution was observed under UV light for fluorescence.
2.3 Preparation of apoferritin (AFn)
Apoferritin was prepared using the procedure described in the literature.21 Native horse spleen ferritin protein (50 mg, 100 mg mL−1) added into 1 mL 0.1 M of NaAc buffer (pH 5.5) was first dialyzed for 30 min against NaAc (0.1 M, pH 5.5, 800 mL). Then mercaptoacetic acid (2 mL, 0.03 M) was added into the buffer and dialyzed against NaAc buffer (0.1 M, 800 mL) at pH 5.5 for 2 h. Further mercaptoacetic acid (1 mL, 0.03 M) was added and dialysis continued for another hour against 0.1 M NaAc (pH 5.5, 800 mL). The solution was subjected to purging under a N2 atmosphere under stirring conditions and this process was repeated until complete decoloration of the ferritin solution was reached. Finally, the buffer was dialyzed against NaAc (0.1 M, pH 5.5, 800 mL) for 24 h to eliminate the residual mercaptoacetic acid. Then, the preparation method consisted of repetitive cycles of a demineralization procedure. The progressive release of iron was clearly seen by a color change of the solution from the red-brown of ferritin (Fig. 2B-a) to the colorless apoferritin (Fig. 2B-b).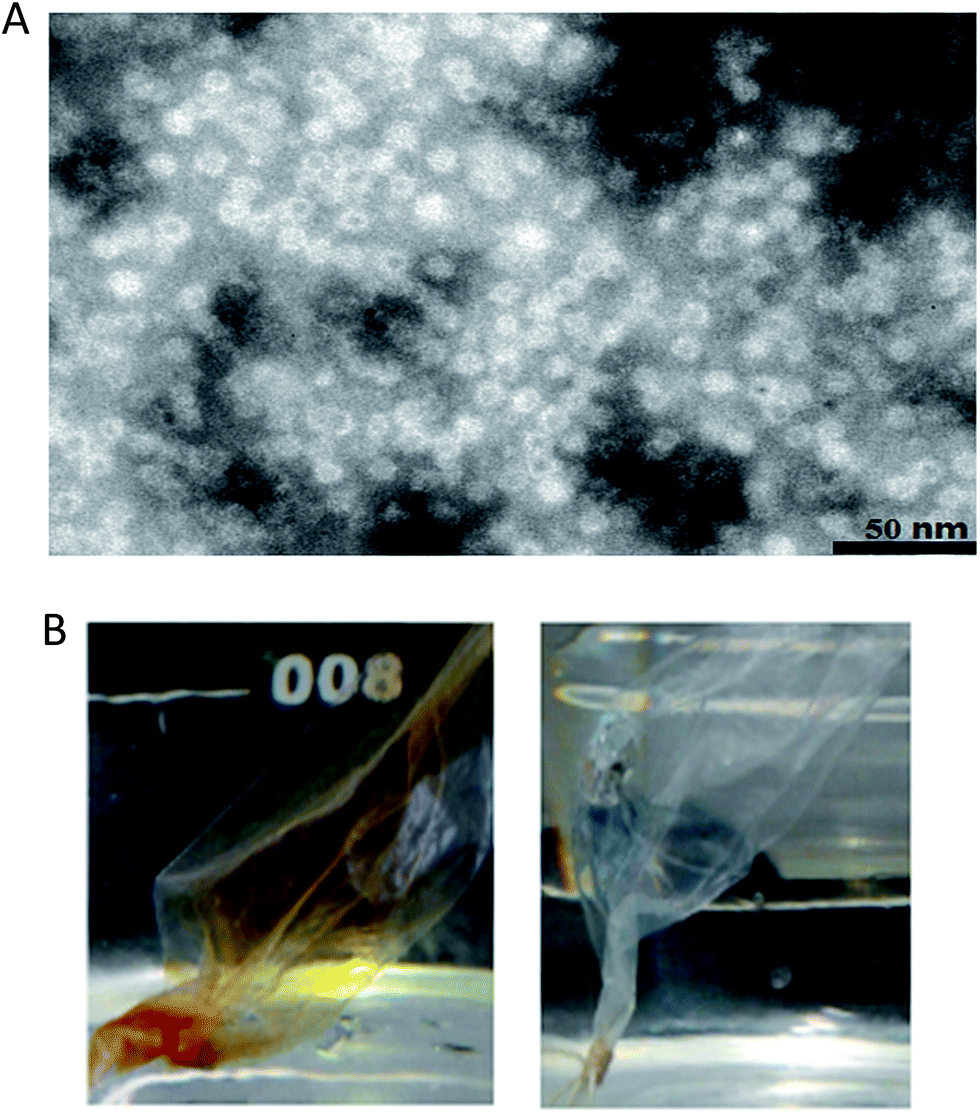 | ||
| Fig. 2 (A) TEM images of ferritin (samples were negatively stained for 2 min; scale bars: 50 nm); (B) photographs in parts (a), and (b) show solutions of ferritin, and apoferritin. | ||
2.4 AFn loading with DOX
Apoferritin nanoshells (AFn) were obtained from horse spleen ferritin by demineralization according to established procedures. The encapsulation of drugs in the AFn cavity was carried out as described previously.20 AFn(DOX) was prepared using the disassembly/reassembly method. Briefly, 200 μM doxorubicin was added to AFn solution (0.5 mg mL−1 in 0.15 M NaCl) and adjusted to pH 2.0 by 0.1 M HCl. The pH was maintained for about 15 min and when the dissociation of AFn was complete, the pH value was gradually increased up to 7.4 by using 0.1 M NaOH. The resulting solution was stirred at room temperature for 2 h. In order to remove the excess doxorubicin and the adsorbed molecules, the solution was dialysed against 0.15 M NaCl for 24 h under stirring conditions and washed several times with PBS buffer.2.5 Synthesis of Fe3O4–AFn/DOX–Cdots nanocomposites
To synthesize Fe3O4–AFn/DOX–Cdots nanocomposites, 2 mL of solution containing pre-synthetic AFn/DOX was prepared. Then, the attachment was carried out by adding 5 μL of Fe3O4 solution (13.5 mg mL−1) to the AFn/DOX (0.5 mg mL−1 in 0.15 M NaCl). 5 mg of EDC and 5 mg of NHS were added to catalyze the reaction. This was allowed to take place for 2 h at room temperature under stirring conditions. Finally, 1 mL of purified Cdots (2 mg mL−1) was added to the solution and it was incubated at room temperature for 2 h. Unbound Cdots were removed by dialyzing the resultant solution against deionized water for 10–12 h and the compound was studied spectrophotometrically.2.6 Characterization
The Fe3O4–AFn/DOX–Cdots compound was characterized by the following measurements. The UV-vis absorption spectra of Cdots, AFn/DOX and Fe3O4–AFn/DOX–Cdots were measured on an ultraviolet-visible (UV-vis) spectrometer (Lambda 35, Perkin-Elmer, USA). Fluorescence data were collected on a fluorescence spectrophotometer (RF-5301, Shimadzu, Japan). FT-IR spectra of Fe3O4–AFn/DOX–Cdots were recorded on a Nicolet iS10 spectrometer (Thermo, USA). Dynamic light scattering (DLS, Zetasizer Nano ZS-90, Malvern, UK) and transmission electron microscopy (TEM, Tecnai G2 20, FEI, USA) were used to characterize the particle size and morphology of the nanoparticles. A sample (15 mL) was dropped onto a carbon-coated copper grid, blotted after 5 min and then negatively stained. For negative staining, samples were stained with 0.5% phosphotungstate for 30 s. A vibrating sample magnetometer (VSM) was used to characterize the magnetic property. The in vivo T2-weighted MR images were conducted on a 3-T clinical MRI scanner (Siemens, Erlangen, Germany).2.7 Drug loading efficiency
The amount of the encapsulated molecules was determined by extracting DOX from the AFn shell according to the procedure previously described.21 5 mL of Fe3O4–AFn/DOX–Cdots nanocomposites was dialyzed against ultrapure water for 8 h and the concentration of unbound drug was measured spectrophotometrically at 480 nm and calculated using the standard calibration curve of DOX (linear equation: y = 0.0231x + 0.005, r2 = 0.9926). Drug loading efficiency (DLE) was calculated using the following equation:
2.8 Kinetics of DOX spontaneous release in vitro
A DOX release study was performed by a dialysis method. PBS of pH = 7.4 and pH = 5.0 were used as the release media, respectively. A Fe3O4–AFn/DOX–Cdots sample solution was placed into dialysis bags (MWCO = 8000), to which was added 50 mL of release media. The release assay was performed at 37.0 ± 0.5 °C with a stirring rate of 150 rpm. 0.2 mL solution was drawn from the dialysis bags at various time points, being replaced by the same volume of fresh release media. The concentration of DOX released from nanocomposites into the media was quantified by UV-vis analysis.2.9 Cell imaging and cytotoxicity
For cell imaging, 500 μL of Fe3O4–AFn–Cdots nanocomposites were incubated in 6-well plates with MCF-7 cells (seeded at 5 × 10⁵ cells per mL) for 24 h at 37 °C, and subsequently the cells were washed three times with PBS and then observed after fixing with 4% paraformaldehyde for 25 min.The cytotoxicity effects of the Fe3O4–AFn–Cdots nanocomposites were studied on MCF-7 cells using MTT assay at different times. This assay is based on the conversion of pale yellow MTT to violet colored formazan crystals by the mitochondrial enzyme succinate dehydrogenase. Cells were seeded (5 × 10⁵ mL−1) in 96-well plates and incubated at 37 °C and 5% CO2 overnight. The medium was then replaced with the test solutions and incubated further for 24 h and 48 h. Later, 20 μL MTT (5 mg mL−1) was added into every hole. The cells were incubated for 4 h at 37 °C to initiate formation of formazan. After completion of the reaction, the medium was replaced with 150 μL of DMSO. This conjugate was agitated slowly to dissolve the formazan crystals. Finally, the dissolved formazan in DMSO was transferred to fresh 96-well plates and analyzed using a microplate reader (Thermo, USA) at 570 nm.
2.10 Cellular uptake and cell death assay
5 mL of Fe3O4–AFn/DOX–Cdots was protected from light. MCF-7 cells were seeded at 2 × 10⁵ cells per well on glass cover slips in 6-well plates. When cells reached 70% confluence, they were treated with Fe3O4–AFn/DOX–Cdots for 0.5, 2, and 6 h, respectively. At indicated time points, the cell medium was removed and the cells were washed three times with PBS followed by soaking for 15 min in 4% paraformaldehyde, and then washed with deionized water. The cells were imaged by a fluorescence microscope (Zeiss LSM 510, Thornwood, NY, USA).MCF-7 cells were seeded at a density of 5 × 10³ cells per well in flat-bottom 96-well plates overnight by incubating. Thereafter, Fe3O4–AFn/DOX–Cdots/magnet and DOX were added with 200 μL of fresh media into the wells of the plates to investigate the controlled-release ability. After incubation for 24, 48 and 72 h at 37 °C in the CO2 incubator, an MTT assay was performed to determine cell viability.
2.11 Pharmacokinetic study
All animal-handling procedures were performed according to a protocol approved by the Henan Province Laboratory Animals Center. All animal experiments were approved by the Experimental Animal Ethical Committee of Zhengzhou University. 0.5 mL of blood was drawn from the eyes of tumor-free healthy C57 mice after treatment with Fe3O4–AFn/DOX–Cdots or DOX (DOX dose: 5 mg kg−1) for 0.083, 0.25, 0.5, 2, 4, 8, 12 and 24 h, respectively, and then centrifuged. The supernatant (0.2 mL) was placed into 5 mL centrifuge tubes. Acetonitrile (2 mL) was added to the above tubes and centrifuged at a rate of 4000 rpm for 15 min after mixing by vortex. The supernatant was taken and dried by airflow (40 °C). Then methanol (0.1 mL) was added to dissolve the DOX, which was detected by HPLC. The pharmacokinetic parameters were calculated using the Kinetica 4.4.1 program (Thermo. Fisher Scientific Inc., MA, USA).2.12 Xenograft tumor mouse model and in vivo antitumor effect
All animal experiments were performed under a protocol approved by the Henan Province Laboratory Animals Center. The B16-F10 tumor models were generated by subcutaneous injection of 1 × 10⁶ cells in 0.1 mL saline into the right shoulder of C57 female mice (18–20 g, Henan Laboratory Animal Center). The mice were used when the tumor volume reached 60–100 mm3 (∼5 days after tumor inoculation).The mice were divided into four groups (five mice per group), minimizing the differences in weights and tumor sizes in each group. 0.2 mL of saline solution, DOX, Fe3O4–AFn/DOX–Cdots and Fe3O4–AFn/DOX–Cdots/magnet (DOX dose: 5 mg kg −1) were intravenously injected into mice via the tail vein every 2 days. The mice were observed daily for clinical symptoms and the tumor sizes were measured by a caliper every other day and calculated as volume = (tumor length) × (tumor width)2/2. After treatment for 14 days, the mice were killed to collect heart, liver, spleen, lung, kidney and tumor, and the collected tissues were soaked in 10% formalin solution, embedded with paraffin for H&E staining. Morphological changes were observed by a Leica TCS-SP5 confocal microscope with the supplied software (Leica Confocal Software Version 2.0).
2.13 In vitro/vivo MR imaging
For in vitro imaging, different concentrations of Fe3O4–AFn/DOX–Cdots nanocomposites were added into the flat bottom of 96-well plates for 0, 0.05, 0.1, 0.2, 0.4, 0.6, 0.8 mg mL−1. MCF-7 cells were incubated with Fe3O4–AFn/DOX–Cdots for 2 h at 37 °C in the presence of a magnetic field (magnetic field intensity: 0.3 T). MR imaging was conducted on a 3-T clinical MRI scanner (Magnetom Symphony, Siemens Medical solutions, Erlangen, Germany).For in vivo MR imaging, the tumor-bearing mice were intravenously injected with Fe3O4–AFn/DOX–Cdots composites (0.2 mL, 50 mg kg−1) with a magnet glued onto the tumor for 1, 4 and 7 h. The magnet was taken away before MRI. The saline group was used as a control group. After injection for 1, 4 and 7 h, MR imaging was conducted with a 3-T clinical MRI scanner.
3. Results and discussion
3.1 Synthesis and characterization of Fe3O4–AFn/DOX–Cdots nanocomposites
The iron storage protein ferritin (Fn) was used as a template for the preparation of the apoferritin–DOX composites. TEM images (Fig. 2A) indicated that ferritin had a uniform size and a nanocage structure of about 10 nm. Apoferritin nanoshells (AFn) were obtained from horse spleen ferritin by demineralization, and the progressive release of iron was clearly seen by a color change of the solution from red-brown for ferritin (Fig. 2B-a) to colourless for the demetalated apoferritin (Fig. 2B-b). The protein shell assembled into a hollow protein sphere with outer and inner diameters of 12 nm and 8 nm, which is known for its ability to self-assemble: its shell disassembles into subunits at pH = 2 and reassembles as an intact sphere at pH = 7.4.34The Cdots were synthesized by a rapid one-step procedure. Citric acid was pyrolyzed by microwaves in the presence of PEI. A solution of Cdots under sunlight is yellow, as shown at the right of Fig. 3A-a. As shown in Fig. 3A-b, the Cdots exhibit excellent water solubility and blue-green luminescence under UV light excitation (365 nm). To further explore the optical properties of Cdots, a detailed fluorescence study was performed using different excitation wavelengths. As shown in Fig. 3C, when the excitation wavelengths were between 330 nm and 365 nm, the intensity of the emission fluorescence increased with the increase in wavelength. The intensity of luminescence by UV excitation at 365 nm was the strongest and the emission wavelength was 470 nm. In addition, these Cdots also exhibit good upconversion fluorescent properties. The fluorescent spectra of Cdots are shown in Fig. 3D; they were excited by long wavelength light (maximum intensity with 700 nm excitation) with the upconversion emissions located in the range 400–560 nm. The influence of pH on the Cdots' fluorescence from pH = 2 to pH = 10 was studied. The results showed that the maximum fluorescence intensity of the Cdots was observed at pH = 4 (Fig. 3B), which may be attributed to the protonation of the amino groups. The good fluorescence properties presented by the Cdots over a wide range of pH (2–8) makes them valuable for application in the biological field. Therefore, this result suggests that Cdots may be used as powerful fluorescence probes and labels in biomedical applications (Fig. 3).
 | ||
| Fig. 3 (A) Photographs of Cdots solutions under visible light (a) and UV beam of 365 nm (b) in comparison with only water; (B) effect of pH on the fluorescence intensity of Cdots; (C) down-conversion fluorescent properties of Cdots at different excitation wavelengths; (D) up-conversion fluorescent properties of Cdots at different excitation wavelengths. | ||
The UV-vis absorption spectra (Fig. 4A-a) showed that a new peak was generated at 350 nm, which was consistent with the reports in the literature. So this indicated that Cdots had been synthesized successfully. Encapsulation of DOX in AFn was completed in two steps, as reported previously.35 Under experimental conditions, DOX encapsulation was straightforward and highly reproducible to obtain AFn/DOX. And it was characterized with a UV-visible spectrum, which exhibited two peaks of AFn and DOX at 280 and 480 nm, respectively, as shown in Fig. 4A-b. Fluorescence emission spectra of AFn/DOX were also measured at 555 nm, which was consistent with the fluorescence emission spectra of DOX. This implied the successful introduction of DOX into the cage of AFn. Fe3O4–COOH was synthesized by co-precipitation from Fe2+ and Fe3+ ions with ammonia solution, and citric acid was added into the mixture to modify the surface of Fe3O4. Fe3O4–COOH was stable in water over a few weeks without obvious aggregation. The results of the FT-IR spectrum showed a new peak generated at Fe–O (∼576 cm−1) (Fig. 4B-b). It also showed new peaks at C![[double bond, length as m-dash]](https://www.rsc.org/images/entities/char_e001.gif) O (∼1632 cm−1) and O–H (∼3418 cm−1) in the spectrum of Fe3O4–COOH, implying the successful introduction of –COOH onto Fe3O4.
O (∼1632 cm−1) and O–H (∼3418 cm−1) in the spectrum of Fe3O4–COOH, implying the successful introduction of –COOH onto Fe3O4.
 | ||
| Fig. 4 (A) UV-vis absorption spectra. (a) Cdots; (b) AFn/DOX; (c) Fe3O4–AFn/DOX–Cdots; (B) FTIR spectrum of AFn, Fe3O4 and Fe3O4–AFn/DOX–Cdots. | ||
Dynamic Light Scattering (DLS) demonstrated that AFn was well dispersed with an average size of 12 nm (0.252 PDI) (Fig. 5A) and the size of the Cdots was around 5 nm (Fig. 5B). As shown in Fig. 5D, we found that the size of Fe3O4–COOH tended to be 50 nm as confirmed by TEM. Then, the AFn/DOX was produced via a condensation of the carboxyl of Fe3O4 and NH2 group of AFn. The resulting Fe3O4–AFn/DOX was then labeled with Cdots through forming amido bonds. The obtained compound exhibited excellent stability in water. The UV-vis absorption spectra (Fig. 4A-c) showed a new peak generated at 350 nm compared with curve b, which indicated that Cdots were successfully labeled onto the surface of Fe3O4–AFn/DOX. The successful connection of Fe3O4–AFn/DOX–Cdots was also evidenced by the FT-IR spectrum, in which strong C–N (∼1108 cm−1), amide I (∼1657 cm−1), amide II (∼1600 cm−1) vibration peaks were clearly seen (Fig. 4B-c) compared with the AFn (curve a). During this reaction, a part of the carboxyl group in Fe3O4–COOH was reduced, so the FT-IR spectrum of Fe3O4–AFn/DOX–Cdots showed an obvious decrease in CO and O–H peaks.
Transmission electron microscopy (TEM) images of Cdots, Fe3O4 and the Fe3O4–AFn/DOX–Cdots composite are shown in Fig. 5C–E. As can be seen from the TEM images, Cdots are individually dispersed in the inset of Fig. 5C, showing typical quasi-spherical nano-dots with an average particle size of about 5 nm. Fe3O4–AFn/DOX–Cdots had a ball-like structure with average diameters of about 100 nm (Fig. 5E), while Fe3O4 was wrapped by AFn/DOX, suggesting that AFn was successfully deposited on the surface of Fe3O4–COOH (Fig. 5).
 | ||
| Fig. 5 The size and TEM image of nanoparticles. (A) and (B) DLS analysis results of ferritins and Cdots; The TEM image of Cdots (C) Fe3O4 (D) Fe3O4–AFn/DOX–Cdots composite (E). | ||
3.2 pH-dependent DOX release
Fe3O4–AFn/DOX–Cdots composites were stored in a dialysis device and kept in a PBS bath at 37 °C for three days under shaking. At predetermined time points (30 min, 1 h, 2 h, 3 h, 4 h, 6 h, 24 h, 48 h, 72 h), the amount of drug released was quantified by UV analysis and the buffer was replaced after each measurement. The drug release profiles of the Fe3O4–AFn/DOX–Cdots complex in an acidic (pH = 5.0) and a neutral (pH = 7.4) environment were explored (Fig. 6). The accumulative release rates were initially fast and then became slower as time progressed for the two groups. However, the maximum accumulative release rates were 72% (pH = 5.0) and 38% (pH = 7.4), respectively. These release profiles may be the result of the pH-dependent unfolding–refolding process of AFn. That is, AFn naturally has a self-assembly ability. As a result, the Fe3O4–AFn/DOX–Cdots composite had a very good performance of drug release in a tumor microenvironment due to the acidic conditions.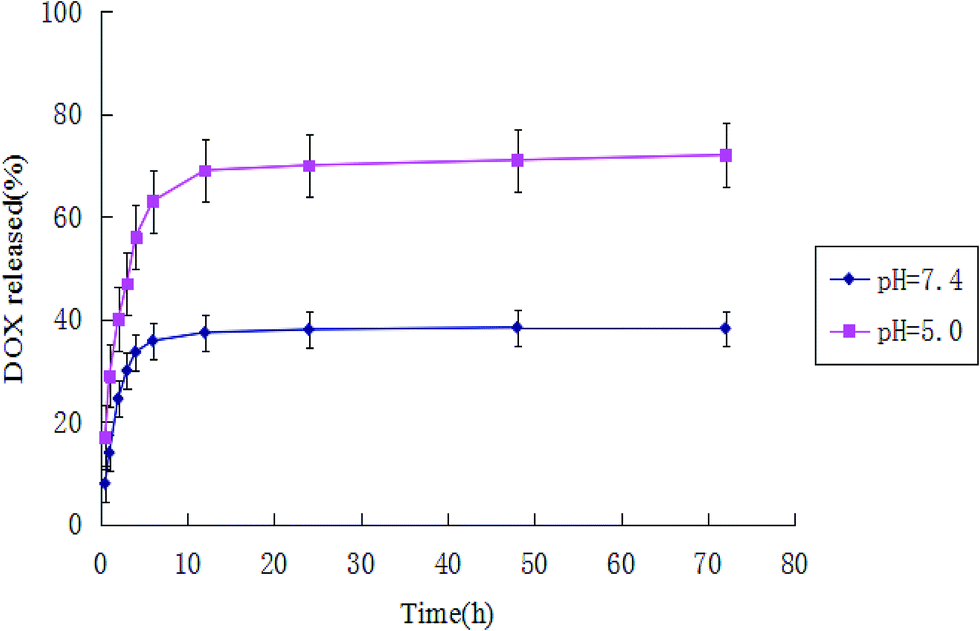 | ||
| Fig. 6 DOX release curves in PBS medium at different pH values. | ||
3.3 Cell imaging and cellular uptake
Due to their excellent fluorescent property, high water solubility and non-toxic nature, Cdots can be used as efficient biological imaging agents. At first, the fluorescence was so weak that it could be hardly observed. As the time went on, the intensity of the fluorescence became gradually stronger and it was brightest at 24 h in the cells. As shown in Fig. 7A, the obvious blue fluorescence of the Cdots was observed in cancer cells incubated with the Fe3O4–AFn–Cdots composite for 24 h. The fluorescence emission of DOX was exploited in this study to evaluate the cellular uptake of DOX. MCF-7 cells were treated with the Fe3O4–AFn/DOX–Cdots complex for 0.5, 2 and 6 h. Then cells were washed, fixed and prepared for confocal microscopy analysis.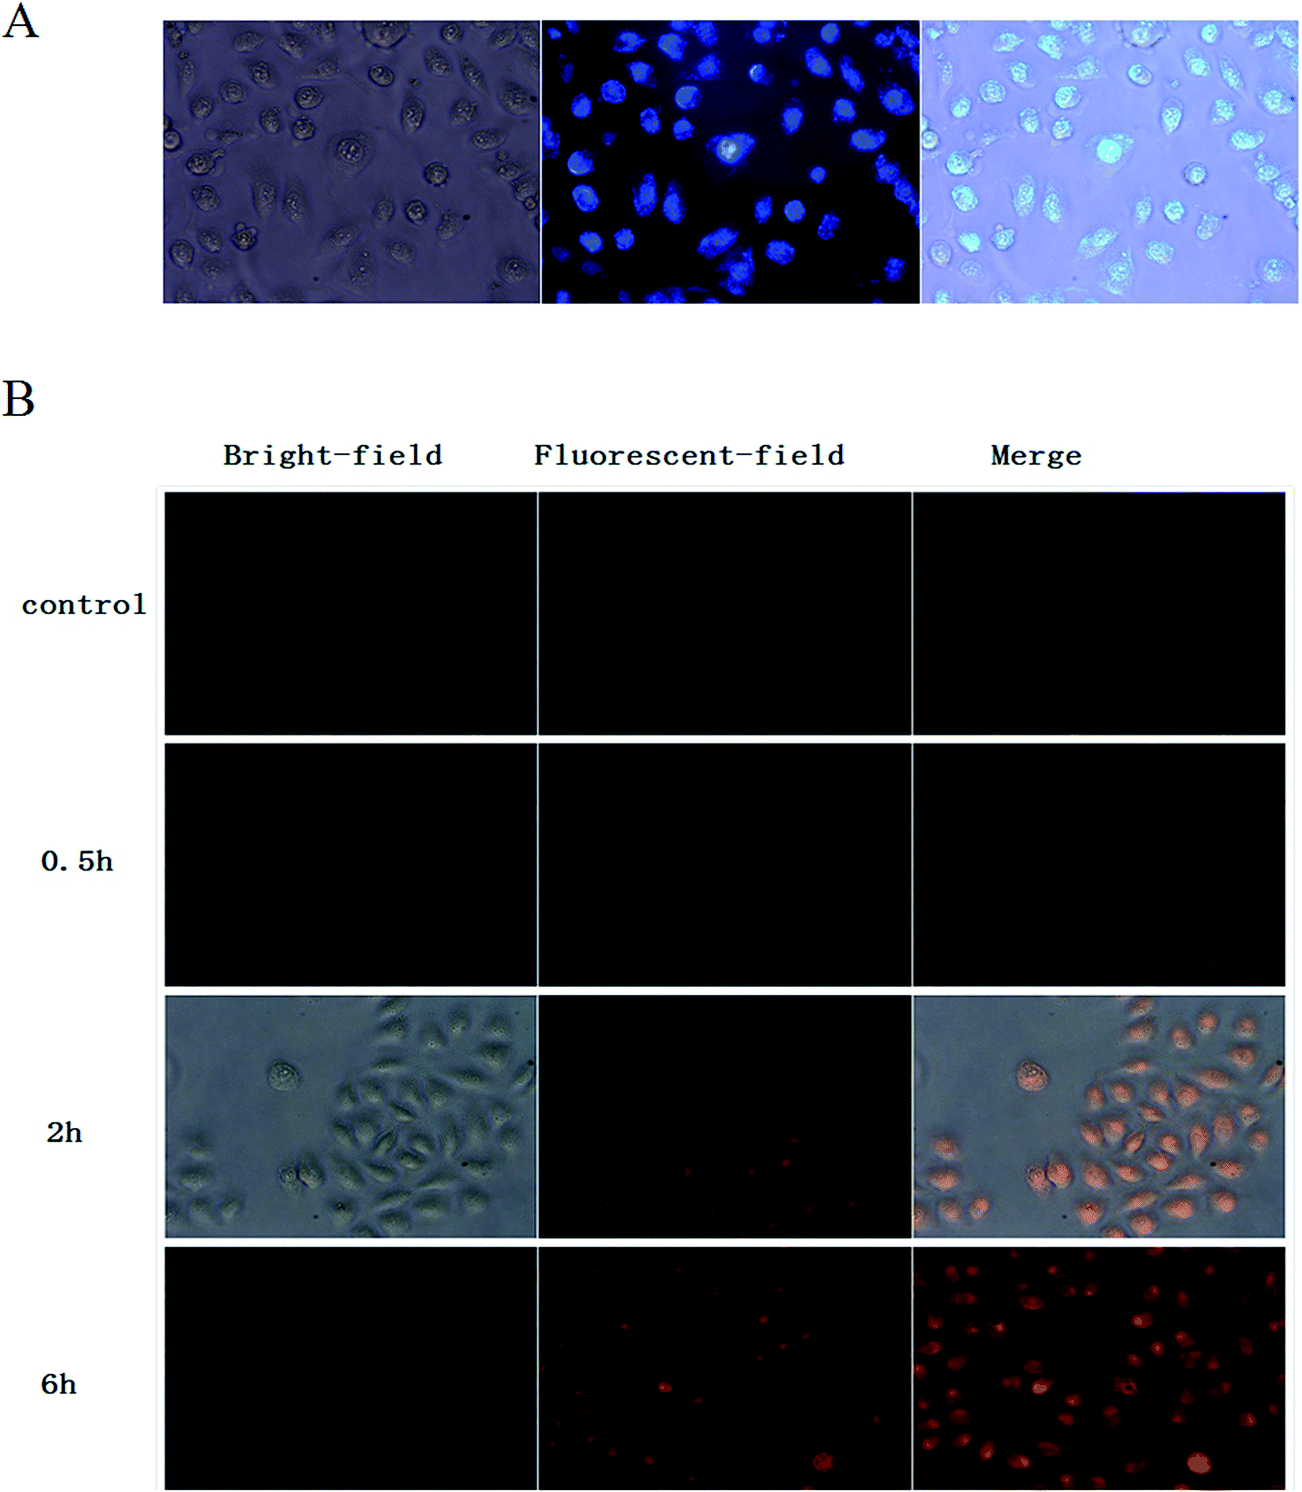 | ||
| Fig. 7 (A) In vitro images of MCF-7 cells treated with the Fe3O4–AFn–Cdots composite for 24 h under excitation with 365 nm laser; (B) fluorescence microscopic images of MCF-7 cells treated with Fe3O4–AFn/DOX–Cdots composite at 0.5, 2 and 6 h (200×). | ||
Fluorescence microscopy was applied to track the location of inside cells (Fig. 7B). When DOX was excited with an argon laser (488 nm), it exhibited a characteristic fluorescence emission with relevant maximal peaks at 550 nm (red fluorescence), which can be detected by setting the instrument appropriately. Fig. 7B displays the bright field and fluorescence microscopy images of MCF-7 cells incubated with the Fe3O4–AFn/DOX–Cdots compound, respectively. MCF-7 cells showed clear internalization, giving bright red fluorescence. The results showed that DOX marked by a weak fluorescence signal was distributed mainly in the cytoplasm after 0.5 h incubation. Then, the intracellular DOX intensity increased and some drug reached the nucleus after 2 h. However, the fluorescence intensity was markedly increased in the cytoplasm after 6 h and a large amount of DOX was loaded into the nuclear regions or the surrounding nuclear membrane. This demonstrated that the intracellular uptake of DOX increased in a time-dependent manner and the Fe3O4–AFn/DOX–Cdots complexes were able to effectively deliver DOX to the cytoplasm due to the pH-responsive release.
3.4 Inhibition efficiency on MCF-7 cells
Furthermore, cytotoxicity testing revealed that Fe3O4–AFn–Cdots were highly compatible, showing cell viabilities of 89.16% and 87.17% at 24 h and 48 h on MCF-7 cells at the highest concentration, respectively (Fig. 8A). Attachment of AFn to Fe3O4 produced an apparent increase in the biocompatibility of the desired product. | ||
| Fig. 8 (A) Cell viabilities of MCF-7 cells incubated with Fe3O4–AFn–Cdots at different concentrations for 24 and 48 h, respectively; (B) cell viabilities of MCF-7 cells incubated with Fe3O4–AFn/DOX–Cdots/magnet or DOX at different concentrations for 24, 48 and 72 h, respectively. Data are presented as mean ± standard deviation (P < 0.05, n = 3). | ||
The inhibition efficiency study of the Fe3O4–AFn/DOX–Cdots/magnet and free DOX on MCF-7 cells is shown in Fig. 8B. It was found that the Fe3O4–AFn/DOX–Cdots/magnet had higher inhibition efficiency than DOX on MCF-7 cells at all the time points. This is probably because the Fe3O4–AFn/DOX–Cdots could be rapidly accumulated in the tumor cells with an external magnetic field. Drug molecules could be released from the shells of AFn in acidic conditions around the tumor. This suggested that the delivery system can deliver more drug into tumor cells and enhance the efficiency of inhibition on MCF-7 cells.
3.5 Pharmacokinetics
To investigate the pharmacokinetics of the drug composite, blood samples of C57 mice after injection of the Fe3O4–AFn/DOX–Cdots or DOX at different times were determined by HPLC. The pharmacokinetic parameters were calculated by the two-compartment model. The results showed the decrease in DOX concentration in blood samples was faster than that for the Fe3O4–AFn/DOX–Cdots after administration (Fig. 9). Compared to DOX, the area under the curve (AUC) of the Fe3O4–AFn/DOX–Cdots (55.88 μg h mL−1) was greater than that of DOX (19.72 μg h mL−1). The elimination rate of the Fe3O4–AFn/DOX–Cdots and DOX were 0.0018 (L h−1 kg−1) and 0.0051 (L h−1 kg−1), respectively (Table 1). The mean residence time (MRT) of the Fe3O4–AFn/DOX–Cdots (6.26 h) was nearly twice as long as that of DOX (3.02 h), indicating that the Fe3O4–AFn/DOX–Cdots composite significantly increased the blood circulation time of DOX in vivo. | ||
| Fig. 9 The result of drug–time curve. Mean concentration of DOX in plasma after intravenous administration of DOX or Fe3O4–AFn/DOX–Cdots. | ||
| Parameter | Unit | DOX | Fe3O4–AFn/DOX–Cdots |
|---|---|---|---|
| T1/2 | h | 2.19 | 3.26 |
| Tmax | h | 0.083 | 0.083 |
| Cmax | μg mL−1 | 15.60 | 15.30 |
| AUC | (μg h mL−1) | 19.72 | 55.88 |
| MRT | h | 3.02 | 6.26 |
| CL | L h−1 mg−1 | 0.0051 | 0.0018 |
| V(c) | L kg−1 | 0.0161 | 0.0084 |
3.6 Tumor growth inhibition in vivo
To investigate the in vivo therapeutic efficacy of the Fe3O4–AFn/DOX–Cdots with a magnet, we conducted comparative efficacy studies. The changes in relative tumor volume as a function of time are plotted in Fig. 10A. After 14 days of treatment, the control group showed a relative tumor volume (V/V0) of 12.10 ± 0.74, and the values of DOX and the Fe3O4–AFn/DOX–Cdots groups were 9.12 ± 0.57 and 6.82 ± 0.36, respectively. Compared with the other therapeutic groups, the tumor volumes of mice treated with the Fe3O4–AFn/DOX–Cdots/magnet were greatly reduced, which is a classical application in which Fe3O4 was used for magnetic targeted delivery of DOX into cancer cells and achieved in vivo tumor treatment efficacy. Because of the magnetic targeting property of the Fe3O4–AFn/DOX–Cdots, when a magnet was pasted to the tumor, more of the Fe3O4–AFn/DOX–Cdots would go to the tumor site than for the non-magnetic group, so the therapeutic efficacy of the Fe3O4–AFn/DOX–Cdots with a magnet was higher than that of the non-magnetic group (Fig. 10A). The growth of tumor tissue was successfully suppressed by the Fe3O4–AFn/DOX–Cdots/magnet. This high therapeutic efficacy originates from the high DOX accumulation in tumor tissue. Since high toxicity usually leads to weight loss, the body weights of the mice for all groups were measured during the treatments. The results showed that the body weights in all groups increased during the treatments (Fig. 10B), implying that the toxicity of the treatments was not obvious. | ||
| Fig. 10 In vivo treatments. (A) Tumor growth of mice in different treatment groups within 14 days. (V0: initial tumor volume, P < 0.05); (B) changes of body weight of mice in different groups during treatment; (C) H&E stained tumor tissues harvested from the mice with different treatments. (a–d) Control, DOX, Fe3O4–AFn/DOX–Cdots, Fe3O4–AFn/DOX–Cdots/magnet. Data are presented as mean ± standard deviation (n = 5). | ||
Histological analysis of tumor tissue in different treatment groups at 14 days post-treatment (Fig. 10C) revealed that the tumor cells in the control group showed vigorous growth, a tight arrangement, a large body and intact shape. Whereas cell necrosis and fragmentation occurred in the Fe3O4–AFn/DOX–Cdots/magnet group. There was no obvious difference in the other groups, which had a little cell necrosis and fragmentation with a growth state between the control group and the Fe3O4–AFn/DOX–Cdots/magnet group.
3.7 In vitro/vivo MR imaging
The Fe3O4–AFn/DOX–Cdots composites displayed a strong magnetic property. These nanocomposites can act as a T2 contrast agent for MR imaging. T2-weighted MR images of the Fe3O4–AFn/DOX–Cdots were acquired with a 3-T MR scanner, which revealed a concentration-dependent darkening effect (Fig. 11). It can be easily seen that the smallest concentration of the nanocomposites gives much brighter T2-weighted images (Fig. 11A). The magnetization hysteresis loop further indicated the superpara-magnetic nature of the nanocomposites (Fig. 11B). | ||
| Fig. 11 Magnetic properties of the Fe3O4–AFn/DOX–Cdots conjugate. (A) T2-weighted MR images of the Fe3O4–AFn/DOX–Cdots conjugate at different concentrations; (B) magnetization loops. | ||
The excellent biocompatibility and high MRI contrast performance of the Fe3O4–AFn/DOX–Cdots in vitro inspired us to pursue their applicability for in vivo trials. Female C57 mice bearing B16-F10 tumors were intravenously injected with the Fe3O4–AFn/DOX–Cdots (200 μL, 50 mg kg−1) with a magnet glued onto the tumor for 1, 4 and 7 h and imaged by a 3-T clinical MR scanner. The saline group was used as the control group. An obvious darkening effect in the tumor was observed in T2-weighted MR images for 4 h (Fig. 12). After injection of the Fe3O4–AFn/DOX–Cdots for 7 h, the signal intensities of the tumor were reduced remarkably. The darkening of the MR images in other organs of the mouse was weaker than the signal of the tumor, proving that the magnetic targeting property of the Fe3O4–AFn/DOX–Cdots existed in vivo. Consequently, the above results suggested that the Fe3O4–AFn/DOX–Cdots can act as a suitable negative (T2) contrast agent in MRI applications.
 | ||
| Fig. 12 In vivo T2-weighted MRI images of the Fe3O4–AFn/DOX–Cdots with magnet. (A) Control; (B) 1 h; (C) 4 h; (D) 7 h. | ||
4. Conclusions
In this paper, we have demonstrated that the horse spleen ferritin cage can serve as a multifunctional platform for the synthesis of Fe3O4–AFn/DOX–Cdots nanocomposites. It was developed for bioimaging and drug targeted therapy for cancer. DOX were successfully encapsulated within the AFn cages with high encapsulation efficiency. Cdots were synthesized using a simple microwave-assisted method and showed bright blue-green fluorescence under UV light. An AFn/DOX compound was successfully labeled with Cdots for fluorescent imaging in cancer cells and the AFn/DOX–Cdots were connected to the surface of INOPS via amido bonds. The final nanocomposites showed an ideal drug release profile at physiological as well as slightly acidic pH. Moreover, this showed a higher killing rate of cancer cells than free DOX and was found to be less toxic to normal cells due to the magnetic targeting. The obtained conjugates achieve nanoplatforms with both magnet-targeting specificity and fluorescence/MR imaging functionalities. The work provides a new nanoprobe and a promising strategy for simultaneous fluorescence and MR imaging of tumor cells. The proposed protocol can also be extended to construct other multifunctional organic/inorganic hybrid nanosystems.Acknowledgements
This work was financially supported by the National Natural Science Foundation of China (Grant No. 81503038) and Natural Science Foundation of Shanxi Province, China (Grant No. 2014011031-2).References
- E. C. Theil, Annu. Rev. Biochem., 1987, 56, 289–315 CrossRef CAS PubMed.
- E. C. Theil, R. K. Behera, T. Tosha and E. C. Coord, Chem. Rev., 2013, 257, 579–586 CAS.
- J. E. Jaetao, K. S. Butler, N. L. Adolphi, D. M. Lovato, H. C. Bryant, I. Rabinowitz, S. S. Winter, T. E. Tessier, H. J. Hathaway, C. Bergemann, E. R. Flynn and R. S. Larson, Cancer Res., 2009, 69, 8310–8316 CrossRef CAS PubMed.
- F. Corsi, L. Fiandra, C. D. Palma, M. Colombo, S. Mazzucchelli, P. Verderio, R. Allevi, A. Tosoni, M. Nebuloni, D. Prosperi and E. Clementi, ACS Nano, 2011, 5, 6383–6393 CrossRef CAS PubMed.
- H. Xu, Z. P. Aguilar, L. Yang, M. Kuang, H. Duan, Y. Xiong, H. Wei and A. Wang, Biomaterials, 2011, 32, 9758–9765 CrossRef CAS PubMed.
- N. Bock, A. Riminucci, C. Dionigi, A. Russo, A. Tampieri, E. Landi, V. A. Goranov, M. Marcacci and V. Dediu, Acta Biomater., 2010, 6, 786–796 CrossRef CAS PubMed.
- K. Takegami, T. Sano, H. Wakabayashi, J. Sonoda, T. Yamazaki, S. Morita, T. Shibuya and A. Uchida, J. Biomed. Mater. Res., Part B, 1998, 43, 210–214 CrossRef CAS.
- R. Weissleder, k. Kelly, E. Y. Sun, T. Shtatland and L. Josephson, Nat. Biotechnol., 2005, 23, 1418–1423 CrossRef CAS PubMed.
- X. Gao, Y. Cui, R. M. Levenson, L. W. K. Chung and S. Nie, Nat. Biotechnol., 2004, 22, 969–976 CrossRef CAS PubMed.
- X. Michalet, F. F. Pinaud, L. A. Bentolila, J. M. A. Tsay, S. Doose, J. J. Li, G. Sundaresan, A. M. Wu, S. S. Gambhir and S. Weiss, Science, 2005, 307, 538–544 CrossRef CAS PubMed.
- Y. Jin, C. X. Jia, S. Huang, M. O'Donnell and X. Gao, Nat. Commun., 2010, 1, 1–8 CrossRef PubMed.
- K. Li, Z. Zhang, M. Luo, X. Yu, Y. Han, H.-P. Wei, Z. Cui and X. Zhang, Nanoscale, 2012, 4, 188–193 RSC.
- F. C. Meldrum, B. R. Heywood and S. Mann, Science, 1992, 257, 522–523 CAS.
- T. Douglas and M. Young, Nature, 1998, 393, 152–155 CrossRef CAS.
- M. Allen, D. Willits, J. Mosolf, M. Young and T. Douglas, Adv. Mater., 2002, 14, 1562–1565 CrossRef CAS.
- Z. Zhen, W. Tang, C. Guo, H. Chen, X. Lin, G. Liu, B. Fei, X. Chen, B. Xu and J. Xie, ACS Nano, 2013, 7, 6988–6996 CrossRef CAS PubMed.
- M. Bellinia, S. Mazzucchelli, E. Galbiati, S. Sommaruga, L. Fiandra, M. Truffi, M. A. Rizzuto, M. Colombo, P. Tortora, F. Corsi and D. Prosperi, J. Controlled Release, 2014, 196, 184–196 CrossRef PubMed.
- R. Xing, X. Wang, C. Zhang, Y. Zhang, Q. Wang, Z. Yang and Z. Guo, J. Inorg. Biochem., 2009, 103, 1039–1044 CrossRef CAS PubMed.
- L. Chen, G. Bai, R. Yang, J. Zang, T. Zhou and G. Zhao, Food Chem., 2014, 149, 307–312 CrossRef CAS PubMed.
- M. Uchida, M. L. Flenniken, M. Allen, D. A. Willits, B. E. Crowley, S. Brumfield, A. F. Willis, L. Jackiw, M. J. Young and T. Douglas, J. Am. Chem. Soc., 2006, 128, 16626–16633 CrossRef CAS PubMed.
- X. Lin, J. Xie, G. Niu, F. Zhang, H.-K. Gao and M. Yang, Nano Lett., 2011, 11, 814–819 CrossRef CAS PubMed.
- Q. Qu, A. Zhu, X. Shao, G. Shi and Y. Tian, Chem. Commun., 2012, 48, 5473–5479 RSC.
- A. Salinas-Castillo, M. Ariza-Avidad, C. Pritz, M. Camprubi-Robles, B. Fernandez, M. J. Ruedas-Rama, A. Megia-Fernandez, A. Lapresta-Fernandez, F. Santoyo-Gonzalez, A. Schrott-Fischer and L. F. Capitan-Vallvey, Chem. Commun., 2013, 49, 1103–1105 RSC.
- Y. Y. Cui, C. F. Zhang, L. M. Sun, Z. B. Hu and X. F. Liu, Part. Part. Syst. Charact., 2015, 32, 542–546 CrossRef CAS.
- A. Mewada, S. Pandey, M. Thakur, D. Jadhav and M. Sharon, J. Mater. Chem. B, 2014, 2, 698–705 RSC.
- J. Riegier, J. A. Wells, P. G. Kyrtatos, A. N. Price, Q. A. Pankhurst and M. F. Lythgo, Biomaterials, 2010, 31, 5366–5371 CrossRef PubMed.
- J. Zhang and R. D. K. Misra, Acta Biomater., 2007, 3, 838–850 CrossRef CAS PubMed.
- E. Hassan and J. M. Gallo, J. Drug Targeting, 1993, 1, 7–14 CrossRef CAS PubMed.
- J. Riegler, J. A. Wells, P. G. Kyrtatos, A. N. Price, Q. A. Pankhurst and M. F. Lythgoe, Biomaterials, 2010, 31, 5366–5371 CrossRef CAS PubMed.
- L. Cheng, K. Yang, Y. G. Li, X. Zeng, M. W. Shao, S. T. Lee and Z. Liu, Biomaterials, 2012, 33, 2215–2222 CrossRef CAS PubMed.
- P. Huang, Z. M. Li, J. Lin, D. P. Yang, G. Gao, C. Xu, L. Bao, C. L. Zhang, K. Wang, H. Song, H. Y. Hu and D. X. Cui, Biomaterials, 2011, 32, 3447–3458 CrossRef CAS PubMed.
- F. Yang, C. Jin, Y. Jiang, J. Li, Y. Di, Q. Ni and D. Fu, Cancer Treat. Rev., 2011, 37, 633–642 CrossRef CAS PubMed.
- J. Chilcott, M. L. Jones and A. Wilkinson, Health Tech. Assess., 2009, 13(1), 7–13 Search PubMed.
- A. Anton, A. Ruiz, M. A. Segui, L. Calvo, M. Munoz, J. Lao, F. Sancho and L. Fernandez, Ann. Oncol., 2009, 20, 454–459 CrossRef CAS PubMed.
- A. Mewada, S. Pandey, S. Shinde, N. Mishra, G. Oza, M. Thakur, M. Sharon and M. Sharon, Mater. Sci. Eng., C, 2013, 33, 2914–2921 CrossRef CAS PubMed.
Footnote |
| † Electronic supplementary information (ESI) available. See DOI: 10.1039/c6ra13845d |
| This journal is © The Royal Society of Chemistry 2016 |