DOI:
10.1039/C6RA13476A
(Paper)
RSC Adv., 2016,
6, 71612-71623
Pre-clinical risk assessment and therapeutic potential of antitumor lipopeptide ‘Iturin A’ in an in vivo and in vitro model
Received
24th May 2016
, Accepted 19th July 2016
First published on 21st July 2016
Abstract
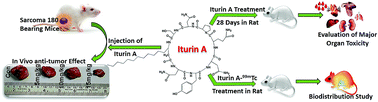
Lipopeptides are versatile bio-active weapons having antifungal, antibacterial, antimycoplasma and anticancer properties. In this study, the therapeutic potential and safety assessment of a lipopeptide molecule ‘Iturin A’ were evaluated. Iturin A was found to inhibit in vivo tumor growth in a sarcoma 180 mouse xenograft model. The antitumor efficacy of Iturin A was correlated with increased DNA fragmentation and modulation of CD-31, Ki-67, P-Akt, P-MAPK, apoptotic and anti-apoptotic proteins. Further, safety assessment was carried out in Sprague Dawley rats by 28 days repeated dose (28 days) toxicity and a bio-distribution study. In the toxicity study, Iturin A (10, 20 and 50 mg per kg per day) was administered to the animals for 28 days. Another group was kept for another 14 days without drug exposure after 28 days of treatment to access the reversibility of the toxicity. At the end of the treatment, body weight, food and water intake, organ weight, motility, hematology, serum biochemistry and histopathology of the major organs were evaluated. The bio-distribution of Iturin A was also performed in plasma as well as in different major organs by a well-developed and validated administration of Iturin A radiolabeled with 99mTc. The in vitro cytotoxic effect of Iturin A was also evaluated in BRL-3A rat liver cells. In the treated groups, various toxicities were found in the liver and spleen. However, these adverse effects were transient and reversible after discontinuation of Iturin A treatment. In conclusion, this pre-clinical study offered a preliminary investigation regarding the efficacy and safety assessment of Iturin A.
Introduction
Lipopeptides represent a unique class of multifunctional metabolites biosynthesized by a number of bacteria having broad-spectrum biotechnological and therapeutic potentials. Structurally, lipopeptides are amphiphillic molecules composed of a lipid moiety conjugated with a small peptide chain. The huge commercial and health care applications of lipopeptides have been investigated in the past years.1 Diverse bioactivities including the antifungal, antibacterial, antimycoplasma and antiviral potential of these molecules have been reported. Some lipopeptide molecules including polymixin, caspofungin, daptomycin and micafungin have already got FDA approval as clinically useful anti microbial therapeutic agents.2 Lipopeptides are also gaining critical attention for their highly effective and broad-spectrum anticancer potential.3 In our previous review articles, critical assessment of these amphiphilic molecules has been discussed for their commercial production4 and cancer therapeutic potential.3 A number of lipopeptides including somocystinamide A,5 surfactin,6 fellutamides,7 rakicidin8 and apratoxin9,10 showed promising anticancer effect on various cancers. These molecules were reported to inhibit various cancer associated crucial signaling cascades including mitogen-activated protein kinase MAPK(p44/42), MAPK(p38), phosphoinositide-3-kinase (PI3K)/Akt, c-Jun N-terminal kinase (JNK), signal transducer and activator of transcription (STAT3) and matrix metalloproteinase (MMP)-2/9 pathways.3,11 In our previous work, we isolated and purified a lipopeptide molecule ‘Iturin A’ from culture of the marine bacterium Bacillus megaterium.12 Chemically, Iturin A is a small cyclic peptide (Asn-Tyr-Asn-Gln-Pro-Asn-Ser) connected with C16 lipid chain. The previous study also explored antitumor and apoptotic action of Iturin A in various breast cancer cell lines and xenograft model. Iturin A was found to inhibit Akt signaling pathway. Akt is the central oncogenic protein that promotes cancer development, inhibition of apoptosis, cell cycle progression and angiogenesis.13,14 Akt exerts its oncogenic effect via modulating downstream signaling proteins including GSK3β and FoxO3a.15 Many Akt inhibitors are currently being investigated in clinical and preclinical experiment for their potential efficacy in multiple cancers.16,17 Suppression of GSK3β and FoxO3a was also observed due to upstream inhibition of Akt signaling by Iturin A.
In the current study, we investigated therapeutic potential of Iturin A in sarcoma 180 mouse xenograft model. Expression profile of various marker proteins were studied to find molecular mechanism of Iturin A mediated antitumor effect in this in vivo study. Considering the extensive biological applications, toxicity and bio-distribution profiles of lipopeptide molecules are essential to validate safety measurements. Currently, there are no reports regarding the systemic adverse effect of lipopeptides. These preclinical assessments are required for further development of these molecules as potential new drug candidates. Although, no significant toxic effect of Iturin A was observed on normal HMEC and HaCaT cells in our previous study.12 Further evaluation of adverse effects of Iturin A is required for pre-clinical development. In this investigation, we evaluated sub-chronic (28 days) toxicological effects and bio-distribution of Iturin A in rat model to offer methodological findings of safety profile of this lipopeptide. We also evaluated toxicological effect of Iturin A in in vitro BRL-3A rat liver cells.
Material and methods
Chemicals and reagents
Extraction and purification of Iturin A from marine bacterium Bacillus megaterium was reported in our previous study.12 Iturin A was dissolved in sterile water and pH was adjusted to 7.4. For 28 days toxicity study, dissolved Iturin was injected in rats. Following antibodies were used in immunoblot and immunohistochemistry: Bax, Bcl2, T-Akt, P-Akt, T-MAPK, P-MAPK, Ki67, CD31, β-actin (Cell Signaling, Beverly, MA, USA), anti-rabbit IgG and antimouse IgG (Sigma Aldrich, St. Louis, MO, USA). Other chemicals including MTT reagent, chemiluminescent peroxidase substrate, Propidium Iodide (PI) (Sigma Aldrich, St. Louis, MO, USA), in situ apoptosis detection kit (Promega, Madison, WI, USA), IHC detection system (Biogenex, Fremont, CA, USA) and FBS (Gibco-BRL, Invitrogen Corporation, CA, USA) were purchased.
Cell line and culture condition
BRL-3A cell line (rat liver cells) was procured from National Centre for Cell Science (NCCS), Pune, India. This cell line was maintained in Dulbecco's Modified Eagle's medium (DMEM) supplemented with 10% FBS, sodium bicarbonate, and antibiotics (penicillin and streptomycin obtained from Himedia, Mumbai, India). Regular and continuous passage of BRL-3A cells were maintained in T-25 tissue culture flask at 37 °C in incubator with 5% CO2 environment.
Animal maintenance
Sprague Dawley rats and Swiss albino mice were procured from National Institute of Nutrition (NIN) Hyderabad, India. Animals were kept in animal house to acclimatize in new environment. Animals were maintained in 25 ± 3 °C and 50 ± 20% relative humidity as well as day and night cycle. Only healthy animals were included in the study. This study was approved by Institutional Animal Ethics Committee of Indian Institute of Technology, Kharagpur, (64/03/ac/CPCSEA), India. The animal study was performed according to the guidelines of “Committee for the Purpose of Control and Supervision on Experiments on Animals (CPCSEA)”, Ministry of Environment and Forest, India.
Induction of sarcoma 180 solid tumor in Swiss albino mice and in vivo antitumor experiment
Swiss albino female mice (20–25 g) were obtained and kept in animal house before one week of initiation of experiment to acclimatize with new laboratory environment. The animal maintenance and experiment was carried out with the approval of Institutional animal ethical committee of Indian Institute of Technology Kharagpur. Sarcoma 180 cells were collected from maintenance mice and injected subcutaneously in right flank area of mice involved in experiment to develop solid tumor according to earlier reported method.18 After 7–8 days, tumors were grown and visible on the right flank of the mice. Tumor bearing mice were divided in different groups and injected Iturin A through tail vein. The treatment schedule was as following – (1) group-1: control (sterile PBS), (2) group-2: 5 mg kg−1, (3) group-3: 10 mg kg−1 and (4) group-4: 15 mg kg−1. Animals were treated for 28 days allowing one day interval. During the study period tumor volume of each animal were measured and recorded. After the scheduled treatment, all animals were sacrificed, and finally tumor volume and weight were measured.
Western blot analysis and immunohistochemistry of tumor tissue
After sacrifice of animals, tumors were divided into two parts-one section was kept for immunoblot analysis and another section was fixed in 10% formalin for immunohistochemical analysis according to the previous method.19 Immunoblot of tissue samples was carried for checking expression profile of Bcl2, Bax, PARP, cleaved caspase 3, P-Akt, P-MAPK, T-Akt and T-MAPK. Further, tumor tissue samples were processed immunohistochemistry to evaluate expression of Ki-67, CD-31, P-Akt and P-MAPK.20 Tissues sections were also stained with TUNEL/PI according to the manufacturer instructions.
Design of toxicity study
For 28 days sub-chronic toxicity study, healthy female rats were randomly divided in four groups. Dose level of Iturin A was selected based on our preliminary study. The dose level 150 mg kg−1 of Iturin A caused lethality in all animals. So, we have taken 50 mg kg−1 of Iturin A for highest dose as well as recovery group. Dose grouping was scheduled as follow: group-1: control, group-2: 10 mg kg−1, group-3: 20 mg kg−1, group-4: 50 mg kg−1, group-5: 50 mg kg−1 (recovery group). In groups 1, 2, 3 and 4, animals were treated for 28 days in an alternative day. After 28 days treatment all rats were sacrificed for toxicological evaluation. In recovery group, animals were treated for 28 days and kept for 14 days without drug exposure. After that, animals were sacrificed for evaluation of toxicity.
Clinical observations
During the study, we noticed all animals every day for clinical signature of toxicity and mortality. We have also recorded clinical observations.
Body weight
The decreases of body weight are the indirect indicator of toxicity. So, at the beginning of study, the body weights of all animals were measured and after that, every week body weight was measured.
Intake of food and water
Intake of food as well as water in every group was monitored regularly. At the beginning and weekly, food and water intake were evaluated measuring the changes in food and water weight supplied to every cage.
Blood hematology
After the 28 days of treatment, all animals were kept on fast and next day, blood was taken from animals by puncturing the retro-orbital vein. Collected blood samples were kept in EDTA containing tube to prevent blood coagulation. Following hematological parameters including hemoglobin (HB), red blood cell (RBC), white blood cell (WBC) and its differential count (monocyte, lymphocyte and granulocyte), Packed Cell Volume (PCV), mean corpuscular volume (MCV), mean corpuscular hemoglobin concentration (MCHC), reticulocytes (RT) and platelet (PLT) were performed at Clinical pathology laboratory, Medilab, Kolkata, India. Blood samples were also collected from recovery group and same hematological parameters were analyzed.
Serum biochemistry analysis
For serum biochemical analysis, blood sample were kept without anti-coagulant and centrifuged (within one hour, 3000 r.p.m for 10 minutes) to separate the serum. The serum was kept in −80 °C for biochemical analysis. A number of biochemical parameters including glucose, blood urea nitrogen (BUN), creatinin, uric acid, triglyceride, total cholesterol, total bilirubin, unconjugated bilirubin, conjugated bilirubin, serum glutamic-pyruvic transaminase (SGPT), serum glutamic oxaloacetic transaminase (SGOT), alkaline phosphatase (ALP), total protein, albumin, globulin and lactate dehydrogenase (LDH) were performed. In recovery group, same biochemical parameters were evaluated from blood sample.
Histopathology
To evaluate the toxicological effect of Iturin A in major organs, histopathological study was performed in lung, liver, kidney, heart and spleen. After 28 days of treatment, animals were sacrificed and major organs were collected. Collected samples were immediately put in 10% formalin solution for fixation. Formalin fixed major organs were further processed and embedded in paraffin wax. Embedded organs were sliced with microtome (5 μm thick). Hematoxylin and eosin staining was performed in tissue sections according to earlier reported method.21 Then, slides were processed and mounted with D.P.X. Different organ sections were observed under the microscope.
Radio labeling of Iturin A with 99mTc
(i) Synthesis of 99mTc–Iturin A. Radio labelling of Iturin A was performed by previously reported method with few modifications.22,23 Prior to mixing, nitrogen purging was carried out to degas all solutions. Then, 5 mg of solid sodium borohydride was added to 100 μl of 99mTc (111 MBq) in saline directly with continuous stirring followed by immediate addition of 80 μl of the Iturin A solution (1 mg ml−1, Iturin A in Tris–HCl buffer, pH 7.4). The solution was stirred for 45 min at room temperature (25 ± 2 °C). The contents were filtered using 0.22-micron filter (Millipore Corporation, Carrigtwohill, Ireland) and transferred into an evacuated sterile sealed vial and used for further experiment.
(ii) Quality control and stability study. Quality control was performed by following method as described earlier.24 The labelling efficiency of 99mTc to Iturin A was assessed by ascending instant thin layer chromatography using silica gel plates (ITLC-SG). The ITLC-SG was performed using acetone as the mobile phase. Approximately, 1–2 μl of the radiolabelled complex was applied at the bottom point, 1.0 cm from the end of an ITLC strip. The strip was developed until solvent front reached 8.5 cm from the origin. The labelling efficiency was estimated after dividing the ITLC sheets into two equal halves and counting radioactivity of each segment using gamma ray spectrometer (GRS 23C, ECIL, Mumbai, India). The stability of 99mTc–Iturin A was checked for 24 h at room temperature. Labelling efficiency was calculated using the following equation.
Stability study of 99mTc–Iturin A complex/in vitro stability tests
In vitro stability of the 99mTc–Iturin A complex was determined in phosphate buffer saline (PBS) [pH 7.4] and in rat serum separately at different time points, at room temperature.22 The labelled complex (0.1 ml) was incubated with 0.4 ml of PBS or freshly collected rat serum. The stability tests were performed by determining the changes in labelling efficiency. The samples were analyzed by using ITLC at regular intervals up to 24 h. Chromatograms were obtained in gamma ray spectrometer.
Bio-distribution of 99mTc–Iturin A
Bio-distribution studies were performed in Sprague-Dawley rats (body weight ∼ 200–220 g).22 99mTc–Iturin A complex solution (approximately 500 μCi, 60 μl) was administered through the femoral vein of anaesthetized rats with 0.5 mm polyethylene (PE) catheter. At different time intervals (5 min, 30 min, 1 h, 2 h and 4 h), the animals were sacrificed by intravenous injection of air. Urine samples were obtained by puncturing urinary bladder. Other organs (brain, blood, heart, liver, lungs, spleen, muscle, kidney, intestines, stomach and pancreas) were removed, rinsed with saline and blotted to remove any adherent material. The organs were collected in pre-weighed scintillation tubes after drying. Then organs were weighed and radioactivity was counted in a well-type counter (gamma ray spectrometer) with respect to suitably diluted aliquots of the injected solution as standard. The bio-distribution of 99mTc labelled Iturin A in each organ was calculated as a percentage of the injected dose per gram of the tissue (% ID per g).
Scintigraphy of 99mTc–Iturin A
Imaging studies were performed on normal Sprague-Dawley rat (200–220 g) at Thakurpukur Cancer Research Centre (Regional Radiation Monitoring Centre, Kolkata, India) under dual-head gamma camera (GE Hawkeyes, Pittsburgh, USA). The urethane-anaesthetised rat was injected via the femoral vein with a bolus containing 99mTc–Iturin A (approximately 500 μCi, 60 μl). Rat was placed in a typical position for planar imaging under a small field of view experimental gamma camera, suitable for both planar and tomographic imaging. Whole body image acquisition study was done at 5 min, 30 min, 45 min and 90 min after injection, and scan time was 30 seconds. Image data were obtained and analyzed using a gamma camera (GE Hawkeyes) fitted with a low energy high-resolution all purpose collimator using static procedure of the Xeleris (Functional Imaging) Workstation system.
Cytotoxicity assay
Cytotoxicity of Iturin A was performed in BRL-3A rat liver cell line by conventional MTT assay method using tetrazolium dye according to earlier reported method.19 Briefly, BRL-3A cells were harvested by trypsin–EDTA and centrifuged to obtain cell pallet. Cells were resuspended in complete DMEM medium. Then, cells were seeded in 96 well plates (2500 cells per well) and kept in incubator for overnight. Next day, cells were treated with various concentration of Iturin A for 48 h. Following 48 h treatment, medium containing drug was discarded and 100 μl of MTT (1 mg ml−1) solution was added in each well and kept for 4 h. After 4 h incubation, MTT solution was discarded and 100 μl DMSO was added in each well. After 10 minutes with gentle rocking, optical density was measured at 540 nm. Percentage of viability was calculated as O.D of control cell per O.D of treated cell × 100.
Morphological analysis by phase contrast microscopy
Morphology based toxicity profiling of Iturin A was performed by phase-contrast microscopy reported as early.18 BRL-3A rat liver cells were seeded in six well plats and treated with Iturin A in time dependent manner with IC50 dose in serum free medium. After treatment, phase contrast images were captured by microscope (Leica, Solms, Germany).
TUNEL assay
DNA fragmentation was evaluated in BRL-3A cells treated with Iturin A by in situ Cell Death Detection Kit according to earlier reported method.19 Briefly, cells were harvested and seeded on poly-L-lysin coated cover slips. Cells were grown and treated with Iturin A in different concentration. After 48 h, cells were washed with PBS and fixed in 4% paraformaldehide solution. Then, cells were stained with TUNEL reaction mixture according to manufactures protocol. Propidium iodide was used as counter stain for nucleus. Fluorescent images were taken under a Zeiss Observer Z1 microscope (Carl Zeiss, Germany).
Western bolt analysis
Western blot was performed to evaluate protein expression according to earlier reported methods.12,25 BRL-3A cells were seeded on 60 mm Petri dishes. After 70% confluence, cells were treated with Iturin A at different concentrations for 48 h. Then, cells were collected and lysed with lysis buffer. Protein samples were prepared and subjected to SDS-PAGE. Proteins were transferred to nitrocellulose membrane and blocked with 5% BSA. Then, blots were incubated with primary antibodies and secondary antibody respectively. After proper washing, blots were developed using luminol by Image Quant LAS 4000 (GE Healthcare Life Sciences, NJ, USA).
Software and statistical analysis
Each experiment was performed at least three times and experimental data were presented as mean ± standard deviation. Unpaired t-test and ANOVA were used to analysis the results by GraphPad prism software (La Jolla, CA, USA). The level of significance is represented by P-value (<0.05).
Results
Iturin A showed antitumor potential in sarcoma 180 solid tumor model in mice
Sarcoma 180 solid tumor bearing Swiss albino mice were injected with Iturin A (Fig. 1A) to evaluate therapeutic potential of this compound. During the study period tumor volume was observed. It was found that, the tumor volume of control group steadily increased. While, other treated groups displayed dose dependent suppression of tumor growth. At the end of 28 days treatment, mice were sacrificed and weights of excised solid tumor were measured (Fig. 1B–D). Significant tumor inhibition was also noticed in treated group compared to control.
 |
| | Fig. 1 Therapeutic efficacy of Iturin A in sarcoma 180 mice model. (A) The chemical structure of Iturin A. (B) Representative images of tumor bearing mice and excised tumor. (C) Graphical representation of tumor volume from different group of tumor bearing mice. (D) Graphical representations of tumor weight from different group. (E and F) Western blot analyses of various apoptotic, anti-apoptotic and survival proteins. P value less than 0.05 was considered to be significant. | |
Immunoblot analysis revealed alter profile of apoptosis related and phospho proteins
Tumor tissues of different groups were processed for immunoblot analysis. At first, we checked expression level of proteins (Bcl-2, Bax, Cleaved Caspase 3 and PARP) involved in apoptosis. Antiapoptotic protein Bcl-2 was down-regulated in treated groups (Fig. 1E). Bax which is an apoptotic protein was up-regulated in Iturin A treated groups. Caspase activation and PARP cleavage were also observed due to the dose dependent treatment of Iturin A. Further, western blot analysis was performed to check the expression of oncogenic proteins Akt and MAPK. Phospho levels of Akt and MAPK were diminished while total proteins remained unchanged (Fig. 1F). β-Actin was shown as loading control displaying equal amount of proteins loaded in every well.
TUNEL assay
TUNEL assay was performed to detect DNA fragmentation in tumor tissue after Iturin A treatment in mice. In control group, only propidium iodide (red fluorescent) staining was observed and there were no TUNEL positive (green fluorescent indicating apoptotic DNA fragmentation) cells (Fig. 2). In treated groups, population of TUNEL positive cells steadily increased in a dose dependent manner.
 |
| | Fig. 2 TUNEL assay and immunohistochemical analysis. Tumor tissue samples were processed for TUNEL assay to detect apoptotic DNA fragmentation. The green color indicated presence of DNA fragmentation and red color indicate the nucleus. Further, immunohistochemistry was performed to check expression of various proteins. | |
Immunohistochemical analysis
Immunohistochemistry of tumor sections from different groups were performed to evaluate different marker proteins and survival proteins associated cancer. CD-31 which is angiogenesis marker protein was found to be downregulated in dose dependent Iturin A treated groups (Fig. 2). Other protein marker, Ki-67 is the proliferation marker in tumor micro environment. Expression of this Ki-67 was reduced in treated groups indicating the anti-proliferative potential of Iturin A in sarcoma 180 solid tumor model. In addition, other survival and oncogenic protein P-Akt and P-MAPK were decreased in dose dependent Iturin A treated groups.
Clinical symptoms and mortality rate
Treatment related symptoms like salivation, redness around the nose, fur shading and change in body movement were not significantly observed in treated groups of rats (10, 20 and 50 mg kg−1 body weight). In recovery group, these symptoms were also not observed. During the treatment period, no mortality in the animals was observed in each group.
Trends of food/water intake and body weight
During the experiment, food and water consumption were noticed regularly. There were no significant changes in food and water intake.
Hematology
After 28 days treatment as well as recovery period, blood samples were collected and analyzed for hematology. Hematological findings in different treated groups as well as controls were shown in Table 1. The results showed that hematological parameters including PCV, MCV, MCH, MCHC, neutrophil, lymphocyte, monocyte and basophil were not significantly altered in treated as well as recovery groups compared to control. Hemoglobin count was mildly decreased and reticulocytes count was slightly elevated along with elevation of RBC, WBC and PLT in treated groups. These may be due to mild anemia in rats induced by Iturin A treatment. Eosinophil counts were significantly increased in treated groups. Although in recovery group, eosinophil counts were found to return within normal value. All the altered parameters were found to return within normal range in recovery group indicating reversible toxicity of Iturin A.
Table 1 Complete hematology in female Sprague Dawley rats. Values represent mean ± standard deviation (n = 6)a
| Parameters |
Con |
Low dose |
Medium dose |
High dose |
Recovery group |
Unit |
| RBC (Red Blood Cell), PLT (platelet), WBC (White Blood Cell), PCV (Packed Cell Volume), MCV (Mean Corpuscular Volume), MCH (Mean Corpuscular Hemoglobin), MCHC (Mean Corpuscular Hemoglobin Concentration). |
| HB |
13.72 ± 0.32 |
11.70 ± 0.45 |
11.56 ± 0.19 |
11.40 ± 0.54 |
12.7 ± 0.52 |
g dl−1 |
| RBC |
4.70 ± 0.70 |
6.10 ± 0.35 |
6.01 ± 0.29 |
6.25 ± 0.44 |
5.21 ± 0.62 |
Million |
| PLT |
4.12 ± 0.69 |
4.51 ± 0.58 |
5.25 ± 0.69 |
5.10 ± 0.32 |
4.42 ± 0.15 |
Lacks per cmm |
| WBC |
5.54 ± 0.37 |
7.83 ± 0.21 |
7.21 ± 0.76 |
6.86 ± 0.35 |
4.42 ± 0.10 |
103 per cmm |
| PCV |
46.10 ± 1.18 |
36.40 ± 1.01 |
36.30 ± 0.98 |
36.50 ± 0.50 |
46.80 ± 1.25 |
% |
| MCV |
78.21 ± 3.12 |
69.70 ± 4.50 |
67.42 ± 3.39 |
65.70 ± 2.11 |
79.24 ± 4.55 |
μm3 |
| MCH |
22.81 ± 1.66 |
20.25 ± 1.98 |
21.50 ± 1.79 |
19.67 ± 2.31 |
21.24 ± 1.92 |
pg |
| MCHC |
27.23 ± 0.98 |
29.41 ± 1.32 |
29.56 ± 1.49 |
29.81 ± 1.29 |
26.73 ± 1.42 |
g dl−1 |
| Neutrophil |
40.89 ± 0.85 |
43.23 ± 0.45 |
42.67 ± 1.23 |
40.12 ± 0.89 |
35.5 ± 1.05 |
% |
| Lymphocyte |
55.25 ± 0.20 |
47.68 ± 2.05 |
49.62 ± 1.61 |
49.29 ± 3.26 |
59.92 ± 2.29 |
% |
| Monocyte |
2.85 ± 0.15 |
2.13 ± 0.87 |
2.07 ± 0.89 |
2.50 ± 0.54 |
2.48 ± 0.09 |
% |
| Eosinophil |
2.21 ± 0.42 |
6.62 ± 0.81 |
7.80 ± 0.21 |
7.95 ± 0.32 |
2.69 ± 0.31 |
% |
| Basophil |
0.21 ± 0.11 |
0.12 ± 0.08 |
0.0 ± 0.0 |
0.08 ± 0.06 |
0.0 ± 0.0 |
% |
| RT count |
2.01 ± 0.16 |
2.05 ± 0.21 |
2.81 ± 0.35 |
3.54 ± 0.08 |
2.95 ± 0.50 |
% |
Serum biochemical analysis
Serum biochemical analysis was performed after 28 days treatment of Iturin A and recovery period in different groups of rat. The results of serum biochemical findings were presented in Table 2. Most of the serum biochemical parameters were found not significantly changed. Levels of SGPT and SGOT enzyme were significantly increased in treated groups indicating some toxicity in liver induced by Iturin A treatment. However, the levels of SGPT and SGOT returned to almost normal level in recovery group.
Table 2 Serum biochemistry in female Sprague Dawley rats. Values represent mean ± standard deviation (n = 6)a
| Parameters |
Con |
Low dose |
Medium dose |
High dose |
Recovery group |
Unit |
| Blood urea nitrogen (BUN), serum glutamic-pyruvic transaminase (SGPT), serum glutamic-oxaloacetic transaminase (SGOT), alkaline phosphatise (ALP), lactate dehydrogenase (LDH). |
| Glucose (R) |
134.05 ± 3.21 |
113.19 ± 4.29 |
110.95 ± 3.82 |
129.06 ± 6.72 |
91.62 ± 3.36 |
mg dl−1 |
| BUN |
27.50 ± 0.52 |
28.64 ± 0.68 |
29.69 ± 1.05 |
30.80 ± 1.41 |
29.22 ± 0.95 |
mg dl−1 |
| Creatinin |
0.41 ± 0.02 |
0.68 ± 0.08 |
0.74 ± 0.06 |
0.78 ± 0.01 |
0.58 ± 0.03 |
mg dl−1 |
| Uric acid |
6.12 ± 0.57 |
5.63 ± 0.76 |
6.92 ± 0.43 |
7.84 ± 0.91 |
6.71 ± 0.42 |
mg dl−1 |
| Triglygeride |
74.59 ± 1.25 |
71.94 ± 2.01 |
67.79 ± 2.98 |
85.55 ± 3.15 |
38.86 ± 5.79 |
mg dl−1 |
| Total cholesterol |
86.52 ± 0.96 |
59.98 ± 1.38 |
65.66 ± 1.96 |
71.61 ± 2.10 |
45.29 ± 2.58 |
mg dl−1 |
| Total bilirubin |
0.43 ± 0.06 |
0.75 ± 0.02 |
0.89 ± 0.04 |
0.83 ± 0.08 |
0.56 ± 0.04 |
mg dl−1 |
| Conjugated bilirubin |
0.25 ± 0.01 |
0.41 ± 0.03 |
0.43 ± 0.07 |
0.52 ± 0.07 |
0.32 ± 0.04 |
mg dl−1 |
| Unconjugated bilirubin |
0.23 ± 0.08 |
0.31 ± 0.06 |
0.36 ± 0.02 |
0.32 ± 0.07 |
0.29 ± 0.03 |
mg dl−1 |
| SGPT |
105.52 ± 8.52 |
132.47 ± 2.86 |
152.89 ± 2.98 |
227.71 ± 2.35 |
117.42 ± 4.52 |
IU l−1 |
| SGOT |
191.97 ± 5.56 |
221.93 ± 2.21 |
278.81 ± 2.69 |
299.45 ± 5.34 |
188.80 ± 6.62 |
IU l−1 |
| ALP |
596.49 ± 8.98 |
542.87 ± 6.79 |
445.67 ± 4.78 |
430.50 ± 6.61 |
345.67 ± 4.49 |
IU l−1 |
| Total protein |
6.85 ± 0.23 |
6.98 ± 0.97 |
7.08 ± 0.47 |
7.22 ± 0.62 |
6.47 ± 0.35 |
g dl−1 |
| Albumin |
3.86 ± 0.97 |
3.69 ± 0.48 |
3.81 ± 0.69 |
4.19 ± 0.51 |
4.69 ± 0.38 |
g dl−1 |
| Globulin |
3.21 ± 0.71 |
3.31 ± 0.62 |
3.22 ± 0.29 |
3.15 ± 0.72 |
2.48 ± 0.39 |
g dl−1 |
| LDH |
338.82 ± 7.71 |
251.72 ± 6.61 |
236.72 ± 5.51 |
246.92 ± 9.92 |
186.43 ± 5.21 |
IU l−1 |
| Sodium |
139.87 ± 7.25 |
141.45 ± 3.84 |
136.50 ± 2.98 |
149.16 ± 5.21 |
131.85 ± 2.87 |
nmol l−1 |
| Potassium |
3.52 ± 0.81 |
4.10 ± 0.60 |
4.51 ± 0.41 |
4.61 ± 0.32 |
3.83 ± 0.21 |
nmol l−1 |
Histopathology of major organs
Histopathological analysis of major organs including liver, lung, kidney, heart and spleen was performed following 28 days of treatment as well as recovery period (Fig. 3A). Hematoxilin and eosin staining of lungs, heart and kidney from different groups showed no significant morphological changes in Iturin A treated rats (Fig. 3B). Iturin A displayed no toxic effect in these major organs. However, some toxic effects were found in liver and spleen as indicated by morphological observations. In liver low dose of Iturin A showed no toxic effect. In medium dose groups, dilated hepatic veins and hemorrhage in sinusoidal space were observed in liver. In high dose group, peri-portal fibrosis of liver was detected. However, normal architecture of liver was found in recovery groups indicating reversible toxic effect after discontinuation of Iturin A treatment. In spleen, dose dependent excess accumulation of hemosiderin was detected in splenic macrophage. In recovery group, this deposition of hemosiderin was not detected in spleen (Fig. 3B).
 |
| | Fig. 3 Design of toxicity study and H&E staining of major organs. After 28 days of treatment and recovery period Sprague Dawley rats were sacrificed and major organs were processed for H&E staining to detect organ specific toxicity induced by Iturin A. | |
99mTc labeling of Iturin A and stability of the synthesized complex
More than 98% (98.37 ± 0.26%, n = 5) of 99mTc was found to label the Iturin A molecules as calculated from the labelling efficiency equation. The complexation of 99mTc with Iturin A was found to be satisfactory at the reaction conditions mentioned in this article. The resulting complex of 99mTc–Iturin A was found to be quite stable up to 2 h (labelling efficiency was maintained greater than 95%). Then labelling efficiency decreased slightly at 4 h (∼94%), and the calculated labelling efficiency was found ∼89% at 24 h (Table 3).
Table 3 Stability of 99mTc–Iturin A at room temperature at different time points, values represent mean ± Standard Deviation (SD) (n = 3)
| Time (hour) |
Labelling efficiency (%) |
| 1 |
97.41 ± 0.32 |
| 2 |
96.53 ± 0.26 |
| 4 |
94.81 ± 0.41 |
| 6 |
93.66 ± 0.29 |
| 24 |
89.06 ± 0.37 |
In vitro serum stability determination of the radiolabelled complexes is a decisive parameter for their stability. The serum contains proteins which may chelate and bind to 99mTc, disturbing the stability of labelled complex. Apart from that, physiological pH (i.e. 7.4) may also affect the stability of the complex. It was found that 99mTc–Iturin A complex was stable in PBS and rat serum Table 4 for 24 h post labelling (greater than 85% labelling efficiency was maintained). The stability of the labelled complex in PBS and serum supports its stability in biological environment upon administration into the body.
Table 4 Stability of 99mTc–Iturin A in PBS and rat serum, values represent mean ± SD (n = 3)
| Time |
Labelling efficiency in PBS (%) |
Labelling efficiency in serum (%) |
| 5 min |
96.32 ± 0.07 |
95.58 ± 0.48 |
| 30 min |
94.96 ± 0.25 |
94.03 ± 0.57 |
| 1 h |
92.88 ± 0.92 |
92.23 ± 0.41 |
| 2 h |
92.65 ± 0.87 |
91.59 ± 0.36 |
| 6 h |
90.53 ± 0.56 |
88.38 ± 0.81 |
| 24 h |
87.62 ± 0.91 |
85.74 ± 0.69 |
Biodistribution and scintigraphy of 99mTc–Iturin A in normal rats
The organ distribution pattern of 99mTc–Iturin A expressed as the % ID per g of tissue in rats after 5 min, 30 min, 1 h, 2 h and 4 h is presented in Table 5. 99mTc–Iturin A was distributed rapidly after intravenous administration as shown by its biodistribution. However, the blood concentration of the complex decreased with time, indicating elimination of the complex from the blood compartment. Apart from kidney, urine and urinary bladder, the uptake of 99mTc–Iturin A was significant in liver, lungs and spleen at all time points studied. Biodistribution of 99mTc–Iturin A also suggested that the complex was rapidly eliminated mainly through kidney (Table 5). Whole body images of normal rats at 5 min, 30 min, 45 min and 90 min after 99mTc–Iturin A administration are presented (Fig. 4). The complex was distributed to almost every organ as it was found in biodistribution study. Major organs of uptake of 99mTc–Iturin A can be visualized by this study. Apart from that elimination of 99mTc–Iturin A can also be observed with increase in time. Results in biodistribution studies were supported by scintigraphic images of this complex.
Table 5 Biodistribution studies of 99mTc–Iturin A in normal Sprague Dawley rats, values represent mean ± standard deviation (n = 6)
| Organ |
5 min |
30 min |
1 h |
2 h |
4 h |
| Heart |
0.51 ± 0.06 |
0.22 ± 0.02 |
0.14 ± 0.02 |
0.12 ± 0.01 |
0.09 ± 0.00 |
| Blood |
1.44 ± 0.12 |
0.98 ± 0.09 |
0.77 ± 0.06 |
0.69 ± 0.04 |
0.31 ± 0.02 |
| Liver |
2.71 ± 0.15 |
2.94 ± 0.11 |
3.44 ± 0.16 |
3.34 ± 0.14 |
3.19 ± 0.12 |
| Lungs |
2.03 ± 0.09 |
2.41 ± 0.12 |
2.54 ± 0.08 |
2.76 ± 0.05 |
1.33 ± 0.04 |
| Spleen |
2.35 ± 0.07 |
3.22 ± 0.14 |
1.97 ± 0.10 |
1.82 ± 0.06 |
1.65 ± 0.08 |
| Muscle |
0.05 ± 0.01 |
0.11 ± 0.01 |
0.19 ± 0.02 |
0.24 ± 0.02 |
0.14 ± 0.00 |
| Kidney |
2.74 ± 0.11 |
2.94 ± 0.16 |
3.14 ± 0.10 |
3.52 ± 0.08 |
3.06 ± 0.09 |
| Intestine |
0.21 ± 0.03 |
0.25 ± 0.01 |
0.42 ± 0.02 |
0.21 ± 0.02 |
0.19 ± 0.01 |
| Stomach |
0.30 ± 0.02 |
0.51 ± 0.06 |
0.64 ± 0.04 |
0.71 ± 0.03 |
0.55 ± 0.02 |
| Urine & urinary bladder |
1.63 ± 0.14 |
2.53 ± 0.12 |
3.92 ± 0.11 |
6.80 ± 0.19 |
7.22 ± 0.25 |
| Pancreas |
0.15 ± 0.02 |
0.15 ± 0.02 |
0.16 ± 0.01 |
0.17 ± 0.01 |
0.24 ± 0.01 |
| Brain |
0.05 ± 0.01 |
0.03 ± 0.00 |
0.03 ± 0.00 |
0.02 ± 0.00 |
0.01 ± 0.00 |
 |
| | Fig. 4 Bio-distribution study of 99mTc–Iturin A in Sprague Dawley rat. Rats were injected with 99mTc–Iturin A and after 5 min, 30 min, 45 min and 90 min images were taken by gamma camera. The images showed accumulation of Iturin A in different major organs including liver, kidney, spleen, lung and urinary bladder. | |
In vitro toxicological effect of Iturin A on BRL-3A rat liver cell
We treated the BRL-3A cells with various concentrations of Iturin A for 48 h and cell viability was determined by MTT based cytotoxicity assay. The IC50 concentration (concentration required to inhibit 50% cell population) of Iturin A was evaluated and found to be 49.81 ± 0.59 μM (Fig. 5A). This IC50 value was significantly higher compared to the IC50 values in breast cancer cell lines (MDA-MB-231: 7.98 ± 0.19, MCF-7: 12.16 ± 0.24, MDA-MB-468: 13.30 ± 0.97 and T47D: 26.29 ± 0.78 μM) as reported in our earlier study.12 So, treatment of higher dose of Iturin A was found to cause significant toxicity in BRL-3A cells. In further study, BRL-3A cells were treated with IC50 dose (∼50 μM) of Iturin A for 12, 24 and 48 h following cellular morphology was observed. Time dependent prominent morphological changes including cellular shrinkage, loss of lamellipodia and filopodia were detected in Iturin exposed cells (Fig. 5B). To find out the apoptotic cell death in treated BRL-3A cell, TUNEL assay was performed. The numbers of apoptotic cells were increased in time dependent Iturin A treated groups (Fig. 5C). The western blot analysis was performed to check various survival and apoptotic proteins (Fig. 5D and E). The expression of Bcl-2 and was decreased in treated cells. Apoptotic protein Bax was up-regulated and cleaved caspase 3 was also up-regulated. P-Akt and P-MAPK were decreased in treated cell. The total proteins of Akt and MAPK were unchanged.
 |
| | Fig. 5 Cytotoxicity of Iturin A in BRL-3A rat liver cells. (A) MTT assay of BRL-3A cell treated with different doses of Iturin A. (B) Morphological study of BRL-3A cells treated with IC50 dose of Iturin A for time dependent manner. (C) Apoptotic effect of Iturin A was detected in BRL-3A cells by TUNEL assay. (D and E) Western blot analyses of different apoptotic, anti-apoptotic and survival proteins were evaluated in BRL-3A cells treated with Iturin A in time dependent manner. Dencitometric plots of different proteins were also shown in figures. P value less than 0.05 was considered to be significant. | |
Discussions
Iturin A is the member of cyclic lipopeptide class derived from microbial origin. These lipopeptides are very promising biomolecules to develop as potential drug candidate. In our previous articles, we discussed commercial utilization4 and therapeutic application3 of these molecules. Iturin A was found to inhibit breast cancer progression through inducing apoptosis via hampering Akt dependent GSK-3β and FoxO3a oncogenic pathway.12 In the current study, we tested antitumor efficacy of Iturin A in mouse sarcoma 180 solid tumor models. The present study also investigated 28 days repeated dose toxicity profile and bio-distribution pattern of Iturin A in Sprague Dawley rat. In vivo antitumor efficacy of Iturin A was observed in Swiss albino mice (Fig. 1B). Dose dependent tumor suppressive effect of this molecule was proved by decreased tumor weight and volume (Fig. 1C and D). Further, altered profile of apoptosis related proteins was detected by western blot analysis of tumor tissue. During apoptosis induction, various regulatory proteins participate to execute cell death. Our findings revealed Iturin A induced apoptotic effect in sarcoma 180 tumors as confirmed by decreased Bcl-2, increased Bax expression, caspase and PARP cleavage (Fig. 1E). Akt and MAPK are the survival proteins that promote tumor progression, inhibition of apoptosis and angiogenesis in many cancers.26,27 Inhibition of these proteins is the well established cancer therapeutics strategies. Our results showed that Iturin A significantly suppressed phospho protein of Akt and MAPK (Fig. 1F). Expression of total protein of Akt and MAPK was not significantly changed Iturin A treated groups. TUNEL assay is the common method for determination of DNA fragmentation caused by activation of apoptotic signaling network.28 In Iturin A treated groups, degree of DNA fragmentation (green florescent) was found to be increased in time dependent manner (Fig. 2). Further, immunohistochemical analysis of tumor tissue sections showed downregulation of CD-31 (angiogenesis marker), Ki-67 (cell proliferation marker), P-Akt and P-MAPK in Iturin A treated groups. This entire evidence pinpointed the potential efficacy of Iturin A as antitumor, anti-proliferative and anti-angiogenic candidate.
Assessment of safety profile is the critical step for the development of bioactive molecules as clinically useful drug candidate. Extensive pre-clinical and clinical studies are generally performed in a large population to monitor adverse drug reactions. In our previous12 as well as current study, Iturin A was found to suppress cancer progression in different models. Considering this huge therapeutic possibility, pre-clinical toxicity study is very much necessary. For toxicity study, blood hematology, serum biochemistry and histopathological findings were observed after 28 days of Iturin A treatment and recovery period in Sprague Dawley rat. In toxicity study, most of the hematological parameters were not significantly altered. However, mild anemia was observed in treated groups due to hemoglobin depletion and elevation of reticulocytes, RBC, WBC and PLT (Table 1). In recovery group, the level of above parameters returned to normal value. According to the findings of serum biochemistry, most of the parameters remained not significantly changed. However, SGPT and SGOT levels were elevated due to hepatotoxicity induced by Iturin A (Table 2). Histopathological analysis of major organs revealed some organ specific adverse effect of Iturin A. Normal architecture of heart, lungs and kidney was observed in control and treated groups. But, some toxicological observations were found in liver and spleen of the treated groups (Fig. 3). These included dilated hepatic veins, hemorrhage in sinusoidal space and periportal fibrosis in liver. In spleen, accumulation of hemosiderin was detected in Iturin A treated rats. Interestingly, normal architecture of all major organs was detected in recovery groups. Bio-distribution study is the essential component of pre-clinical safety evaluation. Distribution pattern inside the body can indicate the possible adverse effects of drug molecule. In the current investigation, at first Iturin A was radiolabeled with 99mTc and stability of 99mTc–Iturin A was studied (Tables 3 and 4). 99mTc–Iturin A was found to be deposited mainly in liver, lung and spleen (Table 5). Iturin A was eliminated by urine through kidney and urinary bladder (Fig. 4). However, adverse effect was detected only in liver and spleen in previous experiment (Fig. 3). Akt inhibition may also cause unwanted side effects in normal cells of the body.29 Our study indicated that this lipopeptide treatment caused reversible hepatotoxicity. MTT based cytotoxicity assay revealed IC50 dose of Iturin A 49.81 ± 0.59 μM (Fig. 5A) which is significantly higher compare to the IC50 of cancer cells reported in our previous report.12 This study indicated that Iturin A is less toxic to normal cells. To elucidate molecular mechanism of toxicity, rat liver cell line BRL-3 was treated with Iturin A. Iturin A caused apoptotic induction and DNA damage in rat liver cells (Fig. 5B and C). Mechanistic study at protein expression level further showed altered profile of a number of critical proteins. Iturin A modulated apoptosis regulatory proteins Bcl-2, Bax and Caspase expression in BRL-3A cells in (Fig. 5D). It also suppressed expression of survival proteins including Akt and MAPK in BRL-3A cells (Fig. 5E). This altered profile might be responsible for Iturin A mediated toxicological effects in liver.
In conclusion, the present study described the efficacy and safety of a bacterial derived lipopeptide Iturin A in rodent model. Iturin A was found to inhibit solid tumor growth in sarcoma 180 mouse xenograft model. The safety profile of this lipopeptide was also investigated in Sprague Dawley rat after 28 days of treatment and recovery period. Analyzing all findings, it can be concluded that Iturin A displayed some organs specific minimum toxicity that was found to be reversible after discontinuation of treatment. Further, rigorous and large scale studies are required to access in-depth unwanted effects of Iturin A.
Conflict of interest
There is no conflict of interest.
Abbreviations
| MAPK | Mitogen-activated protein kinases |
| PI3K | Phosphoinositide 3-kinase |
| GSK-3β | Glycogen synthase kinase-3 beta |
| Bcl-2 | B-cell lymphoma 2 |
| Bax | Bcl-2 associated X protein |
| PARP | Poly (ADP-ribose) polymerase |
| ITLS | Instant thin layer chromatography |
| TUNEL | TdT-mediated dUTP nick-end labeling |
Acknowledgements
We are very much grateful to Council of Scientific & Industrial Research (CSIR), Ministry of Human Resource Development (MHRD), BRNS and Department of Science & Technology (DST), India for providing fellowship to carry out research work.
References
- E. J. Gudina, V. Rangarajan, R. Sen and L. R. Rodrigues, Trends Pharmacol. Sci., 2013, 34, 667–675 CrossRef CAS PubMed.
- S. M. Mandal, A. E. A. D. Barbosa and O. L. Franco, Biotechnol. Adv., 2013, 31, 338–345 CrossRef CAS PubMed.
- G. Dey, R. Bharti, R. Sen and M. Mandal, Drug Discovery Today, 2015, 20, 136–146 CrossRef CAS PubMed.
- S. Mukherjee, P. Das and R. Sen, Trends Biotechnol., 2006, 24, 509–515 CrossRef CAS PubMed.
- W. Wrasidlo, A. Mielgo, V. A. Torres, S. Barbero, K. Stoletov, T. L. Suyama, R. L. Klemke, W. H. Gerwick, D. A. Carson and D. G. Stupack, Proc. Natl. Acad. Sci. U. S. A., 2008, 105, 2313–2318 CrossRef CAS PubMed.
- X. H. Cao, A. H. Wang, R. Z. Jiao, C. L. Wang, D. Z. Mao, L. Yan and B. Zeng, Cell Biochem. Biophys., 2009, 55, 163–171 CrossRef CAS PubMed.
- Y. M. Lee, H. T. Dang, J. Hong, C. O. Lee, K. S. Bae, D. K. Kim and J. H. Jung, Bull. Korean Chem. Soc., 2010, 31, 205–208 CrossRef CAS.
- Y. Yamazaki, S. Kunimoto and D. Ikeda, Biol. Pharm. Bull., 2007, 30, 261–265 CAS.
- Y. X. Liu, B. K. Law and H. Luesch, Mol. Pharmacol., 2009, 76, 91–104 CrossRef CAS PubMed.
- R. Bharti, G. Dey and M. Mandal, Cancer Lett., 2016, 375, 51–61 CrossRef CAS PubMed.
- X. Liu, X. Tao, A. Zou, S. Yang, L. Zhang and B. Mu, Protein Cell, 2010, 1, 584–594 CrossRef CAS PubMed.
- G. Dey, R. Bharti, G. Dhanarajan, S. Das, K. K. Dey, B. N. Kumar, R. Sen and M. Mandal, Sci. Rep., 2015, 5, 10316 CrossRef CAS PubMed.
- D. A. Fruman and C. Rommel, Nat. Rev. Drug Discovery, 2014, 13, 140–156 CrossRef CAS PubMed.
- Z. Ozcan, G. Gul and I. Yaman, Arch. Toxicol., 2015, 89, 1313–1327 CrossRef CAS PubMed.
- B. D. Manning and L. C. Cantley, Cell, 2007, 129, 1261–1274 CrossRef CAS PubMed.
- C. Garcia-Echeverria and W. R. Sellers, Oncogene, 2008, 27, 5511–5526 CrossRef CAS PubMed.
- S. K. Pal, K. Reckamp, H. Yu and R. A. Figlin, Expert Opin. Invest. Drugs, 2010, 19, 1355–1366 CrossRef CAS PubMed.
- S. Das, K. K. Dey, G. Dey, I. Pal, A. Majumder, S. MaitiChoudhury, S. C. Kundu and M. Mandal, PLoS One, 2012, 7 DOI:10.1371/journal.pone.0046641.
- R. Bharti, G. Dey, P. K. Ojha, S. Rajput, S. K. Jaganathan, R. Sen and M. Mandal, Oncogene, 2015 DOI:10.1038/onc.2015.466.
- K. K. Dey, S. Sarkar, I. Pal, S. Das, G. Dey, R. Bharti, P. Banik, J. Roy, S. Maity, I. Kulavi and M. Mandal, Cancer Cell Int., 2015, 15, 74 CrossRef PubMed.
- S. Parida, A. Parekh, G. Dey, S. C. Ghosh and M. Mandal, Cancer Biol. Ther., 2015, 16, 922–932 CrossRef CAS PubMed.
- I. Banerjee, A. Behera, K. De, S. Chattopadhyay, S. S. Sachdev, B. Sarkar, S. Ganguly and M. Misra, J. Radioanal. Nucl. Chem., 2015, 304, 633–643 CrossRef CAS.
- T. Banerjee, S. Mitra, A. K. Singh, R. K. Sharma and A. Maitra, Int. J. Pharm., 2002, 243, 93–105 CrossRef CAS PubMed.
- Textbook of radiopharmacy: theory and practice, ed. T. Ae, Gorden and Breach, New York, 1990 Search PubMed.
- L. E. Wohak, A. M. Krais, J. E. Kucab, J. Stertmann, S. Ovrebo, A. Seidel, D. H. Phillips and V. M. Arlt, Arch. Toxicol., 2016, 90, 291–304 CrossRef CAS PubMed.
- Q. Liu, H. W. Dong, W. G. Sun, M. Liu, J. C. Ibla, L. X. Liu, J. W. Parry, X. H. Han, M. S. Li and J. R. Liu, Arch. Toxicol., 2013, 87, 481–490 CrossRef CAS PubMed.
- E. K. Kim and E. J. Choi, Arch. Toxicol., 2015, 89, 867–882 CrossRef CAS PubMed.
- J. H. Jeon, Y. J. Choi, I. H. Han, B. K. Choi, S. H. Cha and W. H. Cho, Mol. Cell. Toxicol., 2012, 8, 69–76 CrossRef CAS.
- E. Geuna, D. Roda, S. Rafii, B. Jimenez, M. Capelan, K. Rihawi, F. Montemurro, T. A. Yap, S. B. Kaye, J. S. De Bono, L. R. Molife and U. Banerji, Br. J. Cancer, 2015, 113, 1541–1547 CrossRef CAS PubMed.
|
| This journal is © The Royal Society of Chemistry 2016 |
Click here to see how this site uses Cookies. View our privacy policy here.