
Ultrafast piezo-photocatalytic degradation of organic pollutions by Ag2O/tetrapod-ZnO nanostructures under ultrasonic/UV exposure
Cong Suna,
Yongming Fua,
Qiang Wanga,
Lili Xing*a,
Baodan Liu*b and
Xinyu Xue*a
aCollege of Sciences, Northeastern University, Shenyang 110004, China. E-mail: xuexinyu@mail.neu.edu.cn; xinglili@mail.neu.edu.cn
bInstitute of Metal Research, Chinese Academy of Sciences, Shenyang 110000, China. E-mail: baodanliu@hotmail.com
First published on 8th September 2016
Abstract
Ultrafast degradation of organic pollutions has been realized by the piezo-photocatalytic activity of Ag2O/tetrapod-ZnO nanostructures under ultrasonic/UV exposure. Tetrapod-ZnO (T-ZnO) nanostructures are synthesized in mass production by a thermal evaporation method, and Ag2O nanoparticles are uniformly loaded on the whole surface of T-ZnO nanostructures. Under both ultrasonic and UV exposure, Ag2O/T-ZnO nanostructures can efficiently co-use the mechanical and UV energy to degrade organic pollutions, and the degradation speed is extraordinarily fast. Taking methylene blue (MB) as an example, Ag2O/T-ZnO nanostructures (2 g L−1) can completely degrade an MB aqueous solution (5 mg L−1) within ∼2 min under ultrasonic (200 W) and UV (50 W) exposure. Such a degradation rate is much higher than previous results, and has potential applications in sewage treating techniques at the industrial level. In this process, the piezoelectric field of T-ZnO nanostructures and the build-in electric field of Ag2O/T-ZnO heterojunctions can separate the photogenerated electron–hole pairs, lowering the recombination rate and enhancing the photocatalytic activity. The present results can promote the development of sewage treating techniques for environmental improvement.
Introduction
A high-efficiency photocatalyst that can use unexhaustive solar energy to degrade organic pollutions in sewage has potential applications in environmental improvement.1–5 Recently, semiconducting metal-oxide nanostructures have been widely investigated due to their high photocatalytic activity, such as ZnO and TiO2 nanowires.6–11 Among them, ZnO nanostructures (with a band gap of 3.37 eV and exciton binding energy of 60 meV) are regarded as very promising candidates due to high photocatalytic efficiency, environmental compatibility, abundant availability and low cost. Under UV illumination, the electrons in the ZnO nanostructures can be excited from the valence band to the conduction band, leaving an equal number of holes in the valence band. The photogenerated carriers can migrate to the surface of ZnO nanostructures, participating in the oxidative/reductive reactions and degrading organic pollutions.12–17 During this process, the high recombination rate of photogenerated electrons/holes can lower down the photocatalytic activity of ZnO nanostructures, restraining the practical applications. Nowadays, many research efforts have been made to solve this problem, such as synthesizing heterostructured nanomateirals.18–20 In our previous work, the piezoelectric field of ZnO nanowires has been introduced into the photocatalytic process by applying deformation on the nanowires, and relatively high piezo-photocatalytic efficiency has been obtained.21 The piezoelectric field can drive the photogenerated electrons and holes migrating on the opposite directions, lowering down the recombination rate. However, the piezo-photocatalytic efficiency is still needed to be further enhanced. If the degradation time can be shortened to several minutes, the piezo-photocatalyst may be used in a sewage treatment plant.It has been reported that introducing build-in electric field of heterostructures on the surface of ZnO nanostructures can greatly enhance the photocatalytic efficiency, such as Ag2O/ZnO, CdS/ZnO and NiO/ZnO.22–24 Among them, Ag2O is typical p-type semiconductor with the band gap of 1.46 eV, close to the ideal value required for photoelectrochemical applications depending on the charge carrier-transfer mechanism.25,26 Also, Ag2O is very suitable to form heterostructures and establish build-in electric field because of its controllable and facile synthesis process.27–31 Thus, it can be expected that the coupling of piezoelectric field of ZnO nanostructures and the build-in electric field of Ag2O/ZnO heterostructures can greatly enhance the photocatalytic efficiency and shorten the degradation time of organic pollutions.
In this work, ultrafast degradation of organic pollutions has been realized by the piezo-photocatalytic activity of Ag2O/tetrapod-ZnO nanostructures under ultrasonic/UV exposure. Ag2O nanoparticles are uniformly coated on the whole surface of tetrapod-ZnO (T-ZnO) nanostructures. Under both ultrasonic and UV exposure, Ag2O/T-ZnO nanostructures can efficiently co-use the mechanical and UV energy to degrade organic pollutions, and the degradation speed is extraordinarily fast. The piezoelectric effect and the build-in electric field are coupled together in the photocatalytic process. Such a new sewage treating technique could have potential applications in green technologies for the environment improvement at the industrial level.
Results and discussion
Ag2O/T-ZnO nanostructures are synthesized by a simple two-step method, as shown in Fig. 1a. T-ZnO nanostructures are synthesized by thermal evaporation of Zn powder in air ambience, and Ag2O nanoparticles are loaded on T-ZnO nanostructures by a wet-chemical method. Fig. 1b is the optical image of Ag2O/T-ZnO nanostructures, showing that the composite nanostructures can be produced in mass production. Fig. 1c shows the experimental set for testing the piezo-photocatalytic activity of Ag2O/T-ZnO nanostructures. After adding Ag2O/T-ZnO nanostructures, the organic-dye aqueous solution is exposed to ultrasonic and UV irradiation. Fig. 1d shows the practical application of Ag2O/T-ZnO nanostructures co-using mechanical and UV energy (∼4% of solar energy) in the nature for sewage treatment.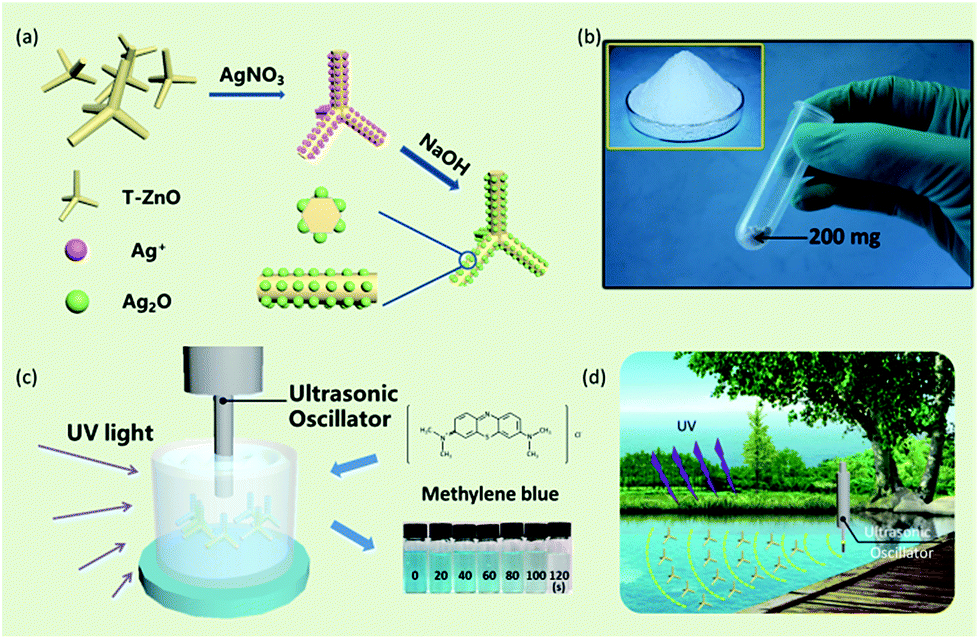 | ||
| Fig. 1 (a) Synthesis procedure of Ag2O/T-ZnO nanostructures. (b) Optical image of Ag2O/T-ZnO nanostructures, showing the mass production. (c) The degradation of MB solution by the piezo-photocatalytic activity of Ag2O/T-ZnO nanostructures under ultrasonic and UV exposure. (d) The practical application of Ag2O/T-ZnO nanostructures as piezo-photocatalyst (co-using mechanical and UV light). | ||
Fig. 2a and b are SEM images of Ag2O/T-ZnO nanostructures with different magnifications. The nanostructures consist of four needle-shaped legs, forming a tetrapod structure. The average length of the legs is ∼4 μm, and the average diameter is ∼200 nm. It can be observed that some legs fall off from the tetrapod nanostructures. The whole surfaces of all T-ZnO nanostructures are uniformly loaded with Ag2O nanoparticles. Fig. 2c is a high-magnification SEM image of one single leg of Ag2O/T-ZnO nanostructures, further confirming that the whole surface of T-ZnO nanostructures is uniformly covered with Ag2O nanoparticles. Fig. 2d is TEM image of one single Ag2O/T-ZnO nanostructure, showing the microstructure. Fig. 2e is high-resolution TEM (HRTEM) image of one leg of Ag2O/T-ZnO nanostructures. The Ag2O nanoparticle layer is about 5 nm, and uniformly distributed on the surface of ZnO nanostructures. Fig. 2f is high-resolution TEM (HRTEM) image of Ag2O/T-ZnO interface. The lattice spacing of 0.52 nm is consistent with (002) crystal plane of wurtzite structural ZnO, indicating that the leg of T-ZnO nanostructures grows along c-axis. The lattice spacing of 0.236 nm corresponds to (001) crystal plane of Ag2O.
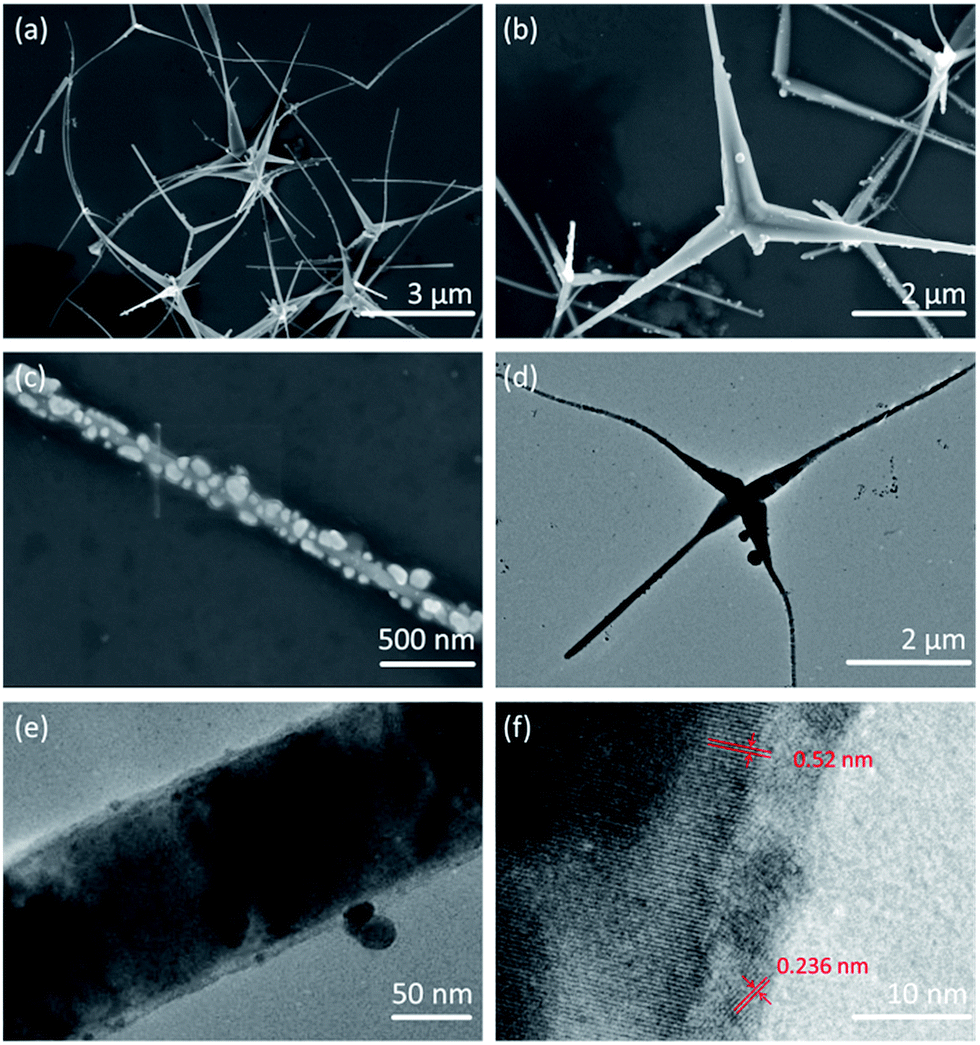 | ||
| Fig. 2 (a) and (b) SEM images of Ag2O/T-ZnO nanostructures with different magnifications. (c) SEM image of one single leg of Ag2O/T-ZnO nanostructures. (d) TEM image of one single Ag2O/T-ZnO nanostructure. (e) HRTEM image of one single leg of Ag2O/T-ZnO nanostructure. (f) HRTEM image of Ag2O/T-ZnO interface. | ||
Fig. 3a shows XRD patterns of Ag2O, ZnO and Ag2O/T-ZnO nanostructures. The diffraction peaks around 32.9°, 38.1°, 55.0° and 65.6° can be indexed to (111), (200), (220) and (311) of Ag2O (JCPDS 75-1532), respectively. The diffraction peaks around 31.7°, 34.4°, 36.2°, 47.5°, 56.5°, 62.8°, 66.3°, 67.9°, 69.0°, 72.5° and 76.9° can be indexed to (100), (002), (101), (102), (110), (103), (200), (112), (201), (004) and (202) of ZnO (JCPDS 76-0704), respectively. No diffraction peaks of other impurities can be observed, suggesting high crystalline purity of Ag2O/T-ZnO nanostructures. Fig. 3b is energy dispersive X-ray spectra (EDS) spectrum of Ag2O/T-ZnO nanostructures. The elements O, Zn and Ag can be observed in the sample, and Si element arises from Si wafer. Similar results can be obtained from any region of the sample, confirming the uniform distribution of Ag2O nanoparticles on the surface of T-ZnO nanostructures.
 | ||
| Fig. 3 (a) XRD patterns of Ag2O, ZnO and Ag2O/T-ZnO nanostructures. (b) EDS spectrum of Ag2O/T-ZnO nanostructures. | ||
The electronic state and the chemical composition of Ag2O/T-ZnO nanostructures can be further provided by XPS measurements. The wide scan XPS spectrum of Ag2O/T-ZnO nanostructures (Fig. 4a) clearly indicate that the sample is composed of Zn, C, Ag and O, and no peaks of other elements can be observed. The high-resolution XPS spectra of Zn 2p, C 1s, Ag 3d and O 1s are shown in Fig. 4b–e, respectively. The weak peak of C 1s (284.8 eV) comes from CO2 adsorbed on the surface of the sample and adventitious hydrocarbon from the XPS instrument itself. As shown in Fig. 4, the two strong peaks at 1023.7 and 1044.8 eV are assigned to the binding energies of Zn 2p3/2 and Zn 2p1/2, respectively, suggesting the existence of Zn2+. The peak of 531.5 eV is ascribed to O 1s. The binding energies of Ag 3d3/2 and Ag 3d5/2 are observed at 367.2 and 373.6 eV, respectively.26,28
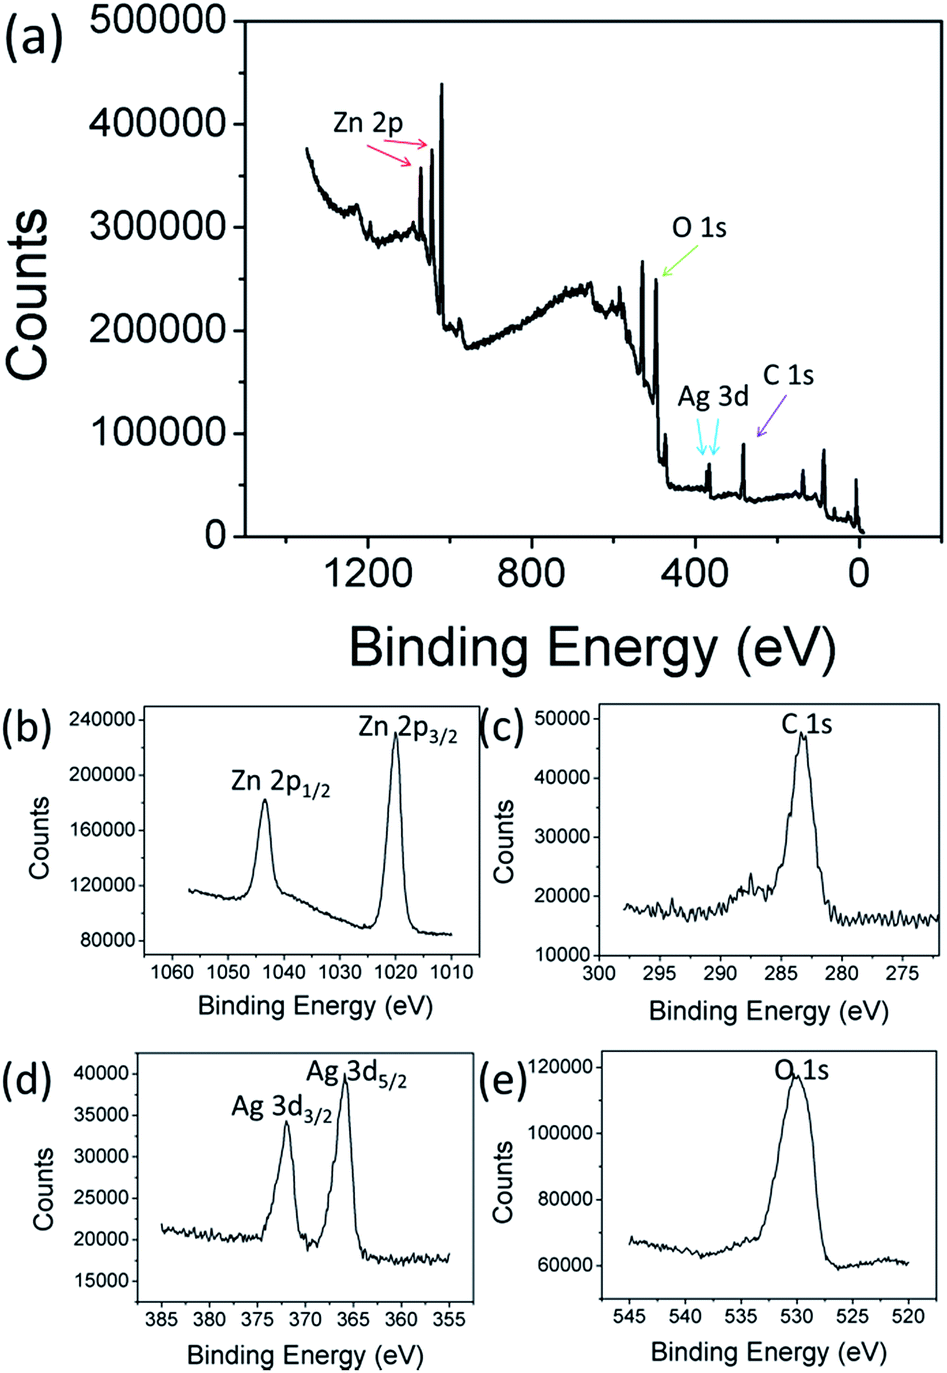 | ||
| Fig. 4 XPS patterns of Ag2O/T-ZnO nanostructures. (a) XPS survey spectrum; (b) Zn 2p region XPS spectrum; (c) C 1s region XPS spectrum; (d) Ag 3d region XPS spectrum; (e) O 1s region XPS spectrum of Ag2O/T-ZnO nanostructures. | ||
UV-vis diffuse reflectance spectra (UV-vis DRS) of Ag2O nanoparticles, T-ZnO nanostructures and Ag2O/T-ZnO nanocomposites are shown in Fig. 5a. T-ZnO nanostructures exhibit a steep absorption edge located at 380 nm. Ag2O nanoparticles display strong capability of light absorption in both UV and visible light range of 200–650 nm.23,26 The UV-vis spectrum of Ag2O/T-ZnO nanostructures exhibits wide UV light absorption band around 200–400 nm and visible light absorption, showing that Ag2O/T-ZnO nanostructures have a strong absorption in both the UV and visible light region. To find the optical band gap of the sample, we have studied the variation of (αhν)2 versus hν for direct band gap, as shown in Fig. 5b. The band gap values of Ag2O nanoparticles, T-ZnO nanostructures and Ag2O/T-ZnO nanostructures are calculated to be about 1.43, 3.37 and 3.28 eV, respectively.
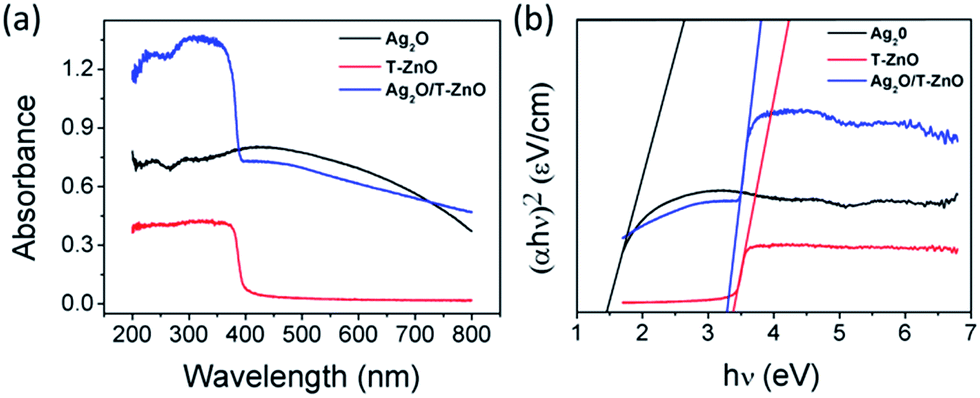 | ||
| Fig. 5 (a) UV-vis DRS of Ag2O nanoparticles, T-ZnO nanostructures and Ag2O/T-ZnO nanostructures. (b) Direct band gap model of Ag2O nanoparticles, T-ZnO nanostructures and Ag2O/T-ZnO nanostructures. | ||
Fig. 6 shows that ultrafast degradation of organic dyes in aqueous solution has been realized by the piezo-photocatalytic activity of Ag2O/T-ZnO nanostructures under ultrasonic/UV exposure. Fig. 6a–d are UV-vis absorption spectra of methylene blue (MB), rhodamine B (Rh B), rhodamine 6G (Rh 6G) and methyl orange (MO) aqueous solutions upon piezo-photodegradation process, respectively. In these tests, 200 mg of Ag2O/T-ZnO nanostructures are added in 100 mL aqueous solutions (the concentration of the organic dye is 5 mg L−1). The UV light power is 50 W, and the ultrasonic power is 200 W. The insets are the corresponding optical images of the dye samples during the degradation process. The degradation profiles are inserted below. The degradation is defined as C/C0 (C is test concentration, C0 is initial concentration). As shown in Fig. 6a, more than 99% of MB is degraded within 120 s by the piezo-photocatalytic activity of Ag2O/T-ZnO nanostructures under UV and ultrasonic exposure. For Rh B, Rh 6G and MO, the degradation time is about 180 s (99%), 150 s (97%) and 240 s (92.3%), respectively. These results indicate that Ag2O/T-ZnO nanostructures can rapidly degrade various organic pollutions. Compared with previous reports, the piezo-photocatalytic efficiency of Ag2O/T-ZnO nanostructures is very high, as shown in Table 1. For practical applications, Ag2O/T-ZnO nanostructures can probably co-use the mechanical and UV energy (∼4% of solar energy) in the nature and rapidly degrade organic pollutions in sewage.
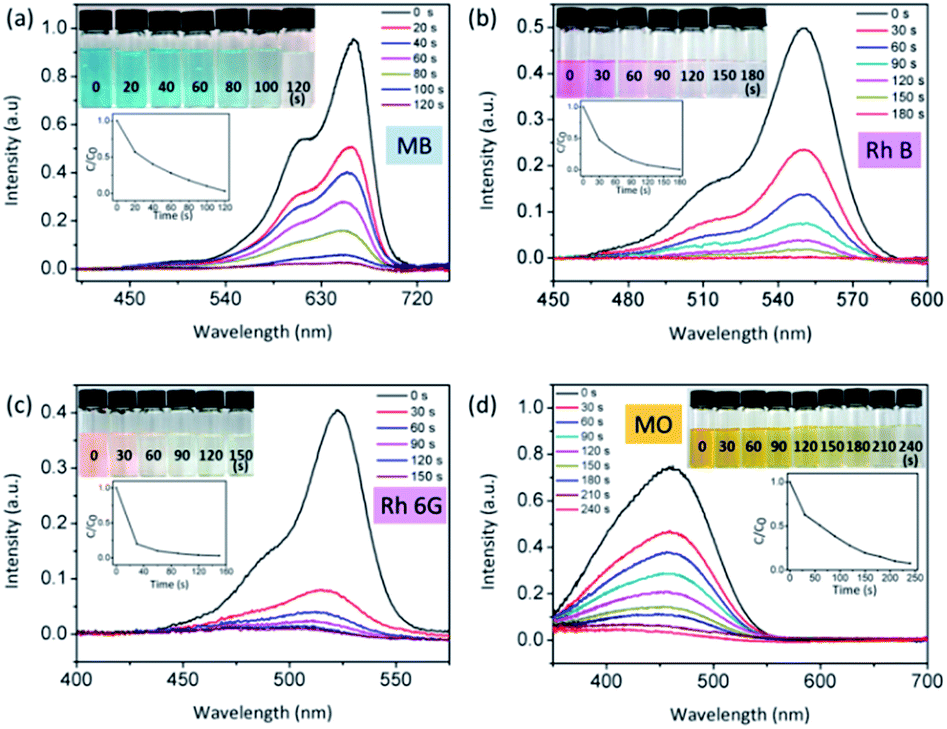 | ||
| Fig. 6 UV-vis absorption spectra of different organic-dye aqueous solution upon piezo-photodegradation catalyzed by Ag2O/T-ZnO nanostructures under both ultrasonic and UV exposure. (a) MB, (b) Rh B, (c) Rh 6G, and (d) MO. The insets are the corresponding optical images of the dye samples during the degradation process. The degradation profiles are inserted. | ||
| Catalyst (mg) | Dyes (mg) | Time | Degradation percentage | Irradiation condition | Ref. |
|---|---|---|---|---|---|
| ZnO (200) | MB (0.5) | 120 min | 98% | UV | 19 |
| Ag–TiO2 (200) | MV (19) | 4 min | 95% | UV | 5 |
| Pt–S6+–TiO2 (100) | AO7 (20) | 30 min | 97% | UV | 5 |
| Mn+/ZnO | MB | 90 min | 97% | 500 W visible | 32 |
| Au–ZnO (27) | MB (0.075) | 60 min | 95% | 300 W visible | 33 |
| Ag–ZnO (24) | MB (0.8) | 60 min | 63% | 8 W UV | 34 |
| ZnO flower (80) | MB (1) | 180 min | 73% | 6 W UV | 35 |
| ZnO (30) | AY23 (0.3) | 60 min | 92.98% | 30 W UV | 36 |
| ZnO–CNFs | RB | 50 min | 96% | 50 W UV | 37 |
| NiO/ZnO | RB | 50 min | 99.7% | UV | 38 |
| ZnO (30) | AR1 8 (0.4) | 120 min | 99.4% | 8 W UV | 39 |
| Ag2O/T-ZnO (200) | MB (0.5) | 2 min | 99% | 50 W UV, 200 W ultrasonic | This work |
To investigate the roles of ultrasonic and UV exposures in the piezo-photocatalytic process, the degradations of MB by bare T-ZnO and Ag2O/T-ZnO nanostructures under different exposure conditions (ultrasonic only, UV only, and ultrasonic + UV) are tested, as shown in Fig. 7a–c. No self-degradation of MB can be detected, suggesting that the degradation of MB arises from the catalytic effect. Under only ultrasonic exposure (Fig. 7a), no degradation of MB can be detected for bare T-ZnO and Ag2O/T-ZnO nanostructures.
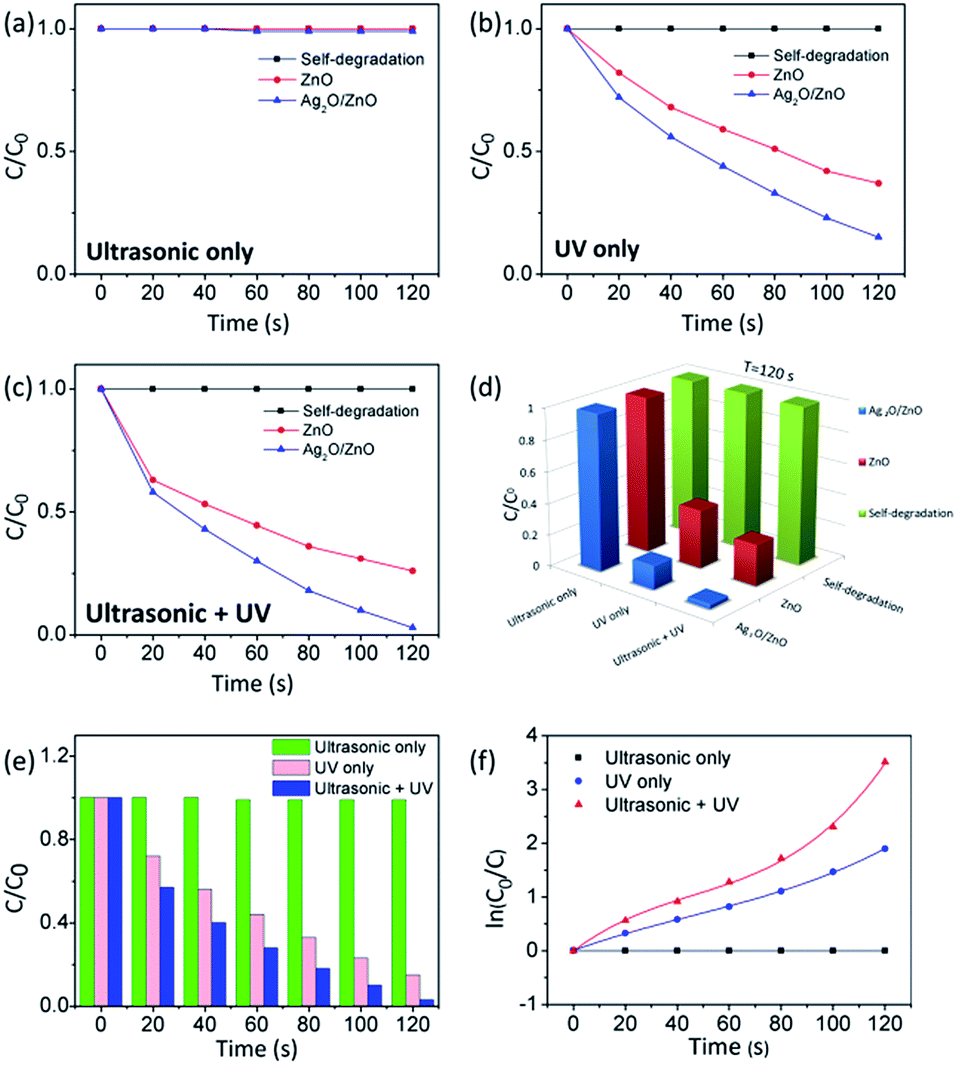 | ||
| Fig. 7 (a–c) Degradation of MB by bare T-ZnO and Ag2O/T-ZnO nanostructures under different exposure conditions (ultrasonic only, UV only, and ultrasonic + UV). (d) Degradation of MB at 120 s by bare T-ZnO and Ag2O/T-ZnO nanostructures under different exposure conditions. (e) and (f) Degradation profiles and kinetic curves of MB catalyzed by Ag2O/T-ZnO nanostructures under different exposure conditions. | ||
Although piezoelectric field can be created along T-ZnO nanostructures due to the water pressure, the extra carriers cannot be generated and the surface reactions for degrading MB cannot take place. The piezoelectric field plays an assistant role in the piezo-photocatalytic process. Under only UV exposure (Fig. 7b), the degradation percentage of MB at 120 s by bare T-ZnO and Ag2O/T-ZnO nanostructures is 63% and 85%, respectively. UV can generate extra carriers by exciting electrons in ZnO from valence band to conduction band, and leaving an equal number of holes in valence band. The photogenerated electrons and holes can participate in the surface reactions for degrading MB. The build-in electric field at Ag2O/T-ZnO heterojunctions can separate the photogenerated electrons/holes, lowering down the recombination rate and enhancing the photocatalytic efficiency. Additionally, the utility rate of UV can also be enhanced by the Ag2O nanoparticles due to their high photoelectrochemical properties. Under both ultrasonic and UV exposure (Fig. 7c), the degradation percentage of MB at 120 s by bare T-ZnO and Ag2O/T-ZnO nanostructures is 74% and 99%, respectively. The ultrasonic exposure can greatly enhance photocatalytic efficiency. The piezoelectric field inside the nanostructures can further separate the photogenerated carriers, acing an assistant role in the piezo-photocatalytic process.
As shown in Fig. 7d, the piezo-photocatalytic activity of Ag2O/T-ZnO nanostructures is the highest among different photocatalysts and under different exposure conditions. Fig. 7e shows the degradation profiles of MB at 120 s by Ag2O/T-ZnO nanostructures under different exposure conditions. Fig. 7f shows the kinetic curves of MB at 120 s by Ag2O/T-ZnO nanostructures under different exposure conditions. Under only UV exposure, the linearity of the curve of Ag2O/T-ZnO nanostructures is similar to previous reports of various photocatalysts, indicating the photocatalytic process follows a pseudo first order rate. Under both ultrasonic and UV exposure, non-linear curve of Ag2O/T-ZnO nanostructures can be observed, and the slope increases with time. The piezoelectric field can enhance the photocatalytic efficiency of Ag2O/T-ZnO nanostructures with time.
To investigate the optimal proportion between Ag2O and ZnO, the degradation of MB by Ag2O/T-ZnO nanostructures with different proportion (the weight percentages of Ag2O in Ag2O/T-ZnO are 0%, 1%, 3%, 5% and 10%, respectively) has been measured, as shown in Fig. 8. In this measurement, the UV power keeps at 50 W and ultrasonic power keeps at 200 W. After UV and ultrasonic irradiation (120 s), the degradations of MB catalyzed by Ag2O/T-ZnO with Ag2O weight percentage of 0%, 1%, 3%, 5% and 10% are 75.3%, 85%, 97%, 94.2% and 93%, respectively. It can be observed that the piezo-photocatalytic activity can be influenced by Ag2O weight percentage, and the optimal weight proportion of Ag2O is 3%.
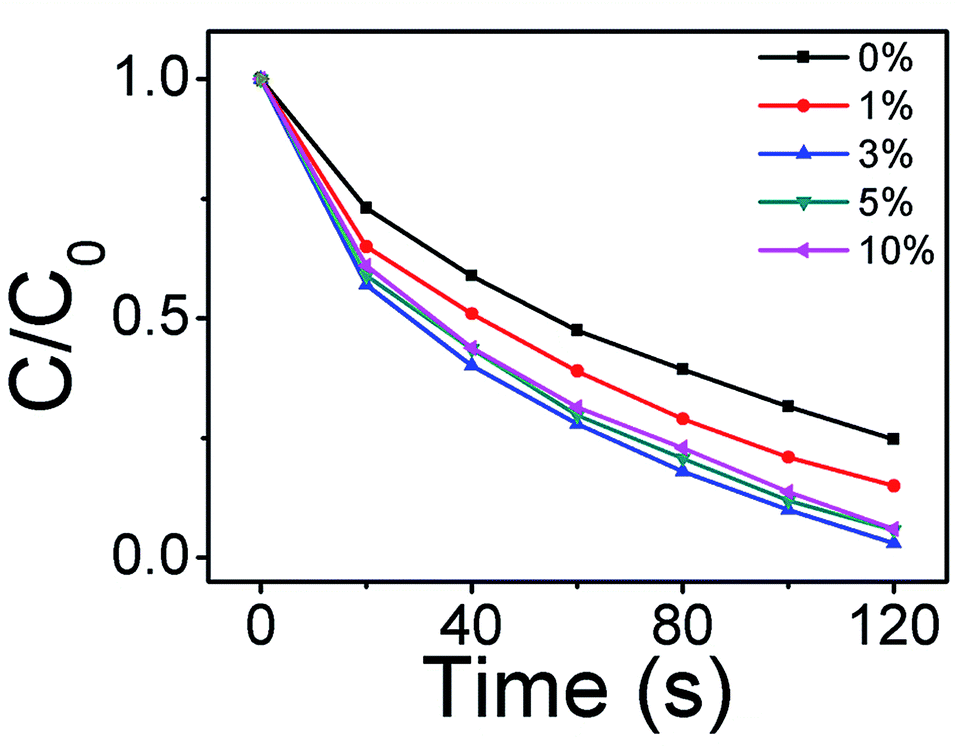 | ||
| Fig. 8 Degradation of MB by Ag2O/T-ZnO nanostructures with different proportions (0%, 1%, 3%, 5% and 10%). | ||
Fig. 9a shows the degradation profiles of MB solution by Ag2O/T-ZnO nanostructures under different ultrasonic irradiation powers (0, 100, 150 and 200 W). In this test, the UV power keeps at 50 W. It can be observed that the piezo-photocatalytic activity increases with increasing power of ultrasonic irradiation. Higher ultrasonic power can apply larger deformation on Ag2O/T-ZnO nanostructures and generating stronger piezoelectric field. This result further confirms that the piezoelectric field plays a significant assistant role in the piezo-photocatalytic process of Ag2O/T-ZnO nanostructures.40,41
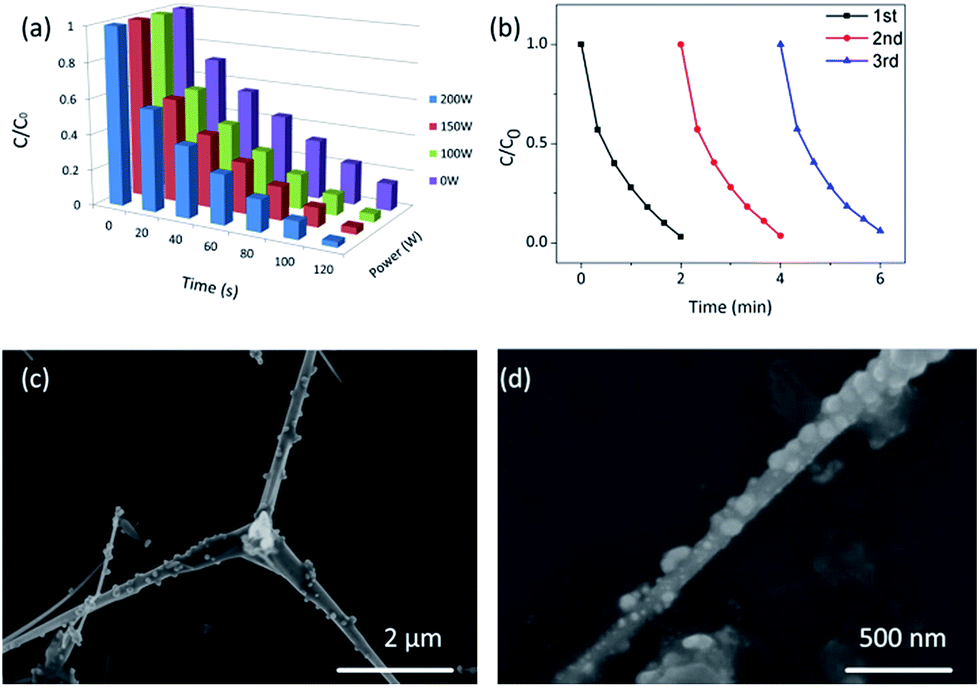 | ||
| Fig. 9 (a) Degradation profiles of MB by Ag2O/T-ZnO nanostructures under different ultrasonic irradiation powers (0, 100, 150 and 200 W). The UV power keeps at 50 W. (b) The reproducibility of the piezo-photocatalytic activity of Ag2O/T-ZnO nanostructures for degrading MB solution. The ultrasonic power is 200 W, and the UV power is 50 W. (c) SEM images of Ag2O/T-ZnO nanostructures after 3 cycles. (d) SEM image of one single leg of Ag2O/T-ZnO nanostructures after 3 cycles. | ||
The reproducibility is an important parameter for photocatalyst in practical application. Fig. 9b shows the reproducibility of the piezo-photocatalytic activity of Ag2O/T-ZnO nanostructures for degrading MB (the ultrasonic power is 200 W, and the UV power is 50 W). After each cycle, Ag2O/T-ZnO nanostructures are collected by the centrifugation. In the three cycles, the degradations of MB by Ag2O/T-ZnO nanostructures are about 99%, 97% and 94%, respectively, demonstrating a high reproducibility of Ag2O/T-ZnO nanostructures.
Fig. 9c and d are SEM images of Ag2O/T-ZnO nanostructures with different magnifications after 3 cycles. It can be observed that the samples retaining the primary nanostructures. This result demonstrates Ag2O/T-ZnO nanostructures have a good reusability as the photocatalyst.
It is known that under intensive ultrasound irradiation, water generates extremely active bubbles, which subsequently collapse and cause high local pressure (>100 MPa).40,41 As the material system is under ultrasonic irradiation (Fig. 1c), a pressure of water exerting can lead to the bending of T-ZnO legs. A piezoelectric field can be created crossing the legs of T-ZnO with negative piezo-potential on the compressive strain region and positive piezo-potential on the tensile strain region. As a comparison, degradation of MB by TiO2 (none piezoelectric properties) nanoparticles with different conditions (UV only and ultrasonic + UV) has been measured, as shown in Fig. 10. It can be observed that there is almost no difference between two conditions. Compared with this, the piezoelectric can significantly enhanced the photocatalytic performance of Ag2O/T-ZnO nanostructures. These results indicate that the piezoelectric fields are indeed acting in phase. The Ag2O/T-ZnO nanostructures are self-reliant, and each leg generates piezoelectric fields is independent with the others, so the piezoelectric field generated in a moment cannot cancel each other out.42,43
 | ||
| Fig. 10 Degradation of MB by TiO2 nanoparticles with different conditions (UV only and ultrasonic + UV). | ||
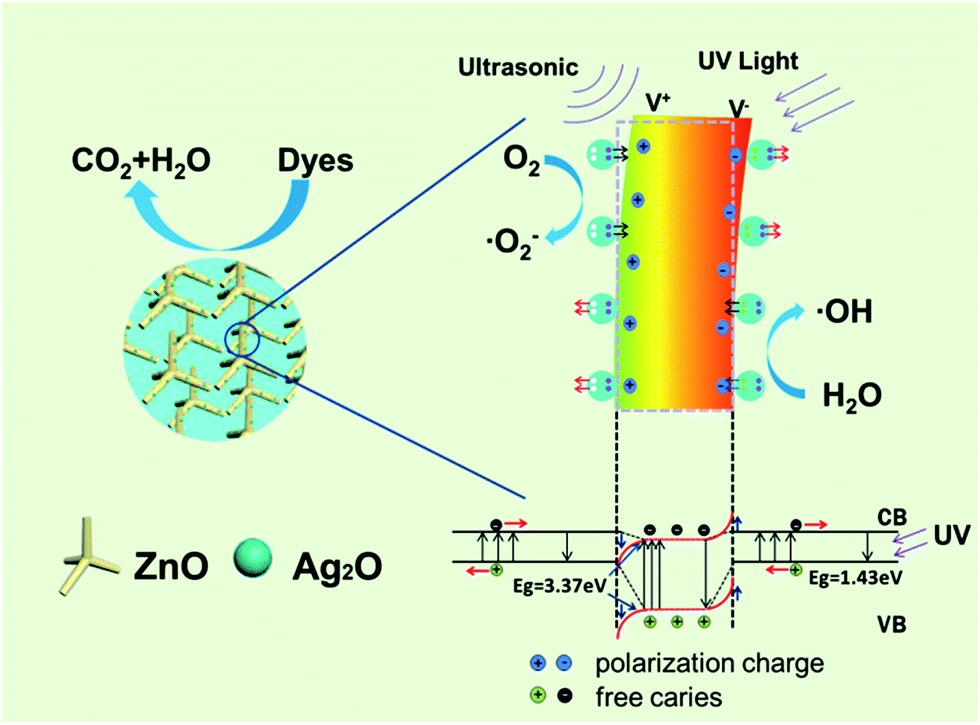
The working mechanism for piezo-photocatalytic process of Ag2O/T-ZnO nanostructures under ultrasonic and UV exposure is schematically illustrated in Fig. 11.44 The piezoelectric field of ZnO and the build-in electric field of Ag2O/T-ZnO heterojunction are coupled together in the photocatalytic process. The energy band diagram of Ag2O/T-ZnO nanostructure under ultrasonic and UV exposure is inserted below. Ag2O is p-type semiconductor with the band gap and work function of 1.43 eV and 4.8 eV.22,28 ZnO is n-type semiconductor with the band gap and work function of 3.37 eV and 5.30 eV. Thus p–n junction can be formed at the Ag2O/ZnO interface, establishing a depletion layer at the boundary region. The direction of build-in electric field in the depletion layer is from ZnO to Ag2O. When the UV light is on, UV irradiation on ZnO and Ag2O can induce a transition of electrons from valence band to conduction band, leaving an equal number of holes in valence band. The build-in electric field can separate the photogenerated electrons and holes through driving them migrating on opposite directions, lowering down the recombination rate and enhancing the photocatalytic efficiency.45–47 It should be noted that Ag2O has high photoelectrochemical properties and can enhance the UV utility rate, further enhancing the photocatalytic efficiency. As Ag2O/T-ZnO nanostructures are under ultrasonic exposure, water pressure can apply bending deformation on the nanostructures. The strain on c-axis of ZnO nanostructures can generate positive piezoelectric charges at the tensile region and negative piezoelectric charges at the compressive region. The piezoelectric field can be created across Ag2O/T-ZnO nanostructures. This piezoelectric field can further separate the photogenerated electrons/holes and lower down the recombination rate, enhancing the photocatalytic efficiency of Ag2O/T-ZnO nanostructures. Such a band tilting is also illustrated in Fig. 11 (marked with red color). Under the driving of the piezoelectric field and build-in electric field, the photogenerated electrons and holes can move to the surface of Ag2O/T-ZnO nanostructures. The electrons can react with oxygen molecules to yield superoxide radical anions, and then transform to ·OH radicals. The holes can react with hydroxyl, forming ·OH radicals. Organic dyes can be oxidized by ·OH radicals and form harmless CO2 and H2O.48–51 The physical–chemical reactions of piezo-photocatalytic process are as follows:
| Ag2O/T-ZnO + hν → Ag2O(h+) + Zn(e−) | (1) |
| h+ + OH− → ·OH | (2) |
| e− + O2 → ·O2− | (3) |
| 2·O2− + 2H+ → 2HO2 → H2O2 + O2 | (4) |
| H2O2 + ·O2− → ·OH + OH− + O2 | (5) |
| ·OH + MB → CO2 + H2O | (6) |
 | ||
| Fig. 11 Schematic illustration showing the working mechanism for the piezo-photocatalytic process of Ag2O/T-ZnO nanostructures under ultrasonic and UV exposure. | ||
Experimental
All Chemical reagents (supplied by Sinopharm Chemical Reagent Co. Ltd.) were of analytic grade, and directly used without further purification.Ag2O/T-ZnO nanostructures were synthesized in mass production by a two-step method.52 Firstly, T-ZnO nanostructures were prepared via a thermal evaporation route. 5 g of pure zinc powders were placed in a quartz boat and then placed in a horizontal tube furnace (960 °C). After kept for 1 min, the white flocculent T-ZnO nanostructures were collected. Secondly, Ag2O nanoparticles were loaded on the surface of T-ZnO nanostructures via a wet-chemical route. 200 mg of T-ZnO nanostructures were added into 50 mL of AgNO3 aqueous solution (0.1 mol L−1), and stirred for 30 min at room temperature. 15 mL of NaOH solution (0.1 mol L−1) was added into the solution and stirred for 30 min. The precipitate were collected, washed with water/alcohol, and dried at 60 °C for 2 h. Finally, the products were annealed at 300 °C for 2 h in air ambience to form Ag2O/T-ZnO nanostructures.53
Methylene blue (MB), rhodamine B (Rh B), rhodamine 6G (Rh 6G) and methyl orange (MO) were used to assess the piezo-photocatalytic activity of Ag2O/T-ZnO nanostructures. Taking MB as an example, 200 mg of Ag2O/T-ZnO nanostructures were added into 100 mL MB aqueous solution (5 mg L−1). Before irradiation, the suspension was kept in dark for 30 min to reach adsorption–desorption equilibrium on the surface of the nanostructures. A UV lamp was used as the UV illumination source, and an ultrasonic probe was placed into the suspensions for providing mechanical vibration. During the degradation process, 2 mL of sample solution was periodically taken out, and analyzed by a UV-vis spectrometer (Hitachi U-3010). The characteristic absorption peaks of MB, Rh B, Rh 6G and MO were centered at 560, 550, 520 and 450 nm, respectively.
X-ray diffraction (XRD, D/max 2550 V, CuKα radiation) was used to characterize the crystal phase of Ag2O/T-ZnO nanostructure. Scanning electron microscope (SEM, JEOL JSM-6700F) and transmission electron microscope (TEM, JEOL JEM-2010) were used to determine their morphologies and microstructures. UV-vis diffuse reflectance spectra were measured at room temperature in the 200–800 nm wavelength range using an UV-vis-NIR spectrometer. The surface elements and their electronic states of the sample were analyzed using X-ray photoelectron spectroscopy (XPS). UV-vis diffuse reflectance spectra (DRS) of the samples were recorded on a UV-vis spectrophotometer (UV-2550, Shimadzu) with an integrating sphere attachment. The analyzed range was 200–800 nm, and BaSO4 was used as a reflectance standard.
Conclusions
In summary, ultrafast degradation of organic pollutions has been realized by the piezo-photocatalytic activity of Ag2O/T-ZnO nanostructures under ultrasonic/UV exposure. The composite nanostructures are synthesized in mass production by a two-step method. The composite nanostructures can efficiently co-use the mechanical and UV energy to degrade organic pollutions, and the degradation speed is extraordinarily fast. The degradation time of MB aqueous solution is merely ∼2 min. The piezoelectric field of T-ZnO nanostructures and the build-in electric field of Ag2O/T-ZnO heterojunctions are coupled together in the photocatalytic process, which can separate the photogenerated electron–hole pairs, lowering down the recombination rate and enhancing the photocatalytic activity. Such a new sewage treating technique could have potential applications for the environment improvement in the future.Acknowledgements
This work was supported by the National Natural Science Foundation of China (11674048), the Fundamental Research Funds for the Central Universities (N150505001 and N140505004), Liaoning Natural Science Foundation (2015021009) and Program for New Century Excellent Talents in University (NCET-13-0112).Notes and references
- X. Chen, L. Liu, P. Y. Yu and S. S. Mao, Science, 2011, 331, 746–750 CrossRef CAS PubMed
.
- U. I. Gaya and A. H. Abdullah, J. Photochem. Photobiol., C, 2008, 9, 1–12 CrossRef CAS
- A. Kubacka, M. Fernandez-Garcia and G. Colon, Chem. Rev., 2012, 112, 1555–1614 CrossRef CAS PubMed
- M. D. Hernandez-Alonso, F. Fresno, S. Suarez and J. M. Coronado, Energy Environ. Sci., 2009, 2, 1231–1257 CAS
- F. Han, V. S. R. Kambala, M. Srinivasan, D. Rajarathnam and R. Naidu, Appl. Catal., A, 2009, 359, 25–40 CrossRef CAS
- P. V. Kamat, J. Phys. Chem. C, 2007, 111, 2834–2860 CAS
- H. Tong, S. Ouyang, Y. Bi, N. Umezawa, M. Oshikiri and J. Ye, Adv. Mater., 2012, 24, 229–251 CrossRef CAS PubMed
- T. P. Yoon, M. A. Ischay and J. Du, Nat. Chem., 2010, 2, 527–532 CrossRef CAS PubMed
- M. Pelaez, N. T. Nolan, S. C. Pillai, M. K. Seery, P. Falaras, A. G. Kontos, P. S. M. Dunlop, J. W. J. Hamilton, J. A. Byrne, K. O'Shea, M. H. Entezari and D. D. Dionysiou, Appl. Catal., B, 2012, 125, 331–349 CrossRef CAS
- M. A. Lazar and W. A. Daoud, RSC Adv., 2013, 3, 4130–4140 RSC
- V. J. Babu, RSC Adv., 2014, 4, 27979–27987 RSC
- S. Chakrabarti and B. K. Dutta, J. Hazard. Mater., 2004, 112, 269–278 CrossRef CAS PubMed
- H. Zeng, W. Cai, P. Liu, X. Xu, H. Zhou, C. Klingshirn and H. Kalt, ACS Nano, 2008, 2, 1661–1670 CrossRef CAS PubMed
- O. Akhavan, ACS Nano, 2010, 4, 4174–4180 CrossRef CAS PubMed
- S. Sakthivel, B. Neppolian, M. V. Shankar, B. Arabindoo, M. Palanichamy and V. Murugesan, Sol. Energy Mater. Sol. Cells, 2003, 77, 65–82 CrossRef CAS
- S. G. Kumar, RSC Adv., 2015, 5, 3306–3351 RSC
- Y. Fang, B. Zhang, L. Hong, D. Yao, Z. Xie and Y. Jiang, Nanotechnology, 2015, 26, 295204 CrossRef PubMed
- J. Lu, RSC Adv., 2012, 3, 720–724 RSC
- X. Y. Xue, W. Zang, P. Deng, Q. Wang, L. Xing, Y. Zhang and Z. L. Wang, Nano Energy, 2015, 13, 414–422 CrossRef CAS
- S. Zheng, Y. Cai and K. E. O'Shea, J. Photochem. Photobiol., A, 2010, 210, 61–68 CrossRef CAS PubMed
- X. Wang, G. Liu, Z.-G. Chen, F. Li, L. Wang, G. Q. Lu and H.-M. Cheng, Chem. Commun., 2009, 3452–3454 RSC
- Z. Zhang, C. Shao, X. Li, C. Wang, M. Zhang and Y. Liu, ACS Appl. Mater. Interfaces, 2010, 2, 2915–2923 CAS
- W. Zhou, H. Liu, J. Wang, D. Liu, G. Du and J. Cui, ACS Appl. Mater. Interfaces, 2010, 2, 2385–2392 CAS
- H. Li, Y. Sang, S. Chang, X. Huang, Y. Zhang, R. Yang, H. Jiang, H. Liu and Z. L. Wang, Nano Lett., 2015, 15, 2372–2379 CrossRef CAS PubMed
- D. Sarkar, C. K. Ghosh, S. Mukherjee and K. K. Chattopadhyay, ACS Appl. Mater. Interfaces, 2013, 5, 331–337 CAS
- C. Yu, G. Li, S. Kumar, K. Yang and R. Jin, Adv. Mater., 2014, 26, 892–898 CrossRef CAS PubMed
- K. Lalitha, J. K. Reddy, M. V. P. Sharma, V. D. Kumari and M. Subrahmanyam, Int. J. Hydrogen Energy, 2010, 35, 3991–4001 CrossRef CAS
- H. Yu, R. Liu, X. Wang, P. Wang and J. Yu, Appl. Catal., B, 2012, 111, 326–333 CrossRef
- M. Wu, J. M. Yan, X. W. Zhang, M. Zhao and Q. Jiang, J. Mater. Chem. A, 2015, 3, 15710–15714 CAS
- W. Yu, X. J. Liu, H. P. Chu, G. Zhu, J. L. Li, J. Y. Liu, L. Y. Niu, Z. Sun and L. K. Pan, J. Mol. Catal. A: Chem., 2015, 407, 25–31 CrossRef CAS
- M. Wu, J. M. Yan, M. Zhao and Q. Jiang, ChemPlusChem, 2012, 77, 931–935 CrossRef CAS
- M. Ahmad, E. Ahmed, W. Ahmed, A. Elhissi, Z. L. Hong and N. R. Khalid, Ceram. Int., 2014, 40, 100087–110095 Search PubMed
- A. Senthilraja, B. Subash, B. Krishnakumar, D. Rajamanickam, M. Swaminathan and M. Shanthi, Mater. Sci. Semicond. Process., 2014, 22, 83–91 CrossRef CAS
- M. J. Height, S. E. Pratsinis, O. Mekasuwandumrong and P. Praserthdam, Appl. Catal., B, 2006, 63, 305–312 CrossRef CAS
- L. Sun, R. Shao, Z. Chen, L. Tang, Y. Dai and J. Ding, Appl. Surf. Sci., 2012, 258, 5455–5461 CrossRef CAS
- M. A. Behnajady, N. Modirshahla and R. Hamzavi, J. Hazard. Mater., 2006, 133, 226–232 CrossRef CAS PubMed
- S. Fu, J. Zhang, L. Shen and H. Tao, Nano, 2014, 09, 565–568 Search PubMed
- C. Tie-Ping, L. Yue-Jun and W. Chang-Hua, J. Inorg. Mater., 2013, 28, 295–300 CrossRef
- N. Sobana and M. Swaminathan, Sep. Purif. Technol., 2007, 56, 101–107 CrossRef CAS
- Y. Qin, X. D. Wang and Z. L. Wang, Nature, 2008, 451, 809–U805 CrossRef CAS PubMed
- Z. L. Wang, Adv. Funct. Mater., 2008, 18, 3553–3567 CrossRef CAS
- H. D. Li, Y. H. Sang, S. J. Chang, X. Huang, Y. Zhang, R. S. Yang, H. D. Jiang, H. Liu and Z. L. Wang, Nano Lett., 2015, 15, 2372–2379 CrossRef CAS PubMed
- E. B. Flint and K. S. Suslick, Science, 1991, 253, 1397–1399 CrossRef CAS PubMed
- W. Yi, C. Yan, P. Yan and F. Li, J. Sol-Gel Sci. Technol., 2014, 69, 386–396 CrossRef CAS
- Z. L. Wang, Adv. Mater., 2007, 19, 889–892 CrossRef CAS
- J. Song, J. Zhou and Z. L. Wang, Nano Lett., 2006, 6, 1656–1662 CrossRef CAS PubMed
- Y. Gao and Z. L. Wang, Nano Lett., 2007, 7, 2499–2505 CrossRef CAS PubMed
- Z. Ji, X. Shen, J. Yang, Y. Xu, G. Zhu and K. Chen, Eur. J. Inorg. Chem., 2013, 6119–6125 CrossRef CAS
- Y. Wang, L. Liu, L. Xu, X. Cao, X. Li, Y. Huang, C. Meng, Z. Wang and W. Zhu, Nanoscale, 2014, 6, 6790–6797 RSC
- A. Houas, H. Lachheb, M. Ksibi, E. Elaloui, C. Guillard and J. M. Herrmann, Appl. Catal., B, 2001, 31, 145–157 CrossRef CAS
- H. Lachheb, E. Puzenat, A. Houas, M. Ksibi, E. Elaloui, C. Guillard and J. M. Herrmann, Appl. Catal., B, 2002, 39, 75–90 CrossRef CAS
- X. Wang, S. Li, H. Yu, J. Yu and S. Liu, Chem.–Eur. J., 2011, 17, 7777–7780 CrossRef CAS PubMed
- M. Xu, L. Han and S. Dong, ACS Appl. Mater. Interfaces, 2013, 5, 12533–12540 CAS
| This journal is © The Royal Society of Chemistry 2016 |