DOI:
10.1039/C6RA13457B
(Paper)
RSC Adv., 2016,
6, 94024-94032
Greenly synthesized graphene with L-glutathione-modified electrode and its application towards determination of rutin†
Received
24th May 2016
, Accepted 21st September 2016
First published on 22nd September 2016
Abstract
A simple, environmentally friendly and cost-effective approach for preparation of water-soluble functional graphene was proposed for constructing a voltammetric sensor platform. It was characterized by several techniques, including UV-vis spectroscopy, Fourier transform infrared spectroscopy, transmission electron microscopy (TEM) and X-ray diffraction (XRD). This voltammetric sensor showed strong accumulation ability and excellent voltammetric response for rutin. The electrochemical behavior of rutin was investigated systematically in 0.1 mol L−1 phosphate buffer solution (PBS 3.0). Under optimum conditions by square wave voltammetry (SWV), a good linear relationship was obtained between peak currents and rutin concentrations in the wider range of 5 × 10⁻⁹ to 1 × 10⁻⁶ mol L−1 with a detection limit of 7 × 10⁻¹⁰ mol L−1. In addition, the proposed rutin sensor was successfully applied to test in real samples with good results.
Introduction
Rutin (3′,4′,5,7-tetrahydroxyflavone-3β-D-rutinoside Fig. 1A) is a flavonol glycoside that is found in many plants, such as black tea and buckwheat tea.1,2 It is also known as vitamin P, and is used not only for reducing capillary fragility and improving microcirculation effects, but also for diabetes and as a hypertension adjuvant therapy in clinical practice.3,4 Rutin has many physiological functions, such as diluting the blood, reducing capillary permeability and lowering blood pressure.5 For the pharmacological action, some highly sensitive techniques have been reported for determination of rutin, such as HPLC,6,7 chemiluminescence8 and capillary electrophoresis.9 These techniques show high sensitivity, but require expensive instruments, complicated pre-treatment steps and skilled operators. Comparatively, electroanalytical methods have the advantages of high sensitivity, low cost, easy fabrication and the ability to simultaneously give some information about the pharmacology. Up to now, some voltammetric sensors have been applied for determination of rutin.10–16 Even so, it is valuable to develop a more simple, sensitive and applicable electroanalytical method for assaying rutin.
|
| Fig. 1 The chemical structure of rutin (A) and L-glutathione (B). | |
Graphene (GR) has been the research focus owing to its unique physiochemical properties and two-dimensional single-atom-thick carbon network.17 It has exhibited specific characteristics, including extremely electric conductivity, large specific surface area, good biocompatibility and upstanding thermal conductivity.18,19 Currently, various methods to prepare GR nanosheets have been developed, such as micromechanical exfoliation,20 chemical vapor deposition21 and chemical reduction of graphene oxide (GO).22 Chemical reduction of GO is an efficient approach owing to its special merits, such as low cost, high production and mild conditions. In this method, the common reductants used are sodium borohydride,23 hydriodic acid24 and hydrazine hydrate,25 which are highly toxic, dangerously unstable and harmful to health. To decrease the toxicity and danger from the reductant, a mild and green reducing agent L-glutathione (Fig. 1B GSH) was used to reduce GO.26 GSH is a natural antioxidant in the cells that participates directly in the neutralization of free radicals. The isoelectric point (pI) of GSH is equal to 5.93. When the outside solution pH is greater than the zwitterionic pI value, zwitterionic negatively charged protons are released. In the reduced state, each GSH is able to release a proton and a reduced equivalent reactive oxygen species.27 It is well known that GO contains mainly two types of reactive oxygen species (epoxy and alkoxy). Accordingly, GSH can remove oxygen functional groups on the surface of GO and obtain a water-dispersible GR suspension. The merits of this approach were that it was inexpensive and environmentally friendly, which opens new opportunities for using GR in a wide range of potential applications.
In this approach, a new simple and green method for preparation of GSH-functionalized GR (GSH–GR) was applied to the construction of a voltammetric sensor. This voltammetric sensor showed strong accumulation ability and excellent electrochemical response for rutin. More significantly, the electrode reaction mechanisms of rutin were studied and some kinetic parameters were also calculated. Therefore, this sensitive voltammetric sensor was applied to the determination of rutin in drug tablets and buckwheat tea samples with satisfactory results.
Experimental
Instruments and reagents
UV-vis spectra were obtained from a Lambda 35 UV-vis spectrometer (PerkinElmer, USA). Transmission electron microscopy (TEM) images were obtained on a JEM-2100 (Japan) with a 200 kV accelerating voltage. X-ray diffraction (XRD, Shimadzu) study was conducted by Cu Ka radiation source (λ = 1.54056 Å). High-performance liquid chromatography was performed using a 1260 Infinity Quaternary LC System (Agilent Technologies Inc., Santa Clara, USA). All electrochemical experiments were carried out using an RST3000 electrochemical workstation (Zhengzhou Shiruisi Instrument Technology Co. Ltd., China). A three-electrode system was employed, consisting of a GCE (3 mm diameter) or a GSH–GR/GCE as the working electrode, a platinum wire as the counter electrode (0.5 mm diameter) and a saturated calomel electrode (SCE) as the reference electrode. All the pH measurements were made with a PHS-3C precision pH meter (Leici Devices Factory of Shanghai, China), which was calibrated with a standard buffer solution at 25 ± 0.1 °C every day.
GSH (BR, 99%) and rutin (HPLC ≥ 98%) were purchased from Shanghai Yuanye Biological Technology Co., Ltd. (Shanghai, China). The stock solution of rutin (1 × 10⁻² mol L−1) was prepared with alcohol and stored below 4 °C. Phosphate buffer solution (PBS, 0.1 mol L−1) was prepared using a mixture of the stock solutions (0.1 mol L−1 NaH2PO4 and Na2HPO4). The lower pH value of PBS was adjusted with 0.1 mol L−1 H3PO4. Working solutions were prepared daily by diluting the stock solution of rutin in 0.1 mol L−1 PBS. All reagents were of analytical grade and all solutions used in this work were prepared with double distilled water. All experiments were performed at room temperature.
Preparation of GSH–GR nanocomposite
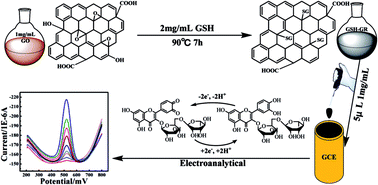
Graphene oxide (GO) was synthesized using the modified Hummers' method.28 The GO was functionalized with GSH by the following procedure: 50 mg of GO was dispersed in 50 mL of water by ultrasonication for 5 h to make a suspension. Then, 0.5 mL of 28% ammonia aqueous solution and 25 mL of GSH (2 mg mL−1) solution were added to the suspension, stirring for 30 min. Next, the mixture was stirred for 7 h at 90 °C. The product was washed with double distilled water three times and dried under vacuum at 60 °C overnight. The obtained black product was named as GSH functionalized GR (GSH–GR). The overall procedure for the preparation of the GSH–GR nanocomposite is schematically depicted in Fig. 2. By comparison, GR was prepared by reduction of GO with hydrazine.
|
| Fig. 2 Illustration of the functionalization and reduction of GO with GSH. | |
Preparation of modified electrode
GSH–GR was dispersed in double distilled water and sonicated for 5 h to obtain a uniformly black suspension (1.0 mg mL−1). Prior to modification, bare GCE was polished to a mirror-like surface with 0.3 and 0.05 μm alumina slurry in turn, sequentially sonicated in absolute alcohol and double distilled water. Next, the GSH–GR suspension-modified GCE was prepared by dropwise adding 5 μL of GSH–GR suspension on the fresh GCE surface and then drying under IR-lamp for 5 min (GSH–GR/GCE). For comparison, a GR-modified GCE was prepared in the same way, marked as GR/GCE.
Analytical procedure
The voltammetric behaviors of rutin were investigated by cyclic voltammetry (CV) in a standard three-electrode system. The prepared GSH–GR/GCE was immersed in 0.1 mol L−1 PBS (pH 3.0), which was firstly mixed with the appropriate concentrations of rutin stock solutions. The CVs were performed in the potential range between 0.1 V and 0.8 V with a scan rate of 100 mV s−1. The square wave voltammetry (SWV) technique was used to establish the analytical method and the current–potential curve was recorded in a potential window of between 0.1 V and 0.8 V. SWV was conducted with the following parameters: quiet time 3 s; square wave amplitude 0.025 V; square wave period 40 ms; and sample width 5 ms. After each measurement, the electrode was immersed in 0.1 mol L−1 PBS (pH 8.0) for two cyclic scans to obtain a fresh electrode surface.
Results and discussion
Characterization of GSH–GR nanocomposite
UV-vis spectroscopy was used to characterize the GSH–GR nanocomposite. Fig. 3A displays the UV-vis absorption spectra of GO (curve a), GSH–GR (curve b) and GR (curve c) suspensions. The GO suspension has a characteristic absorption band at 231 nm (curve a). Both the GSH–GR (curve b) and GR (curve c) aqueous dispersions exhibit a strong absorption peak at 268 nm.26 These data demonstrated that GO was successfully reduced as GR.
|
| Fig. 3 (A) UV-vis spectra of GO (a), GSH–GR (b) and GR (c). (B) FT-IR spectra of GO (a), GSH–GR (b) and GR (c). (C) The XRD patterns of GO (a), GSH–GR (b) and GR (c). (D) TEM images of GSH–GR. | |
The IR spectra of GO, GR and GSH–GR nanocomposite are shown in Fig. 3B. The spectrum of GO (curve a) displays a broad band at 3400 cm−1 corresponding to OH stretching vibrations. In addition, the absorption peaks at 1730 cm−1, 1620 cm−1, 1220 cm−1 and 1055 cm−1 were ascribed to the stretching vibrations of CO, CC, C–O–C and C–O in the GO molecule.29 In the spectrum of GSH–GR (curve b) and GR (curve c), the disappearance of characteristic peaks at 1730 cm−1, 1220 cm−1 and 1055 cm−1 confirmed the reduction of most oxygen functionalities of GO. The only remain peak at 1630 cm−1 relates to graphitic structure of GR nanosheets.27 In curve c, the characteristic absorption bands of the oxygen functional group (C–O, C–O–C) decreased dramatically, which indicated that GO had been reduced to GR. More importantly, new characteristic peaks at 939 cm−1, 1110 cm−1 and 1350 cm−1 are ascribed to the stretching vibrations of C–S, C–N and O–C–N,30 indicating that a certain amount of GSH was modified on the surface of GR.
Fig. 3C shows the XRD patterns of GO, GR and GSH–GR nanocomposite. The diffraction peak position for a typical (002) characteristic peak near 9.9° was observed on GO (curve a) and corresponding to interlayer spacing of 0.75 nm, indicating the presence of oxygen-containing functional groups formed during oxidation. Chemical treatment of GO with GSH implies the reduction of the functional groups with a concomitant contraction in the interlayer spacing as revealed by the movement of the characteristic peak to a higher angle (2θ = 25°), which corresponds to the (002) diffraction peak of GR (curve b) and to interlayer spacing of GR of 0.37 nm. In addition, the diffraction peak at 9.9° related to GO was not observed in the GSH–GR nanocomposite, demonstrating its successful conversion into GR in presence of the GSH. Compared with GR (curve c), there are no more differences between the curves of GR and GSH–GR. These results were consistent with the majority of reported values for this system.31–33
The as-obtained GR was further confirmed by TEM. The morphology of the prepared GSH–GR sample dispersed in water was obtained using TEM image (Fig. 3D). The large GR was obtained by GSH reduction. Moreover, the GR was very thin with some corrugations and scrolling on the surface, which was consistent with previous work.27
The electrochemical characters of GSH–GR/GCE
Generally, potassium hexacyanoferrate is employed as an electrochemical probe to mark the surface characters of sensors. Herein, the CV was performed in 1.0 × 10⁻³ mol L−1 Fe(CN)63−/4− containing 1.0 × 10⁻⁴ mol L−1 potassium chloride using different modified electrodes (Fig. S1†). At the bare GCE, a pair of reversible redox peaks was obtained with Ipa = −17.72 μA and Ipc = 19.90 μA (Fig. S1a†). The redox currents and background current were increased obviously at the GR/GCE (Fig. S1b†), which was attributed to the good conductivity and large surface area of GR modified membrane. Meanwhile, when the GSH–GR was modified on the GCE (Fig. S1c†), the background current increased further and the redox currents changed little compared with curve b, indicating the larger surface area of the GSH–GR-modified membrane and the electrostatic repulsion between negatively charged GSH and Fe(CN)63−/4−. This nature is disadvantageous for the redox of Fe(CN)63−/4−, but it can promote the voltammetric response of rutin.
The electroactive surface areas (A) of the bare GCE and GSH–GR/GCE were investigated by CV in 1.0 × 10⁻³ mol L−1 Fe(CN)63−/4− solution under different scan rates (ν: 0.03–0.27 V s−1) according to the Randles–Sevcik equation:34 Ip = 2.69 × 10⁵ A × D1/2n3/2ν1/2C. As shown in Fig. S2,† the anodic peak currents (Ipa) were proportional to the square root of the scan rate at both the bare GCE and the GSH–GR/GCE. Based on the slope of the Ipa–ν1/2 plots, n = 1 and D = 7.6 × 10⁻⁶ cm2 s−1,34 the electroactive surface areas of the bare GCE and the GSH–GR/GCE were calculated to be 0.0703 cm2 and 0.0992 cm2, respectively. The electroactive surface area of the GSH–GR/GCE increased about 41.04% compared with that of the bare GCE, which provided effective evidence for the superior conductivity of the GSH–GR/GCE as expected.
Electrochemical impedance spectroscopy (EIS) is an effective technique for exploring the interfacial properties of modified electrodes. Nyquist plots of [Fe(CN)6]3−/4− obtained at the bare GCE, GR/GCE and GSH–GR/GCE are presented in Fig. S3.† The higher frequencies correspond to the charge transfer resistance (Rct). Rct reflects the interfacial electron transfer ability and can be obtained according to Randles equivalent circuit (inset). In the equivalent circuit, Rct is charge transfer resistance; Rs is the electrolyte resistance; Cdl is double-layer capacitor; and Zw is Warburg impedance. The Rct were 93.46 Ω, 31.73 Ω and 25.93 Ω for the GCE, GR/GCE and GSH–GR/GCE, respectively. The smallest Rct value of the GSH–GR/GCE demonstrated the excellent electrical properties of the GR and GSH. It was also indicated that the GSH–GR composite could facilitate the electron transfer between the [Fe(CN)6]3−/4− probe and the electrode.
Electrochemical behavior of rutin
The electrochemical behavior of rutin (1 × 10⁻⁴ mol L−1) was investigated in 0.1 mol L−1 PBS (pH 3.0) using the CV technique. Fig. 4 shows the superimposed voltammograms obtained at the bare GCE (curve a), GR/GCE (curve b) and GSH–GR/GCE (curve c), respectively. The appearance of a pair of very small redox peaks implied a very weak voltammetric response of rutin at the bare GCE. The cathode peak current being smaller than the anodic peak current (Ipc = 1.71 μA < Ipa = 3.50 μA, curve a) indicated the redox reaction's weak reversibility at the bare GCE. In the case of the GR/GCE, the redox peak currents were increased obviously (curve b), but it was inferior to that of the GSH–GR/GCE (curve c). The anodic peak currents were 11.99 μA at the GR/GCE and 20.97 μA at the GSH–GR/GCE. These data demonstrated that the GSH–GR-modified GCE has the highest response current for rutin, which might be from a synergistic effect of GR and GSH. Following, a sensitive electroanalytical method for rutin was proposed based on the GSH–GR/GCE as the voltammetric sensor.
|
| Fig. 4 Cyclic voltammograms of rutin (1 × 10⁻⁴ mol L−1) obtained at the bare GCE (a), GR/GCE (b) and GSH–GR/GCE (c) (where the blue line is in blank solution). Supporting electrolyte: 0.1 mol L−1 PBS (pH 3.0). Scan rate: 100 mV s−1. | |
Optimization conditions and dynamic parameters
The effect of solution pH. The voltammetric response of the analyte is affected by the pH value of the supporting electrolyte solution. For this system, the influence was investigated within a PBS pH range from 2.0 to 7.0 with a rutin concentration of 1 × 10⁻⁴ mol L−1. The recorded voltammograms under each pH were superimposed and are shown in Fig. 5A. With the pH values increasing, both anodic and cathodic peak potentials shifted negatively, meaning that there was a proton taking part in the electrode process of rutin and the anodic reaction was a proton losing process. In the investigated pH range of 2.0–7.0, there was a linear relationship between the peak potential and pH value (Fig. 5B), with the linear regression equations of Epa (V) = −0.0615pH + 0.7124 (R2 = 0.996) and Epc (V) = −0.0602pH + 0.6567 (R2 = 0.997). The slopes of −0.0615 V and −0.0602 V per unit of pH were close to the theoretical value of −0.0592 V, meaning that the electron transfer was accompanied by an equal number of protons in the electrode process.
|
| Fig. 5 (A) Cyclic voltammograms of rutin (1 × 10⁻⁴ mol L−1) at GSH–GR/GCE in PBS with different pHs. The pH values from curve a to f: 2.0, 3.0, 4.0, 5.0, 6.0, 7.0. (B) pH dependence of Epa (a) and Epc (b). Supporting electrolyte: 0.1 mol L−1 PBS. Scan rate: 100 mV s−1. | |
On the other hand, the redox peak currents of rutin were also changed within the investigated pH range. The biggest peak current was observed at pH 3.0 of PBS, which was selected as the supporting electrolyte to propose the electroanalytical method of rutin.
Influence of scan rate. For further investigating the reaction characters of rutin at the GSH–GR/GCE, the effect of scan rate (ν) on the redox of rutin (1 × 10⁻⁴ mol L−1) was investigated in 0.1 mol L−1 PBS (pH 3.0) using CV. The scan rate was changed from 40 to 280 mV s−1. The superimposed voltammograms are shown in Fig. 6A. Intuitively, both the anodic and cathodic peak currents increased by changing the scan rate from 40 to 280 mV s−1. Quantificationally, the peak currents had a linear relationship with scan rates (Fig. 6C) and obeyed the following equations: Ipa = −0.0800ν − 5.7967 (R2 = 0.991) and Ipc = 0.0786ν + 5.1677 (R2 = 0.990). At the same time, the redox peak currents also had a linear relationship with the square root of the scan rate (Fig. 6D) obeying equations of Ipa = −1.8570ν1/2 + 4.1337 (R2 = 0.986) and Ipc = 1.8247ν1/2 − 4.5973 (R2 = 0.986). These results demonstrated that the electrode reaction of rutin was an adsorption–diffusion controlled electrode process. According to the slope of Ip with ν: Ip = nFQν/4RT, where CV peak area Q can be obtained under a given scan rate. ν, R, F and T represent their usual meanings.35 So the electron-transfer number (n) involved in the electrode reaction of rutin was calculated to be 2. According to the above results and the discussion of pH value, it appears that two electrons and two protons were involved in the quasi-reversible redox reaction of rutin at the GSH–GR/GCE. Therefore, the feasible mechanism for the electrochemical behavior of rutin at the GSH–GR/GCE is described in Scheme 1.
|
| Fig. 6 (A) Superimposed voltammograms of rutin (1 × 10⁻⁴ mol L−1) at GSH–GR/GCE in 0.1 mol L−1 PBS (pH 3.0) with different scan rates (from inside to outside): 40, 60, 80, 100, 120, 160, 180, 200, 240, 280 mV s−1. (B) The relationship of lnν vs. Epa (a) and Epc (b). (C) The relationship of ν vs. Ip. (D) The relationship of ν1/2 vs. Ip. | |
|
| Scheme 1 Redox mechanism of rutin at the GSH–GR/GCE. | |
For the anodic and cathodic peak potentials, they were shifted oppositely following the increase in the scan rate. This means a quasi-reversible electrode process in dynamics. Quantificationally, the peak potentials moved linearly with the natural logarithm of scanning rate (Fig. 6B), obeying the following equations: Epa (V) = 0.0241lnν (V s−1) + 0.5820 (R2 = 0.992) and Epc (V) = −0.0212lnν (V s−1) + 0.4292 (R2 = 0.994). For a quasi-reversible electrode reaction, Laviron's theory35 is suitable and its dynamics equations are described as follows:
|
| (1) |
|
| (2) |
|
| (3) |
where
n,
α and
ks are the number of electrons transferred, the charge transfer coefficient and heterogeneous electron transfer rate constant, respectively;
E0 is the formal standard potential;
ν,
R,
F and
T represent their usual meaning. Based on the slopes of the equations, the dynamics parameters of
α and
ks were calculated by coupling the solution of
eqn (1)–(3). The obtained results for
α and
ks were 0.53 and 1.511 s
−1.
Adsorption capacity of rutin on GSH–GR/GCE
For the electrode process controlled by adsorption–diffusion of rutin, chronocoulometry was employed for obtaining both the diffusion coefficient (D) and the saturated adsorption capacity (Γ*) at the electrode surface. In this experiment, single step chronocoulometry was used to investigate the chronocoulometric behaviors of the GSH–GR/GCE in the absence and presence of 1 × 10⁻⁴ mol L−1 rutin. The potential was stepped from 0.1 V to 0.8 V and the corresponding Q–t curves were recorded (Fig. 7A). Extracting data from Fig. 7A, the linear relations between Q and t1/2 were obtained (Fig. 7B) and expressed as the following equations: Q (10−4 C) = 0.1287t1/2 + 2.685, R2 = 0.998 (Fig. 7B, curve a1); Q (10−4 C) = 0.2939t1/2 + 4.318, R2 = 0.998 (Fig. 7B, curve b1).
|
| Fig. 7 (A) Chronocoulometric response curves obtained in the absence (a) and presence (b) of rutin (1 × 10⁻⁴ mol L−1) in 0.1 mol L−1 PBS (pH 3.0). (B) The dependency of charge Q (10−4) vs. t1/2; corresponding data were derived from (A). | |
Based on Anson's theory36 given eqn (4) and (5):
|
| (4) |
where
Qdl is the double-layer charge;
Qads is the faradaic charge due to the oxidation of adsorbed rutin; and
A,
D and
Γ* are the surface area of the electrode, the diffusion coefficient and surface adsorption capacity of rutin, respectively. Based on the experimental data above, the value of
Qads was calculated to be 1.633 × 10
−4 C for the oxidation process of rutin. The diffusion coefficient (
D) was calculated to be 1.851 × 10
−10 cm
2 s
−1 according to the formula
(4), further, the value of
Γ* was estimated as 8.531 × 10
−9 mol cm
−2 based upon
eqn (5).
Analytical applications
Influence of accumulation time. For the electrode process being controlled to a certain extent by adsorption and increasing detection sensitivity, it was necessary to investigate the influence of accumulation conditions. The relationship was recorded between accumulation time (t/s) prolonging from 0 to 240 s and peak current in a rutin solution (1 × 10⁻⁵ mol L−1) by CV. Comparatively, the anodic peak currents of rutin achieved the greatest value with an accumulation time of 150 s and later on increased slowly. This demonstrated that the adsorption of rutin reached saturation at the sensor surface. At the same time, it was found that the accumulation potential had little influence on the adsorption accumulation. Based on the above investigation, an accumulation time of 150 s under an open circuit was selected for rutin.
Calibration curve and detection limit
The calibration curve was estimated under the selected optimum conditions. For adsorption accumulation first, the stripping technique was selected to get the maximal stripping current. The results showed that the SWV was suitable. Fig. 8A shows the superimposed SWV curves of rutin with various concentrations in pH 3.0 PBS solution. As shown in Fig. 8B. The anodic stripping peak currents were increased linearly with the rutin concentrations in the range of 5.0 × 10⁻⁹ to 1.0 × 10⁻⁶ mol L−1. The linear regression equation was expressed as Ipa = 59.485Crutin (μmol L−1) + 2.209 (R2 = 0.993). The detection limit was calculated as 7 × 10⁻¹⁰ mol L−1 based on S/N = 3. Table 1 lists the data for comparison of the different voltammetric sensors for the determination of rutin. It can be seen that a simple and sensitive method was achieved using the proposed sensor. Moreover, comparing with other sensors, the voltammetric sensor was more convenient, simpler, and more environmentally friendly.
|
| Fig. 8 (A) The superimposed SWV curves of rutin at different concentrations in 0.1 mol L−1 PBS (pH 3.0) (from curve a to i): 5 × 10⁻⁹, 1 × 10⁻⁸, 3 × 10⁻⁸, 7 × 10⁻⁸, 1 × 10⁻⁷, 3 × 10⁻⁷, 5 × 10⁻⁷, 7 × 10⁻⁷ and 1 × 10⁻⁶ mol L−1. (B) The linear relation between Ip and Crutin. | |
Table 1 Comparison of different modified electrodes for rutin detection
Electrode |
Linear range (10−6 mol L−1) |
Detection limit (10−6 mol L−1) |
References |
SWCNT/CILE |
0.1–800 |
0.07 |
10 |
AuNPs/en/MWNTs/GCE |
0.048–0.96 |
0.032 |
11 |
β-CD/re-CNFs/GCE |
0.3–15 |
0.09 |
12 |
YHCFNPs/CRGO/CPE |
0.002–4 |
0.0082 |
13 |
PtNP–rGO/GCE |
0.05–10 |
0.01 |
14 |
β-CD@CRG/Nafion/GCE |
0.006–10 |
0.002 |
15 |
MWNTs–COOH/Fe3O4/GCE |
0.025–1.37 |
0.0075 |
16 |
GSH–GR/GCE |
0.005–1.0 |
0.0007 |
This work |
Repeatability, stability and interferences
For estimating the applicability of the proposed method, its repeatability was assessed in a 1.0 × 10⁻⁶ mol L−1 rutin solution by SWV under the optimal conditions. From five parallel determinations, the relative standard deviation (RSD) of 4.32% stripping currents indicated the good repeatability of the proposed method. Moreover, after a GSH–GR/GCE was stored for a week at ambient conditions, it could retain 96.71% of its current response for rutin (1.0 × 10⁻⁶ mol L−1), indicating the excellent storage stability of GSH–GR/GCE.
In order to investigate the selectivity and sensitivity of the proposed method, some possible coexisting components for the detection of rutin (1 × 10⁻⁶ mol L−1) were investigated by SWV. When citric acid, sodium citrate, D-tartaric acid and sodium tartrate were at 100-fold the concentration of rutin, the peak current of rutin changed less than ±3.6%. Moreover, glucose, faecula and L-ascorbic acid at 10-fold the concentration of rutin also did not show any interference, but dopamine interfered with the determination seriously.
Determination of rutin in real samples
In order to test the practical application of the proposed method, it was employed for the measurement of rutin in buckwheat tea and rutin tablets. The real samples were bought randomly from a local supermarket and a pharmacy. Three drug tablets were ground and extracted with 10 mL ethanol for 30 min in an ultrasonic bath. After centrifugation and filtration, the clear filtrate was collected as the sample solution.15 The detection results were calculated to be 19.5 ± 0.49 mg per tablet, which was in good agreement with the label amount of 20 mg per tablet.
One packet (5 g) buckwheat tea was weighed accurately and dissolved in 500 mL of boiled water, brewed for 20 min, then filtered to obtain a stock solution.37 Table 2 lists the detection results. By conversion back to the real sample, the content of rutin in buckwheat tea was 0.013 mg g−1 (0.067 mg/500 mL). Meanwhile indicating that we can obtain micro-rutin by drinking buckwheat tea, so often drinking buckwheat tea is benefit to human’s health. All the voltammetric method results were well in agreement with the HPLC results, confirming that the prepared GSH–GR/GCE had high efficiency and accuracy for the determination of rutin.
Table 2 Recovery of the determination of rutin in buckwheat tea
SWV |
HPLC |
Sample (10−6 L) |
Original detected value (10−7 mol L−1) |
Standard added (10−7 mol L−1) |
Detected total value after added (10−7 mol L−1) |
Recoverya (%) |
R.S.D.a (%) |
Detected valuea (10−7 mol L−1) |
R.S.D.a (%) |
Average value of three replicate measurements. |
20 |
2.25 |
1.0 |
3.23 |
98.0 |
4.07 |
2.31 |
2.60 |
1.0 |
4.25 |
102.0 |
3.39 |
Conclusions
In summary, a large-scale, environmentally friendly method to produce water-soluble GR was developed with GSH. GSH played a dual role in the formation of GSH–GR, one was that the GO was functionalized with GSH and the other was reducing the GO to GR. A simple dropwise method for construction of a GSH–GR/GCE was proposed. The voltammetric response of rutin on this sensor was carefully investigated and some dynamics parameters were calculated. A new electroanalytical method for detection of rutin was proposed synchronously with a wider linear range of 5.0 × 10⁻⁹ to 1.0 × 10⁻⁶ mol L−1 and a lower detection limit of 7 × 10⁻¹⁰ mol L−1 (S/N = 3).
Acknowledgements
The authors are very grateful for the financial support from the National Natural Science Foundation of China (Grant no. 21575130; U1504216) and the Startup Research Fund of Zhengzhou University (1511316006).
References
- Z. Danuta, S. N. Dorota and Z. Henryk, Int. J. Food Prop., 2013, 16, 228–239 CrossRef.
- P. Y. Qin, L. Wu, Y. Yao and G. X. Ren, Food Res. Int., 2013, 50, 562–567 CrossRef CAS.
- R. M. Gene, C. Cartana, T. Adzet, E. Marin, T. Panella and S. Canigueral, Planta Med., 1996, 62, 232–235 CrossRef CAS PubMed.
- H. Soni, J. Malik, A. K. Singhai and P. Harish, Asian J. Chem., 2013, 25, 8371–8373 CrossRef CAS.
- J. Geer, J. A. J. Hanraads and R. A. Lupton, Journal of Science Communication, 2000, 163, 51–59 Search PubMed.
- I. H. Kilic, C. Sarikurkcu, I. D. Karagoz, M. C. Uren and M. S. Kocak, RSC Adv., 2016, 6, 1203–1209 RSC.
- K. Farhadi, F. Esmaeilzade, M. Hatami, M. Forough and R. Molaie, Food Chem., 2016, 199, 847–855 CrossRef CAS PubMed.
- Z. H. Song and L. Wang, J. Agric. Food Chem., 2001, 49, 5697–5701 CrossRef CAS PubMed.
- F. Gate, E. D. Teodor, A. O. Matei, G. I. Badea and G. L. Radu, Food Analytical Methods, 2015, 8, 1197–1206 CrossRef.
- Z. H. Zhu, X. Y. Sun, X. M Zhuang, Y. Zeng and W. Sun, Thin Solid Films, 2010, 519, 928–933 CrossRef CAS.
- S. L. Yang, L. B. Qu, G. Li, R. Yang and C. C. Liu, J. Electroanal. Chem., 2010, 645, 115–122 CrossRef CAS.
- X. H. Zhu, Q. F. Jiao, X. X. Zuo, X. Xiao, Y. Liang and J. M. Nan, J. Electrochem. Soc., 2013, 160, H699–H703 CrossRef CAS.
- S. L. Yang, G. Li, G. F. Wang, J. H. Zhao and L. B. Qu, Sens. Actuators, B, 2015, 206, 126–132 CrossRef CAS.
- P. F. Pang, H. Z. Li, Y. P. Liu, Y. L. Zhang, L. L. Feng, H. B. Wang, Z. Wu and W. R. Yang, Anal. Methods, 2015, 7, 3581–3586 RSC.
- K. P. Liu, J. P. Wei and C. M. Wang, Electrochim. Acta, 2011, 56, 5189–5194 CrossRef CAS.
- C. L. Bian, Q. X. Zeng, L. J. Yang, H. Y. Xiong, X. H. Zhang and S. F. Wang, Sens. Actuators, B, 2011, 156, 615–620 CrossRef CAS.
- K. S. Novoselov, A. K. Geim, S. V. Morozov, Y. Zhang, S. V. Dubonos, I. V. Grigorieva and A. A. Firsov, Science, 2004, 306, 666–669 CrossRef CAS PubMed.
- C. Wu, Q. Cheng, K. B. Wu, G. Wu and Q. Li, Anal. Chim. Acta, 2014, 825, 26–33 CrossRef CAS PubMed.
- E. Ahmed, J. H. Wang and L. A. Wiyao, Int. J. Solids Struct., 2016, 81, 383–392 CrossRef.
- S. Gupta, E. Heintzman and J. Jasinski, J. Raman Spectrosc., 2015, 46, 217–230 CrossRef CAS.
- Y. Zhang, L. Zhang, P. Kim, M. Ge and C. Zhou, Nano Lett., 2012, 12, 2810–2816 CrossRef CAS PubMed.
- K. Zhang, L. Mao, L.
L. Zhang, H. S. O. Chan, X. S. Zhao and J. S. Wu, J. Mater. Chem., 2011, 21, 7302–7307 RSC.
- L. L. Yu, M. X. Shi, X. Yue and L. B. Qu, Sens. Actuators, B, 2016, 225, 398–404 CrossRef CAS.
- I. A. Sahito, K. C. Sun, A. A. Arbab and M. B. Qadir, Electrochim. Acta, 2015, 173, 164–171 CrossRef CAS.
- L. Fu, Y. H. Zheng, A. W. Wang and H. T. Lin, Food Chem., 2015, 181, 127–132 CrossRef CAS PubMed.
- D. C. Zhang, X. Zhang, Y. Chen and Y. W. Ma, Electrochim. Acta, 2012, 69, 364–370 CrossRef CAS.
- T. A. Pham, J. S. Kim, J. S. Kim and Y. T. Jeong, Colloids Surf., A, 2011, 384, 543–548 CrossRef CAS.
- S. Bose, T. Kuila, M. E. Uddin, N. H. Kim, A. K. T. Lau and J. H. Lee, Polymer, 2010, 51, 5921–5928 CrossRef CAS.
- J. F. Shen, B. Yan, M. Shi, H. W. Ma, N. Li and M. X. Ye, J. Mater. Chem., 2011, 21, 3415–3421 RSC.
- W. H. Qiao, L. Wang, B. X. Ye, G. P. Li and J. J. Li, Analyst, 2015, 140, 7974–7983 RSC.
- H. L. Guo, X. F. Wang, Q. Y. Qian, F. B. Wang and X. H. Xia, ACS Nano, 2009, 3, 2653–2659 CrossRef CAS PubMed.
- Ó. Vargas, Á. Caballero and J. L. Morales, Electrochim. Acta, 2015, 165, 365–371 CrossRef.
- S. L. Yang, G. Li, G. F. Wang, J. H. Zhao, M. F. Hu and L. B. Qu, Sens. Actuators, B, 2015, 208, 593–599 CrossRef CAS.
- B. Rezaei and S. Damiri, Sens. Actuators, B, 2008, 134, 324–331 CrossRef CAS.
- E. Laviron, J. Electroanal. Chem., 1979, 101, 19–28 CrossRef CAS.
- F. C. Anson, Anal. Chem., 1964, 36, 932–934 CrossRef CAS.
- L. H. Yao, Y. M. Jiang, N. Caffin and Y. Xu, Food Chem., 2006, 96, 614–620 CrossRef CAS.
Footnote |
† Electronic supplementary information (ESI) available. See DOI: 10.1039/c6ra13457b |
|
This journal is © The Royal Society of Chemistry 2016 |
Click here to see how this site uses Cookies. View our privacy policy here.