Transport properties of microemulsions with ionic liquid apolar domains as a function of ionic liquid content

Jakub Piekart and Justyna Łuczak*
Department of Chemical Technology, Chemical Faculty, Gdańsk University of Technology, ul. Narutowicza 11/12, 80-233 Gdańsk, Poland. E-mail: justyna.luczak@pg.gda.pl; Tel: +48 58 347 13 65

Received 19th May 2016 , Accepted 14th September 2016

First published on 15th September 2016


Abstract

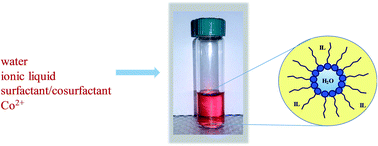
The specific conductivity, dynamic viscosity and apparent diffusion coefficient of each of four aqueous ionic liquid microemulsions (IL-MEs) were measured as a function of ionic liquid (IL) content. The investigated systems were composed of water, hydrophobic ILs (1-butyl-3-methylimidazolium hexafluorophosphate or bis(trifluoromethanesulphonyl)imide) and the nonionic surfactant Triton X-100 or its mixture with cosurfactant (butanol). Measurements were conducted across the whole IL content range, and results are discussed in terms of the anion type and the influence of cosurfactant. The comparative approach revealed that IL-MEs exhibit higher conductivity than pure ILs, that addition of cosurfactant further increases the conductivity of the system, and that the increase depends on the anion structure. Furthermore, addition of cosurfactant causes a serious decrease in viscosity which is beneficial since high viscosity is one of the factors limiting the broader use of ILs. The apparent diffusion coefficients, measured with cyclic voltammetry, exhibited good consistency with values obtained by other techniques and allowed closer insight into the properties and structures of the studied systems. The conclusions were supported by UV-Vis as well as FTIR spectrophotometric measurements. The pronounced facilitation of transport properties is favorable to many applications such as synthesis or separation processes. This is the first work regarding the dependence of IL-based ME properties on IL content.

1. Introduction

Ionic liquids (ILs) are organic salts with a melting point below 100 °C composed of relatively large, asymmetric organic cations and inorganic or organic anions. Due to their unique physical and chemical properties including their low volatilities, high thermal stabilities, high conductivities and wide electrochemical windows, ILs have drawn much scientific and industrial attention in recent times, especially since the invention of water stable ILs by Wilkes and Zaworotko.1 One of the most pronounced features of this class of solvents is the almost unlimited number of anion–cation combinations and their modifications, which gives the prospect of designing ILs with properties adjusted to a specific task. In this regard ILs are often called “designer solvents” and constitute a research focus in many fields including: separation,2 nanomaterial synthesis,3 catalytic reactions,4 gas purification5 and energy production.6

Microemulsions (MEs) are thermodynamically stable, homogenous (or microheterogenous) transparent systems composed of two immiscible liquids, stabilized by the presence of surfactants.7–16 They have been applied in many fields such as: separation processes,17 the preparation of organic18 and inorganic19,20 nanoparticles and polymerization.21 Because of the presence of polar and nonpolar components, MEs can solubilize substances of various polarities. This property was the fundamental reason for research into ionic liquid microemulsions (IL-MEs) and is mentioned in almost every paper regarding the topic. Indeed, IL-MEs can overcome the inability of a ILs to dissolve a number of chemicals, thereby broadening the utility of these solvents. So far, most attention has been paid to the MEs in which water is replaced with an IL.22–28 Although such systems can be useful when waterless conditions or extreme temperatures are required (the IL-ME liquid temperature range can be adjusted to very high and low temperatures), the main disadvantage of conventional systems (i.e. the use of organic solvents) still remains. However, with time, aqueous IL-MEs are drawing more and more attention, as they – in terms of green chemistry principles – constitute a more promising alternative.29–38 In contrast to conventional MEs, IL-ME systems may contain highly conductive polar, nonpolar or both phases that undergo a variety of specific interactions, and hence constitute new, interesting media. In addition, the role of the ILs in ME formation may be extended to that of surfactants stabilizing two immiscible liquids.34 More detailed information is given in reviews by Qiu and Texter,39 Mehta and Kaur40 and Kunz et al.29

In our previous work35 we have presented studies on transport properties (specific conductivity, dynamic viscosity and apparent diffusion coefficients) of aqueous IL-MEs as a function of water content in the presence or absence of cosurfactant. We concluded that the anion type largely influences the effect of a cosurfactant on the specific conductivity of the ME, and that a simple comparison of the properties of two ILs is not enough to predict the properties of the corresponding ME systems. At an appropriate composition, IL-MEs can be characterized by significantly higher conductivity than the pure ILs, with viscosities comparable to those of molecular solvents and definitely lower prices due to the IL content being only a small percentage. However, despite many undisputed advantages, such systems exhibit weaknesses, which result from their high water content. High amounts of water limit some of the advantages of pure ILs such as high liquid temperature ranges and broad electrochemical windows. Moreover, some of the ME applications (such as, for example, nanostructure preparation) require formation of water-in-oil (W/O, Winsor II) systems.41 Therefore, in this work we concentrate on the dependence of the transport properties of IL-based systems upon IL content, focusing especially on IL-rich systems – solutions or water-in-IL (W/IL) MEs. To date, multitechnique evidence of W/IL-ME formation has been provided only for water/AOT/(1-octyl-3-methylimidazolium- and 1-alkylimidazolium bis(trifluoromethanesulfonyl)imide)36 and water/Brij-35/1-butyl-3-methylimidazolium hexafluorophosphate MEs.33 Moreover, although W/IL systems have been presented in the literature as media for enzymatic reactions42 or nanoparticle synthesis,43 these studies have been concentrated on specific composition in the given ternary (or pseudo-ternary) system and have not delivered explanations for the definite qualitative or quantitative choice of components.

In this study, we aim to explain how the structure of an IL and the presence of cosurfactant affect the properties of IL-rich ME systems. The IL-MEs water/Triton X-100 (TX-100)/1-butyl-3-methylimidazolium hexafluorophosphate ([BMIM][PF6]) and water/TX-100/1-butyl-3-methylimidazolium bis(trifluoromethanesulphonyl)imide ([BMIM][Tf2N]) are investigated as a function of IL content and compared in the presence absence of the cosurfactant n-butanol (BuOH). The [BMIM][PF6]-based ME systems are the most often studied ones, however, to date, mainly the water-rich structures have been investigated. Analogously, MEs containing [BMIM][Tf2N] salts,35 which are more stable and resistant to hydrolysis, have been studied only as a function of water content. From the application point of view, the [Tf2N]-based MEs seem to be interesting due to the lower solubility of pure [BMIM][Tf2N] in water, and their lower viscosity and thereby higher mass transfer when compared to the analogue containing the [PF6] anion. Therefore, to the best of our knowledge, this is the first work regarding the dependence of IL-based ME properties on IL content. In addition to the transport properties, we conduct FTIR and UV-Vis studies with CoCl2 to further confirm the formation of the MEs as well as UV-Vis with methyl orange (MO) to get additional knowledge of the state of the interfacial palisade.

2. Materials and methods

2.1. Materials

Non-ionic surfactant TX-100 (extra pure grade) was obtained from Carl Roth GmbH and used as received. ILs, viz. [BMIM][PF6] and [BMIM][Tf2N], were obtained from IoLiTec, Germany, with a purity of ≥99%. ILs were degassed and dried under a vacuum of 20 Pa (Thermo VT 6025, Germany) for 24 h at a temperature of 70 °C, to reduce the water content and volatile compounds to negligible levels. The water content in the ILs, determined by coulometric Karl-Fischer titration (model 899 Coulometer, Metrohm), was lower than 250 ppm. Potassium hexacyanoferrate(III) (K3Fe(CN)6) was purchased from Sigma-Aldrich and used as received. Reverse osmosis water was used in the experiments (HLP smart 2000, Hydrolab, Poland).

2.2. Apparatus and procedures

The conductivity measurements were performed using a conductivity meter (Elmetron, Poland) combined with a microconductivity electrode (Eurosensor, EPST-2ZA, Poland). The dynamic viscosities of the MEs and solutions were measured using a Brookfield LVDV-III Programmable Rheometer (cone-plate viscometer; Brookfield Engineering Laboratory, USA), controlled by a computer. Cyclic voltammetry was applied to determine the apparent diffusion coefficients of the MEs with the use of K3Fe(CN)6 as the electroactive probe. The electrochemical cell was composed of three electrodes: a silver chloride electrode was the reference electrode, a platinum rod was the counter electrode and a glassy carbon electrode was the working electrode. The measurements were performed according to the procedure described elsewhere,23,30 where transfer coefficients were taken into consideration.35 Measurements were made for 25–150 mV s−1 sweep rates, with 25 mV s−1 steps, using an Atlas 0531 Electrochemical Unit with AtlasCorr05 software. The working electrode was polished with AlCl3 powder and rinsed with distilled water before use. The specific area of the working electrode was determined using 4 mM K3Fe(CN)6 in 1 M KCl solution, with the known diffusion coefficient of 6.3 × 10⁻¹⁰ (m2 s−1).30 The temperature of all measurements was maintained at a constant value of 25 ± 0.1 °C with a thermostatic bath (PolyScience AD07R-20, USA) and at atmospheric pressure. Infrared spectra were recorded using a FTIR Spectrometer Nicolet iS10 (Thermo, USA) using the attenuated total reflection technique in the spectral range from 650 to 4000 cm−1, at a resolution of 8 cm−1. One hundred scans were taken for each sample and averaged. UV-Vis spectrophotometric measurements were carried out with a Spectrophotometer Beckmann DU 520 (Beckmann Coulter, USA) using solvatochromic MO and CoCl2 as probes.

3. Results and discussion

The ternary and pseudo-ternary phase diagrams of the water/TX-100/[BMIM][PF6] and water/TX-100/[BMIM][Tf2N] systems, investigated in the presence of cosurfactant (butanol) and determined at 25 °C, have already been presented and compared in our previous work.35 However, to facilitate understanding and for clarity, the phase diagrams are reproduced and the selected dilution lines used in this work are depicted (Fig. 1). The two dilution lines with TX-100/H2O and (TX-100[thin space (1/6-em)]:[thin space (1/6-em)]BuOH)/H2O mass ratios of 0.05/0.95 and 0.15/0.85 were chosen as test systems and are marked in Fig. 1 as L95 and L85, respectively. These lines represent the ME compositions studied in this work and were chosen due to the occurrence of clear systems in the whole composition range. It is worth noting that regions where real or micellar solutions are formed instead of MEs have not been discussed in published work in the field of IL-MEs. However, it is known that addition of water does not necessarily lead to the formation of water pools, and thereby MEs, because the amount of surfactant plays a key role.37 In this report, we aim to take this into consideration.
image file: c6ra13061e-f1.tif
Fig. 1 Phase diagrams of IL/(TX-100[thin space (1/6-em)]:[thin space (1/6-em)]BuOH)/H2O systems with ILs [BMIM][PF6] (red line) and [BMIM][Tf2N] (blue line),35 determined at 25 °C.

3.1. Specific conductivity measurements

Appearance of conductivity maximum. In Fig. 2A the dependence of specific conductivity on IL content for the [BMIM][PF6]-based system with the mixed surfactant TX-100[thin space (1/6-em)]:[thin space (1/6-em)]BuOH (2[thin space (1/6-em)]:[thin space (1/6-em)]1 mass ratio) is presented. Due to the fact that the results obtained for various systems are qualitatively similar to each other, we are first going to discuss more extensively one of the conductivity profiles and then take the differences between the systems into consideration.
image file: c6ra13061e-f2.tif
Fig. 2 (A) Dependence of the specific conductivity of the H2O/(TX-100[thin space (1/6-em)]:[thin space (1/6-em)]BuOH)/[BMIM][PF6] system at a H2O/(TX-100[thin space (1/6-em)]:[thin space (1/6-em)]BuOH) mass ratio equal to 0.15[thin space (1/6-em)]:[thin space (1/6-em)]0.85 (the L85 dilution line) as a function of IL content, determined at 25 °C. (B) Specific conductivity of the [BMIM][PF6]-based system at a [BMIM][PF6]/TX-100 mass ratio of 0.15[thin space (1/6-em)]:[thin space (1/6-em)]0.85 (the L85 dilution line) as a function of water content,35 determined at 25 °C.

Interestingly, the conductivity dependence profiles are quite similar to those obtained for titration with water as presented by Lian et al.38 and in our previous report35 (results for other regions of the phase diagram). Therefore, for comparison purposes, the specific conductivity dependence of [BMIM][PF6]/(TX-100)/H2O as a function of the water mass fraction is also included as Fig. 2B.35 It was observed that the conductivity of the W/IL system presented in Fig. 2A increases continuously with increasing IL mass fraction, being related to the rising number of IL ions in the system. The quite uniform slope of the dependence can be maintained as long as the newly added portions of IL are characterized by almost the same molar conductivity as the IL added previously. It is known that oxyethylene (OE) units of TX-100 interact strongly with imidazolium rings. Furthermore, due to the high number of OE units per TX-100 molecule (9–10), the number of OE units is higher than that of the IL species until a very high content of IL is reached. Therefore, the IL species are somewhat “enclosed” within TX-100 molecules, and new IL portions do not change significantly the local ionic strength of IL species. However, the ionic strength does change when the IL content is very high, which leads to a decrease of the molar conductivity of the IL, hence a decrease of the specific conductivity of the system. This is discussed further in the subsection “influence of mass ratio” below.

Therefore, the conductivity profile reaches a maximum, and subsequent addition of IL (the only source of species responsible for ionic transport) decreases the conductivity to values of the pure IL. Parameters of all systems corresponding to the maximum conductivity are collected in Table 1.

Table 1 Properties of IL-MEs corresponding to the maximum conductivities from IL-titration curves. Specific conductivities and dynamic viscosities are compared with the properties of the pure ILs
Ionic liquid Surfactant κmax [mS cm−1] κmax/κIL η [mPa s] η/ηIL wIL|wH2O
[BMIM][PF6] TX-100 2.14 143% 177.9 68% 0.871|0.019
TX-100[thin space (1/6-em)]:[thin space (1/6-em)]BuOH 3.95 263% 68.5 25% 0.767|0.035
[BMIM][Tf2N] TX-100 4.22 106% 50.4 107% 0.951|0.007
TX-100[thin space (1/6-em)]:[thin space (1/6-em)]BuOH 5.26 131% 31.8 68% 0.864|0.020


Interestingly, for both W/IL systems without butanol, the maximum conductivity corresponds to a mass fraction of IL at which the water content is below its solubility in pure IL. In the works of Behera et al.44 and Piekart and Łuczak35 (water titration lines), an increase of the IL solubility in the aqueous micellar solution of TX-100 in comparison with pure water was observed, and the maximum appeared at an IL content exceeding its solubility in water. Hence, it was stated that the presence of TX-100 increases the solubility of the IL in water. However, in the reverse systems described here, the water content at the maximum conductivity point is below its solubility in the pure IL (2.30 and 1.58 wt% in [BMIM][PF6] and [Tf2N], respectively45); values of 1.9 and 0.7% of water uptake corresponded to the conductivity maxima of the investigated systems (with no butanol). This can be explained as follows: if a ME is not formed, the hydrophilic parts of the surfactant may be separated from the continuum, for the sake of micelle formation. Thus, the IL continuum is exposed to interactions with hydrophobic tails, which lowers the polarity of the continuum and the solubility of water therein. This does not mean that interactions between OE groups and water are completely absent, but we surmise that the hydrophobic contribution is dominant.

Despite similarities between the profiles representing titration with water and IL (Fig. 2A and B, respectively), the conductivity decline after the maximum must have different origins. At this stage we assumed that the maximum conductivity point indicates a transition from a W/IL-ME to a micellar system or a solution of TX-100 in the IL. A good agreement of the maximum with the transition point indicated by other, more direct methods (FTIR and UV-Vis) will be given in the following sections. In the phase diagrams available in the literature, the micellar region is generally absent, due to a minority of research on the properties and structural changes of IL-MEs as a function of IL content. Therefore, the whole water-poor region is usually marked as the W/IL region. However, at a surfactant content exceeding the critical micelle concentration (CMC), formation of micellar aggregates in ILs may take place, as has been already confirmed in variety of systems, and this is dependent on IL structure.38,46,47 Micellization of TX-100 was confirmed in [BMIM][PF6]38 but not in pure [BMIM][Tf2N] in the measurement conditions applied to date (binary systems). The influence of water on the microstructure of the TX-100 surfactant in [BMIM][PF6] micelles was investigated by Li et al., revealing that addition of water to the micellar solution results in bonding of the water molecules to the OE groups of the surfactant (i.e. bridging of OE tails), facilitating formation of water nanopools in a ME.48

In comparison, there are very few reports in which an IL has been used as the titration agent in conductivity studies of nonaqueous IL-MEs, and in these reports, a maximum has not been detected.23,49 The absence of a maximum in nonaqueous IL-MEs may be explained by the fact that most of the organic solvents do not limit the negative impact of the surfactant on IL mobility to the extent that occurs in the presence of water (water molecules form strong interactions with the OE groups of the surfactant, limiting interactions between the surfactant and IL35,38). However, maxima were observed in the conductivity profiles of IL mixtures with molecular solvents50 as a function of IL content, which reflects the optimum between total IL concentration and the participation of IL species in charge transfer (the number of neutral ion pairs).

Influence of cosurfactant addition. In Fig. 3, the conductivity dependence of [BMIM][PF6]- and [BMIM][Tf2N]-based MEs on IL content, for the systems with and without butanol, at a constant H2O/(TX-100[thin space (1/6-em)]:[thin space (1/6-em)]BuOH) mass ratio equal to 0.15[thin space (1/6-em)]:[thin space (1/6-em)]0.85, was compared. The conductivity dependence profiles are similar to those obtained without cosurfactant (i.e. there is an increase of conductivity with IL content, a maximum is reached, and then the conductivity drops).
image file: c6ra13061e-f3.tif
Fig. 3 Influence of the ILs (image file: c6ra13061e-u1.tif) [BMIM][PF6] and (image file: c6ra13061e-u2.tif) [BMIM][Tf2N] on the specific conductivities of aqueous IL-MEs with TX-100 surfactant (open symbols), and the TX-100/BuOH (2[thin space (1/6-em)]:[thin space (1/6-em)]1 mass ratio) mixed surfactant (filled symbols), determined at 25 °C. The water-to-(mixed) surfactant mass ratio was 0.15/0.85. The gap in the figure results from a transition to a multiphase system.

It can be clearly seen that the introduction of the cosurfactant to the ME results in a significantly higher maximum conductivity for both ILs, contrary to the titration with water35 where the maximum of the system with [BMIM][Tf2N] remained unchanged. Moreover, the cosurfactant affects conductivity to a much greater extent in the case of the system with [BMIM][PF6] than that of [BMIM][Tf2N], which presumably stems from the same reasons proposed when water was used as the titration agent,35 i.e. water and butanol differently influence the strength of the hydrogen bonding between the anion and the C2-hydrogen of the [BMIM]-cation. Parameters of the systems corresponding to the maximum conductivity are collected in Table 1. The major advantages of the butanol-containing IL-MEs, namely significantly higher conductivity, lower viscosity and – due to the lower IL content – somewhat lower total price, can help to overcome hindrances to the application of ILs. It should be noted, however, that this work does not aim to optimize the kind and amount of surfactant, which would require additional, extensive work in order to combine better transport properties and minimized volatility.

For the [BMIM][PF6]-based system, the maximum conductivity in the presence of cosurfactant occurs at a lower [BMIM][PF6] content, and a 1.8-fold higher specific conductivity and 2.6-fold lower dynamic viscosity are achieved. It is worth keeping in mind that the latter property is widely considered to be one of the factors limiting the wider use of ILs, and these benefits come from a relatively low butanol content. For the system with [BMIM][Tf2N], the same effects are present, but to a lesser extent. Pronounced facilitation of transport properties together with maintenance of electrochemical stability is strongly favorable to such applications as electrodeposition43,51 and electropolymerization52 in ILs.

At a certain IL content, the conductivity of the system exceeds the conductivity of the pure IL (Table 1) (conductivities of pure [BMIM][Tf2N] and [BMIM][PF6] were measured to be 4.0 and 1.5 mS cm−1, respectively, in agreement with previous studies53,54). We can attribute this particularly to the effect of water and/or butanol present in the continuous phase, and the lowering of ion pairing in the ILs which exerts a more pronounced impact than the interactions between the imidazolium rings and OE groups of surfactant (for example no. 2 in Fig. S2).

It is well known that, aside from electrostatic interactions, hydrogen bonding between the fluorine atoms of [PF6] and the C2-hydrogen of [BMIM] occurs in [BMIM][PF6].55 Both are responsible for high viscosity and ion pairing, and thus the lower conductivity of the IL. In the presence of water and butanol, hydrogen bonds between the fluorine atoms and oxygen from the hydroxyl group of H2O/BuOH (interactions no. 5 and 6 in Fig. S2) are formed. As a consequence, the hydrogen bonding between [BMIM] and [PF6] (no. 4) is weakened, thereby resulting in a lower proportion of the IL existing in a form of electrostatically neutral ionic pairs and resulting in a conductivity increase which exceeds the conductivity of the pure IL. This conclusion can be supported by the work of Schröder et al.,56 who conducted molecular dynamics simulations of a binary [BMIM][BF4]/H2O system and revealed that the interactions between cations and anions is weakened by the long-range dipolar field exerted by water molecules and that this effect does not require water molecules to penetrate the ionic pair. Moreover, Hu et al.,57 who investigated ion–ion and ion–solvent interactions in IL solutions with the use of solvents characterized by various dielectric constants, came to the conclusion that a decrease of permittivity moves the equilibrium in solution towards ion pairing. Nevertheless, in the case of alcohols, this effect is somewhat limited due to the interactions of ions and the hydroxyl group of alcohols. Due to the fact that partial replacement of TX-100 with butanol brings about a decrease of permittivity (the dielectric constant of butanol is lower at 17.64), this should promote IL ion pairing (thus decreased conductivity). However, despite lowering the permittivity of the system, the introduction of the cosurfactant makes a positive contribution (increases conductivity). Thus, we can conclude that other factors also influence the overall conductivity of the ME system, i.e. the lower TX-100 content (positive), lower viscosity (positive) and higher solubility of water (positive). Additional factors providing the conductivity increase of the W/IL systems may be related to the state of the OE units of the surfactant that is certainly different in W/IL and micellar/real solutions (even at the same water/TX-100 ratio). Therefore, the way in which the addition of the IL affects the conductivity of the system depends on the availability of active OE sites in TX-100 that can interact with the IL.38

It was mentioned above that after a conductivity peak in the profiles presented in Fig. 2 and 3, the trend is reversed, despite further increasing the IL content. We might have expected that further addition of the IL and a lowering of the surfactant content below the CMC with increasing IL content “should” result in a more pronounced increase in conductivity, because the interactions between TX-100 and the IL molecules in the IL solution should decrease. Indeed, such a relationship between the conductivity of the system and the Tween 20 content in selected ILs was observed for binary surfactant/IL systems.46 However, the observed relationship reported in this work is the opposite. Therefore, the measurements suggest that other interactions, i.e. those between the IL or surfactant with water and/or butanol, must dominate.

A decrease of water content must entail fewer IL–water interactions, thus the formation of electrostatically neutral ionic pairs, which is manifested by an even steeper decrease of the conductivity close to a mass fraction of 1.0. In the case of the system with butanol, the decrease is more significant and begins at a lower IL content range – the static dielectric constant of butanol is higher than those of both ILs used58 – hence its presence in the continuum enhances water uptake. The decrease of conductivity could be also related to an increase of dynamic viscosity, impeding the transport of ions. This indeed occurs, and will be discussed in the viscosity section. Eventually, with increasing IL content, the role of the IL as a dominating compound becomes more significant, and the system achieves the conductivity of the pure IL.

Influence of mass ratio. The conductivity values of both IL systems without cosurfactant at low IL content are almost identical. In turn, the conductivity of the [BMIM][PF6] system with cosurfactant, up until an IL mass fraction (wIL) of ca. 0.4, is higher, but still very close to that of [BMIM][Tf2N] with cosurfactant (Fig. 3). However, the comparison of the conductivity dependences of the systems with butanol at various water-to-(mixed) surfactant mass ratios brings additional interesting observations (Fig. 4). Our attention should be drawn to the juxtaposition of the [BMIM][PF6]- and [BMIM][Tf2N]-based systems for the H2O/(TX-100[thin space (1/6-em)]:[thin space (1/6-em)]BuOH) mass ratio equal to 0.25/0.75. For the available low and medium IL content range, the conductivity of the [BMIM][PF6]-based ME is significantly higher than that of the [BMIM][Tf2N]-based ME, although it is the latter IL that is characterized by higher conductivity in its pure state. The reason for this could be the stronger interactions between [BMIM] cations and OE groups of TX-100 in the case of [BMIM][Tf2N] (which has weaker cation–anion interactions) and the resultant more significant decrease in mobility of this IL, which was thoroughly explained in our previous report.35 When we pay attention to the relative conductivities of three pairs characterized by different H2O/(TX-100[thin space (1/6-em)]:[thin space (1/6-em)]BuOH) mass ratios (0.05/0.95, 0.15/0.85 and 0.25/0.75), we come to the conclusion that the higher the mass ratio, the greater the conductivity of the [BMIM][PF6]-based system relative to the [BMIM][Tf2N]-based one, in accordance with the above explanation.
image file: c6ra13061e-f4.tif
Fig. 4 Dependence of specific conductivity on IL type: (image file: c6ra13061e-u3.tif) [BMIM][PF6], (image file: c6ra13061e-u4.tif) [BMIM][Tf2N]; and H2O/(TX-100[thin space (1/6-em)]:[thin space (1/6-em)]BuOH) ratio: 0.05/0.95 (open symbols), 0.15/0.85 (translucent symbols) and 0.25/0.75 (filled symbols), determined at 25 °C. Gaps in the figure result from transitions to multiphase systems.

When we look at the conductivity profiles in Fig. 4, it is clear that for the [BMIM][Tf2N]-based systems, from a medium IL content, the slopes of the dependences are very similar. If the same addition of IL causes a similar increase of conductivity, then the state of the added IL must be similar in each case. The situation is different in the case of the system with [BMIM][PF6]; when the amount of the surfactant decreases, the addition of IL results in a higher conductivity increment. Therefore, at a higher H2O/(TX-100[thin space (1/6-em)]:[thin space (1/6-em)]BuOH) mass ratio, the mobility of the IL is to a lesser extent limited by interactions with the surfactant. However, in systems with [BMIM][Tf2N], at certain IL contents, the increase of conductivity intensifies (this is visible more clearly in Fig. S1) and the profile resembles that in Fig. 2B, where a bicontinuous structure is formed. On the basis of the above reasoning, it can be concluded that, as a result of strong interactions between TX-100 and [BMIM][Tf2N], this IL is able to fulfil the “capacity” of the surfactant for the interactions; hence, above a certain threshold, newly added portions of IL bring a more positive contribution to overall conductivity, as their mobility is not restricted by TX-100. For the same reasons both dependences are close to being parallel. The same cannot be said about [BMIM][PF6] because its weaker interactions with TX-100 keep the surfactant “active” at higher IL content.

On the basis of what has already been said, we can compare and explain the IL contents in the MEs which correspond to the specific conductivity of the pure ILs. Systems with [BMIM][PF6] reach the conductivity of the pure IL at a lower IL content (e.g. for the L85 dilution line, the IL mass fraction is 0.67 in comparison with a 0.89 IL mass fraction determined for [BMIM][Tf2N]). Moreover, both an increase of the water-to-(mixed) surfactant mass ratio and the introduction of butanol lower the corresponding IL content. For example, for the L85 dilution line, the [BMIM][PF6] mass fraction decreases to 0.27 whereas the [BMIM][Tf2N] mass fraction decreases to 0.68 when butanol is added. For the L95 dilution line in the presence of cosurfactant, the corresponding [BMIM][Tf2N] mass fraction was observed to be 0.85.

Due to the stronger interactions of [BMIM] with [PF6] than with the [Tf2N] anion, and to the specific structure of the latter, water imparts the more positive (increasing) contribution to the conductivity of the [BMIM][PF6]-based system. In turn, the surfactant interacts more strongly with [BMIM][Tf2N], which is manifested by the lower conductivity of the ME with this IL in spite of the fact that it has a higher conductivity than [BMIM][PF6] in its pure state. If the positive influence of water is more important for the system with [BMIM][PF6] and the negative contribution of TX-100 is more pronounced for the [BMIM][Tf2N], then the system with [BMIM][PF6] must reach the value of pure IL conductivity at a lower IL content, as is observed.

3.2. UV-Vis spectroscopic studies

Behavior of Co(II) complexes. In order to put forward reasoning regarding the molecular interactions that constitute the background of the observed dependences of transport properties on the system compositions, it is necessary to determine the state of the systems. Indeed, it is not clear whether the IL-rich system with [BMIM][Tf2N] forms a ME, as the formation of micelles of TX-100 in this IL has not yet been proved (in the applied conditions) due to its high solvophilicity. Furthermore, even the maximum water uptake does not guarantee a transition from micelles to ME, in particular when the surfactant content is low. The higher the surfactant content, the higher the probability of formation of a ME.37 Behera et al. developed a very simple, albeit smart, spectrophotometric method that allows for the detection of water pools on the basis of the different absorption ranges of tetra- (blue) and hexa- (pink) coordinated Co(II) complexes, depending on the solubilization environment of water.37

This method allows for confirmation of the presence or absence of water pools, that is, ME formation. The absorbance changes that occur with increasing IL content in the [BMIM][Tf2N] systems are presented in Fig. 5. The results of the absorbance measurements reflect the state of the system and the influence of the composition. If TX-100 does not form micelles in pure [BMIM][Tf2N] but forms a ME in the presence of water, the probable driving factor for the self-assembly is the hydrogen bonding between water and the hydroxyl terminal groups of TX-100, with the water acting like a “glue” that sticks the palisade together.59


image file: c6ra13061e-f5.tif
Fig. 5 (A) Dependence of UV-Vis absorbance of CoCl2 in the H2O/TX-100/[BMIM][Tf2N] ME on the IL mass fraction, determined for the L85 dilution line (TX-100/H2O = 0.85/0.15). (B) Dependence of UV-Vis absorbance on IL content at 512 nm.

Due to the fact that [BMIM][Tf2N] and TX-100 are miscible, an increasing IL content entails gradual dissolution of the self-assemblies, and when the amount of surfactant that constitutes the palisade becomes too little to stabilize the water pool, the ME turns to molecular aggregates. This is a reason for the decrease of the absorption peak corresponding to hexa-coordinated Co(II) ions (around 512 nm) indicating water pools, and the increase of the peak of tetra-coordinated Co(II) species at 635 nm formed with increasing amounts of IL due to the water soluble in solution (Fig. 5). The absorption peaks corresponding to hexa-coordinated Co(II) shift from 509 to 515 nm, when the IL mass fraction increases from 0.05 to 0.45, which indicates a slight change of the state of water in the pools, presumably due to more pronounced interactions with the hydroxyl terminal group. The absorbance at the average of 512 nm decreases linearly up to the 0.5 IL mass fraction (Fig. 5B). Interestingly, even at a very low IL content, the peak corresponding to tetra-coordinated Co(II) is noticeable, but this is not so unexpected if we take into consideration that TX-100 does not self-assemble spontaneously and requires driving by water. Another factor affecting the absorption intensities is the concentration of cobalt cations. When all the cobalt cations are already in the form of Co(H2O)42+, the addition of IL causes no change of distribution that would increase the absorption. Therefore, it is reasonable to presume that after the disappearance of water pools, the absorption in the blue range decreases. Indeed, absorption at wIL equal to 0.95 is lower than that for 0.90, which suggests that a transition to solution occurs.

In Fig. 6, analogous dependences determined for the system with [BMIM][PF6] are presented. The absorption peaks corresponding to hexa-coordinated Co(II) ions are evident up to the 0.60 IL mass fraction, and disappear at IL mass fractions of 0.75 and 0.85. Analogously to the previously described system, absorbance at the IL content equal to 0.85 is higher than that for 0.95, which indicates that the lowering of the CoCl2 concentration exerts a strong impact that change the distribution of water toward bound water. These observations suggest that the transition from ME to micellar solution occurs in the 0.85–0.95 IL content range. It is noteworthy that the conductivity peak appears in this very range, namely at a 0.87 IL mass fraction.


image file: c6ra13061e-f6.tif
Fig. 6 Dependences of UV-Vis absorbance of CoCl2 in the H2O/TX-100/[BMIM][PF6] ME on the IL mass fraction at lower (A), and higher (B), IL content, determined for the L85 dilution line (TX-100/H2O = 0.85/0.15). Instead of water, a 0.5 M aqueous solution of CoCl2 was used.
Influence of the cosurfactant. In the case of the systems with the mixed surfactant TX-100[thin space (1/6-em)]:[thin space (1/6-em)]BuOH, we observe the same tendencies as mentioned above, therefore the dependences are presented as Fig. S3 and S4 in the ESI for systems with [BMIM][PF6] and [BMIM][Tf2N], respectively. In Fig. 7, the visual changes of the system with [BMIM][PF6] are shown.
image file: c6ra13061e-f7.tif
Fig. 7 Visual change of H2O/(TX-100[thin space (1/6-em)]:[thin space (1/6-em)]BuOH)/[BMIM][PF6] along the L85 dilution line. Numbers 1–8 refer to IL contents of 0.05, 0.15, 0.25, 0.45, 0.60, 0.75, 0.85 and 0.95, respectively.

Distinct peaks corresponding to the Co(II) in the water pool are observed up to IL mass fractions of 0.60 and 0.75, but the absorption in this wavelength range disappears at 0.85 and 0.95 IL content, for [BMIM][PF6] and [Tf2N], respectively. Again, this corresponds to the maxima detected in the conductivity measurements that occur at IL mass fractions of 0.76 and 0.87. However, the main focus of this subsection is to indicate how the presence of butanol affects the absorption spectra. An exemplary comparison of the absorption dependences in the presence and absence of butanol is presented in Fig. 8 for the selected systems containing [BMIM][PF6]. In the presence of butanol the absorption intensity of hexa-coordinated Co(II) is lowered, while that of tetra-coordinated Co(II) is increased; hence the partial replacement of TX-100 with butanol favors the occurrence of water in the bound state rather than in the free state, thereby hindering ME formation.


image file: c6ra13061e-f8.tif
Fig. 8 Comparison of the UV-Vis absorption spectra of CoCl2 in the systems with [BMIM][PF6] with and without surfactant. In both cases, the IL mass fraction equals 0.45.

However, in the case of the systems with [BMIM][Tf2N], the effect of butanol is the opposite (Fig. S5). In this regard, the way the cosurfactant affects absorbance is dependent on the IL structure. Therefore, interactions of the IL (especially the anion) with TX-100 and butanol must be of considerable importance. The less water soluble IL, i.e. [BMIM][Tf2N], interacts with TX-100 to a greater extent which results in a stronger incorporation into the palisade layer.35 Additionally, the interactions with butanol are greater in the case of [BMIM][Tf2N], due to the van der Waals interactions (which are stronger in the case of [BMIM][Tf2N]) being more pronounced than the ion–dipole interactions (which are stronger in the case of [BMIM][PF6]).45 Furthermore, the absorption spectrum of CoCl2 in butanol gives a distinct peak at 653 nm (Fig. S6), hence the increase of intensity in this range may result from enhanced interactions with TX-100 and/or butanol. Below, we explain why the effect takes place only in the case of MEs with [BMIM][Tf2N]. The introduction of butanol exerts a positive impact on the solubility of water, especially in the system with [BMIM][PF6]. The higher the solubility, the higher the water uptake required for formation of water pools in a ME, hence at the same water content, more water is dissolved in the continuum or located within the palisade, and thus absorption in the blue range is favored. However, the introduction of butanol also brings a decrease in the concentration of TX-100. Hence, the hydrophobic parts of the surfactant are more distanced, and consequently, the balance of primary and secondary bound water is, to certain extent, shifted towards secondary bound water, which resembles free water more closely than primary bound water (thereby favors hexa-coordinated CoII complex). However, the incorporation of [BMIM][Tf2N] in the palisade certainly reduces this ‘looseness’ to greater extent, than does the incorporation of [BMIM][PF6], due to the much stronger interactions of its [BMIM] with OE units. This explains the difference in the effects caused by butanol. In summary, the presence of butanol intensifies the absorption in the blue range, but the decreased TX-100 content favors absorption in the red range. The kind of IL may determine which factor is predominant. This reasoning is consistent with fundamental knowledge, but the authors realize that it is currently hypothetical and would require sophisticated justification to be proven.

Behavior of methyl orange. UV-Vis absorption spectroscopy is often used in the studies of MEs due to the sensitivity of the maximum absorption wavelength (λmax) of solvatochromic probes to the polarity of their local microenvironment. It is well known that an increase in the polarity of the microenvironment results in a red-shift of λmax of the MO spectrum due to a reduction in the energy level of the excited state accompanying dipole–dipole interactions and hydrogen bonding.44,60 The effect of IL addition to the ME system on the absorption spectra of MO is presented in Fig. 9.
image file: c6ra13061e-f9.tif
Fig. 9 UV-Vis absorption spectra of MO determined for the H2O/TX-100/[BMIM][PF6] ME with various IL contents.

MO was used as the probe due to both its low solubility in water and ILs and its relevant association with OE groups of TX-100.61 It is strongly responsive to polarity changes due to its ionic nature and the presence of many hydrogen bond acceptor sites.44 The λmax of MO in this study was compared to those in bulk water – 464 nm, [BMIM][Tf2N] – 425.5 nm, [BMIM][PF6] – 428 nm and pure TX-100 – 425 nm. The collection of results (Fig. 10) confirms that MO molecules are located in an environment with a polarity lower than that of water and higher than that of TX-100 and the ILs. Interestingly, if the λmax values of MO in the pure components are compared with the dielectric constants of the pure components, it is clear that the decreasing order of dielectric constants, i.e. water > TX-100 > [BMIM][PF6] > [BMIM][Tf2N], is not analogous with the order of λmax, where TX-100 seems less polar than the ILs. However, we have to keep in mind that MO interacts preferentially with the less dipolar milieu of TX-100. This is manifested for example in the higher λmax of MO in aqueous TX-100 micelles after its saturation with [BMIM][PF6];44 the same happens in W/IL-MEs for both studied ILs. As shown in Fig. 10, λmax values are almost unchanged at low and medium IL content, at about 433 nm. At low IL content, water is distributed between the W/IL droplets and continuum that is mainly composed of TX-100. It may be quite surprising that although λmax in both ILs is much lower than 433 nm, the increase in IL content does not entail lowering of λmax. In turn, when the IL content is increased above 0.7–0.8, λmax shifts from close to 433 nm to a shorter wavelength (down to the values for the ILs). If the polarity microenvironment of MO (that is mostly associated with TX-100) changes so much, it is reasonable to presume that a microstructural transition occurs. Due to the facts that the solubility of water in the ILs used in this study is low and that the ILs are miscible with TX-100, an increase of the IL content probably causes the thickness of the surfactant palisade to lower. Moreover, as the concentration of water decreases with the addition of IL, relatively more water in the self-assembly is associated with the TX-100. As stated above, the IL reduces the hydrophobic effect of the apolar TX-100 tail, within which the MO is located. These factors seem to balance the addition of the component in which λmax is lower.


image file: c6ra13061e-f10.tif
Fig. 10 Dependences of the maximum UV-Vis absorption wavelength of MO dissolved in MEs at the IL content for L85 dilution lines. (A) Represents [BMIM][PF6]-based MEs with (image file: c6ra13061e-u5.tif) and without (image file: c6ra13061e-u6.tif) cosurfactant; (B) represents [BMIM][Tf2N]-based MEs with (image file: c6ra13061e-u7.tif) and without (image file: c6ra13061e-u8.tif) cosurfactant.

In order to explain the rapid fall of λmax at higher IL content, we have to take into consideration that the distribution of water within the polar domain of TX-100 is non-uniform. The MO probes the region of poly(OE) chains far from the terminal hydroxyl group.62 Therefore, the polarity of the microenvironment of MO in the palisade is not greatly affected by the changes in the water pool that exert an impact on the OE units mostly in the vicinity of terminal hydroxyl. As shown in the analysis of the absorption spectra of CoCl2, when the IL content increases, the water pool diminishes, so as to eventually disappear. The same happens to the water bound to OE units, resulting in lower hydration. This makes room for weaker interactions of IL with OE units and results in the lower polarity of the palisade, which manifests in lowering the λmax.

When the system exists in the micellar solution state, the λmax should take a value in-between that of the ME and the real solution, since in micellar solution both aggregates and dissolved TX-100 are present and their relative amounts are much dependent on the IL content. Therefore, after the transition to the micellar solution state, the relatively rapid decrease of λmax is conjectured. This is in good agreement with the conductivity results, where a transition to a micellar solution was thought to be indicated by the maximum. It was also observed that λmax is slightly lower for the [BMIM][Tf2N] system without cosurfactant in the whole IL content range (Fig. S7). [BMIM][Tf2N] is a less polar IL, hence the λmax is lower than in the corresponding system with [BMIM][PF6], especially if we take into consideration the stronger interactions of the former IL with the OE units of TX-100. However, in the presence of butanol, λmax is initially higher, but eventually much lower than in the system with [BMIM][Tf2N] (Fig. S7). That result shows that the reasoning above cannot be generalized to systems with additives, although the general principles remain the same. In the presence of butanol, the interfacial film is non-uniform and composed of alcohol, surfactant molecules (which differ greatly in length and the proportion of their hydrophilic and hydrophobic parts63) as well as ILs. It is reasonable to conclude that molecules of TX-100 are much less firmly packed (due to partial replacement of TX-100 with butanol). As mentioned above, association of MO with OE groups takes place far from the terminal hydroxyl. This may have two consequences, explaining the observed dependences. Firstly, to a certain extent, the alkyl chain of butanol hinders hydration of the OE units closer to the terminal hydroxyl. Hence the excessive water molecules can hydrate farther units, making the microenvironment more polar. Secondly, less firm packaging means a higher availability of the farther units for interactions with the IL – especially [BMIM][Tf2N], which interacts more strongly than [BMIM][PF6] – and reduces the hydrophobic effect of the apolar tail of TX-100, as mentioned before. It is therefore vital to differentiate between the two directions in which IL affects the λmax in the solution and in the ME range.

3.3. FTIR spectroscopic studies

The FTIR spectra of the H2O/TX-100/[BMIM][PF6] and H2O/TX-100/[BMIM][Tf2N] ME systems along their L85 dilution lines as a function of IL content were also investigated (Fig. 11 and S8, respectively). Many of the characteristic bands of [BMIM]-based ILs are shielded by TX-100, however, the C–H stretching vibrations from the C(2) carbon atom as well as symmetric and asymmetric C(4) and C(5) stretches in the 1-butyl-3-methylimidazolium ring were clearly observed as bands above 3000 cm−1. For pure [BMIM][Tf2N], these characteristic bands were detected at around 3098, 3117 and 3154 cm−1, and for pure [PF6]-based IL only C(4) and C(5) stretching bands were observed at 3123 and 3167 cm−1. These bands were hard to see for ME systems containing IL mass fractions below 0.25, however, they appeared with increasing IL content and were accompanied by movements towards lower wavenumbers due to hydrogen bond formation between the ILs and the TX-100 surfactant.
image file: c6ra13061e-f11.tif
Fig. 11 FTIR spectra of the H2O/TX-100/[BMIM][PF6] ME at IL contents of 0.05, 0.15, 0.25, 0.45, 0.60, 0.75 and 0.85.

Interestingly, the intensity of the bands determined for the ME samples at IL mass fractions exceeding 0.75 are higher than the intensity of the pure [BMIM][Tf2N] and [BMIM][PF6] salts. This may indicate the occurrence of interactions favoring the stretching vibrations that can be ascribed to the presence of water in the IL continuum, and may be seen when the influence of the IL content on the intensity of the absorption in the ME is less important than that of the presence of water in the continuum. It is reasonable that this could occur in the range of micellar/real solutions and not in the IL-ME. Moreover, a weak band at about 3488 cm−1, which is due to O–H stretching vibrations of the hydroxyl groups in the TX-100 surfactant, shifts to lower wavenumbers, widens and weakens in intensity with increasing [BMIM][Tf2N] content, indicating intermolecular hydrogen bonding interactions between the [Tf2N] anion and the hydrogen atom from the hydroxyl group.64 In comparison, for [BMIM][PF6]-based MEs, a shift towards higher wavenumbers was observed. That also justifies the previous observation of enhanced solubility of [BMIM][Tf2N] in the TX-100/H2O system in comparison with that of [BMIM][PF6]. A band at 1100 cm−1, attributed to the C–O–C stretching vibration of the OE unit in pure TX-100, also gradually decreases with the addition of ME components and shifts to a lower frequency region for both ILs, reaching 1095 cm−1 for [BMIM][PF6] and even disappearing in the case of [BMIM][Tf2N]. This may be related to the stronger interaction of TX-100 OE units with the latter. Moreover, there is a shift of the peaks in the range 3000–2800 cm−1; the two maxima for pure TX-100, at 2948 and 2867 cm−1 move to a higher frequency region (to 2953 and 2876 cm−1 for the [BMIM][Tf2N] system and 2958 and 2875 cm−1 for [BMIM][PF6]) which may also suggest that there are interactions between the surfactant and IL, resulting in an increase of the electronegativity of the adjacent oxygen atoms.64

FTIR spectroscopy is also used to demonstrate the existence of water pools in W/IL MEs. It is a powerful tool used to determine the state of solubilized water in MEs, therefore providing structural information on the aqueous systems. Generally, three distinct states of water molecules solubilized in ME systems can be distinguished: bulk water (solubilized in the core of the ME droplets and interacting with each other, designated also as free water or water pools); bound water (interacting by hydrogen bonds with polar groups of the surfactants); and trapped water (water molecules trapped between alkyl chains of surfactant at the interface or molecules dissolved in a bulk oil phase).65 However, water exhibits a broad absorption band centered at 3450 cm−1 (bending and stretching vibrations) which overlaps with an absorption band of TX-100. Therefore, to eliminate spectral interferences, water in the IL-MEs was substituted by D2O.33,66 Instead of the wide band at around 3450 cm−1, the FTIR spectrum of D2O exhibits a complex band in the region of 2700–2150 cm−1 with a center at about 2471 cm−1 (the bending vibration involving the D–O–D angle) and two shoulders near to 2500 cm−1 (symmetrical stretching vibrations of the O–D bond) and 2600 cm−1 (asymmetrical stretching vibrations of the O–D bond).

Moreover, the D2O spectrum shows a bending vibration at 1204 cm−1 and a weak peak coming from the combination of bending and libration vibrations at 1550 cm−1. In D2O, a weak band at 3404 cm−1 can also be present due to O–H stretching vibrations of water impurities,67 however, in our study such a peak was not observed. It was found that the intensity of all peaks characteristic of D2O significantly diminished with increasing IL content in the samples (thus decreasing D2O content). The FTIR absorbance spectra of the [BMIM][Tf2N]-based ME without addition of butanol, with different IL contents is depicted in Fig. S8. It shows a reduction and shift of the broad band (O–D stretching mode with a center at around 2471 cm−1) towards the higher frequency region (to 2537 cm−1 and 2558 cm−1 for [BMIM][Tf2N] and [BMIM][PF6], respectively) that results from the decrease of D2O content in the ME system and the water pools' diminishment.66,68 This band was not visible in the ME at IL contents above 0.85, confirming the lack of water molecules in the free state and therefore the transition to other states of water.

The clear bands in the range 2400–2700 cm−1 indicating the presence of water pools in the ME were observed for the analogous systems with butanol. Spectra also revealed the shift of the D2O main absorption band to 2534 cm−1 for D2O/(TX-100[thin space (1/6-em)]:[thin space (1/6-em)]BuOH)/[BMIM][Tf2N] and 2526 cm−1 for D2O/(TX-100[thin space (1/6-em)]:[thin space (1/6-em)]BuOH)/[BMIM][PF6]. Inspection of the diagrams reveals several additional issues. For systems without cosurfactant, the high frequency O–H stretching band of TX-100 hydroxyl terminals near 3500 cm−1 is much more intense and broad for [BMIM][Tf2N] than for [BMIM][PF6] ME systems. However, as the IL content increases, the differences tend to vanish. In turn, for systems with butanol (Fig. S9 and S10) the breadths of the bands are similar to one another, but the intensity of the band in [BMIM][Tf2N] is still higher. These observations accompanied by the abovementioned reasoning can be explained by the different distributions of water between free and bound states. It is well known that water in the nanopool (bulk) state exhibits a broad characteristic O–D stretching band due to the hydrogen bonding environment.68 Hence, the lesser the incorporation of water into the palisade and thus the higher the proportion of water in the water pools, the broader the band. For both ILs at very low IL contents (0.05 and 0.15), the O–D stretching band is narrower and less intense in the presence of butanol, and at slightly higher IL contents (0.25 and 0.45), the opposite is true. If [BMIM][Tf2N] is more easily incorporated in the palisade layer and is less polar, we can conclude that water will be harder to incorporate into the interface layer. Hence, more water will be present in the nanopool state. This reasoning is in agreement with experimental data, where the characteristic O–D band is more intense for the system with [BMIM][Tf2N] than for that with [BMIM][PF6] (Fig. S8–S10 and 11).

3.4. Dynamic viscosity

Systems without cosurfactant. Viscosity values of pure [BMIM][PF6] and TX-100 were measured as 272 and 268 mPa s, respectively, in agreement with literature data.69 Binary systems, in turn, are characterized by significantly higher viscosities (Table 2), which presumably result mainly from dipole–dipole interactions between water and the OE groups of TX-100, ion–dipole interactions between [BMIM] and OE groups and π–π interactions between the imidazolium ring of [BMIM] and the benzene ring of TX-100.
Table 2 Experimental viscosity values [mPa s] of the binary systems IL/TX-100 and H2O/TX-100
System Component weight ratio
0.05[thin space (1/6-em)]:[thin space (1/6-em)]0.95 0.15[thin space (1/6-em)]:[thin space (1/6-em)]0.85
[BMIM][PF6]/TX-100 368.0 527.1
[BMIM][Tf2N]/TX-100 314.4 355.2
H2O/TX-100 302.7 312.9


The dependence of the H2O/TX-100/[BMIM][PF6] system on the dynamic viscosity determined for two water-to-surfactant mass ratios is presented in Fig. 12A. An elaboration of these dependences is not simple, as the juxtaposition is dissimilar to any dependence presented earlier. The most crucial difference between the dependences presented in Fig. 12A is that at the 0.05/0.95H2O/TX-100 mass ratio, viscosity values of the [BMIM][PF6] MEs are higher than that of the pure IL across the whole range of concentrations. Different behavior was observed for the 0.15/0.85 mass ratio, where a minimum was detected at wIL ca. 0.75.


image file: c6ra13061e-f12.tif
Fig. 12 Viscosity dependence of the H2O/TX-100/[BMIM][PF6] system (A), and H2O/TX-100/[BMIM][Tf2N] system (B), on IL content at different H2O/TX-100 mass ratios: (image file: c6ra13061e-u9.tif) 0.05/0.95 (L95 dilution line), (image file: c6ra13061e-u10.tif) 0.15/0.85 (L85 dilution line), determined at 25 °C.

Both dependences presented in Fig. 12A refer to qualitatively the same ME system, therefore the increase of viscosity observed for the 0.05/0.95 mass ratio and the decrease in the case of the 0.15/0.85 mass ratio allow us to conclude that two phenomena influencing viscosity may exist. Firstly, lower permittivity of the system favors ion pairing57 in the IL resulting in an increase of the viscosity values. Additionally, the abovementioned interactions between the IL and TX-100 result in a viscosity increase. Since the interactions of the OE groups of TX-100 with water molecules are much stronger than with [BMIM] cations,38 a lower amount of water facilitates TX-100–[BMIM][PF6] interactions. The ME system described by the dilution line L95 contains less water, thus the viscosity-increasing effect is probably more pronounced in this system.

Another factor affecting viscosity is the increasing amount of IL component with lower viscosity that may result in a decreasing trend of this parameter (TX-100 becomes less available for interactions with the IL). However, due to the fact that at higher IL/TX-100 mass ratios, the viscosity is higher (Table 2), it is also reasonable to conclude that addition of the IL to the H2O/TX-100 mixture may initially result in an increase of the ME viscosity. This was, indeed, observed for the L95 dilution line, whereas not for the L85, where this initial increase is virtually insignificant and the viscosity of the system very quickly goes down below the viscosity of the H2O/TX-100 binary mixture and then even below that of the pure IL. Therefore, in this system the viscosity-increasing contribution of a newly added portion of IL predominates across the whole IL content range.

Analogous dependences for systems with the IL [BMIM][Tf2N] are presented in Fig. 12B. Although this juxtaposition – at first sight – does differ from the previous one, essentially, we can observe the same tendencies, but with different intensities. For this IL, a decrease of permittivity (with the lowering of water concentration), contrary to that of the [BMIM][PF6]-based system, does not lead to an increase of viscosity, presumably due to the ion pairing in [BMIM][Tf2N] being definitely lower than that for [BMIM][PF6]. This results from the greater delocalization of the [Tf2N] charge and manifests in its more than 2.5-fold higher specific conductivity. In Table 2 we can observe that the viscosities of the binary systems H2O/TX-100 and TX-100/[BMIM][Tf2N] are quite close to each other. It seems that within the framework of “capacity” of TX-100 for interactions with water and the IL, addition of the latter should initially result in a relatively constant value of viscosity. After reaching the capacity limit, newly added free IL should lead to the system reaching the viscosity of pure [BMIM][Tf2N]. All this is observed in Fig. 12B. It is quite surprising that for a H2O/TX-100 mass ratio equal to 0.15/0.85, the abovementioned “capacity” of TX-100 for interaction with the IL was not detected; only a decrease of the viscosity was observed. A possible reason for this may be that [BMIM][Tf2N] is much more effective in preventing liquid crystalline structure formation, which is a driving force of the generally high viscosity of TX-100 in water mixtures.32,35 Moreover, the formation of a viscous structure of TX-100 and [BMIM][Tf2N] may be hindered at higher water content (L85).

Systems with cosurfactant. In Table 3, viscosities of the pseudo-binary systems containing butanol, analogous to those in Table 2, are presented. As can be seen, addition of the IL or water affects the viscosity of these systems to a definitely lesser extent than in the case of the systems without butanol. This may result from the presence of butanol molecules between TX-100 chains, which hinders the formation of a hydrogen bonding network25 bridging the IL and TX-100. The reasons for the decreasing of viscosity caused by cosurfactant have already been discussed above.
Table 3 Experimental dynamic viscosity values [mPa s] determined for the pseudo-binary systems IL/(TX-100[thin space (1/6-em)]:[thin space (1/6-em)]BuOH) and H2O/(TX-100[thin space (1/6-em)]:[thin space (1/6-em)]BuOH)
System Component mass ratio
0.05/0.95 0.15/0.85
[BMIM][PF6]/(TX-100[thin space (1/6-em)]:[thin space (1/6-em)]BuOH) 28.6 37.5
[BMIM][Tf2N]/(TX-100[thin space (1/6-em)]:[thin space (1/6-em)]BuOH) 28.2 31.6
H2O/(TX-100[thin space (1/6-em)]:[thin space (1/6-em)]BuOH) 27.2 27.1


The viscosity dependences of the systems with [BMIM][PF6] and [BMIM][Tf2N] on the IL content in the presence of cosurfactant are shown in Fig. 13A and B. For H2O/(TX-100[thin space (1/6-em)]:[thin space (1/6-em)]BuOH)/[BMIM][PF6] systems, it is clear that addition of the IL initially brings a minor increase in viscosity, which intensifies at higher IL content. It is to be noted that such a profile is not specific to these systems, but is similar to the viscosity dependence of other imidazolium ILs (e.g. binary mixtures of 1-ethyl-3-methylimidazolium tetrafluoroborate or 1-methyl-3-propylimidazolium bromide)50 with water. It seems that the presence of butanol induces a more solution-like character in the system. Increasing the amount of IL (the component with higher viscosity) results in increasing values of the viscosity of the system (TX-100 becomes less available for interactions with the IL). If IL–TX-100 interactions are substantially hindered, the key factor in the viscosity increase is the IL–IL interactions, and new portions of IL can induce these only at higher IL content.


image file: c6ra13061e-f13.tif
Fig. 13 Dynamic viscosities of H2O/(TX-100[thin space (1/6-em)]:[thin space (1/6-em)]BuOH)/IL systems as a function of IL content at different H2O/(TX-100[thin space (1/6-em)]:[thin space (1/6-em)]BuOH) mass ratios, determined at 25 °C: (image file: c6ra13061e-u11.tif) 0.05/0.95 for [BMIM][PF6], (image file: c6ra13061e-u12.tif) 0.15/0.85 for [BMIM][PF6], (image file: c6ra13061e-u13.tif) 0.05[thin space (1/6-em)]:[thin space (1/6-em)]0.95 for [BMIM][Tf2N] and (image file: c6ra13061e-u14.tif) 0.15[thin space (1/6-em)]:[thin space (1/6-em)]0.85 for [BMIM][Tf2N]. The left y-axis refers to the [BMIM][PF6]-based system; the right y-axis refers to the [BMIM][Tf2N]-based system.

The behavior of the system H2O/(TX-100[thin space (1/6-em)]:[thin space (1/6-em)]BuOH)/[BMIM][Tf2N] at a water-to-mixed surfactant mass ratio equal to 0.15/0.85 (L85 dilution line) is very similar to that with [BMIM][PF6]. However, at a lower water content (L95 dilution line), its behavior is analogous to that presented for the system without butanol in Fig. 12A, and the previous conclusions remain in force. At the lower water content (L95), a lower amount of TX-100 participates in the formation of the interfacial layer, and more is contained in the continuum. Hence, the TX-100–IL interactions in the continuum are more significant. Due to the fact that [BMIM][Tf2N] interacts with the OE units of TX-100 more strongly than does [BMIM][PF6],35 in spite of the presence of butanol, the occurrence of the effect described for Fig. 12A may also be possible to some extent, i.e. the interaction of IL with TX-100 increases viscosity. From the four studied systems presented in Fig. 13, this effect most probably exists only in the case of [BMIM][Tf2N] at a 0.05/0.95 ratio where there are stronger interactions of IL with TX-100 and a higher content of TX-100 in the continuum.

3.5. Cyclic voltammetry measurements

Cyclic voltammetry was used to characterize the structural transitions in the IL-based ME systems via determination of the apparent diffusion coefficients of an electroactive probe. Water-soluble K3Fe(CN)6 was selected as the electroactive compound. We used the same methodology as in our previous paper,35 described briefly herein for clarity.

In this method, the peak current of the diffusion-controlled electrode reaction is proportional to the square root of the sweep rate (i.e. it is linearly dependent and passes through the origin) and the potential (at current peak) is independent of the sweep rate. Since our results revealed a potential shift with sweep rate, the diffusion coefficients were calculated using the modified Randles–Sevcik equation for irreversible and quasi-reversible systems:70

image file: c6ra13061e-t1.tif
where: Ip is the peak current for a redox-active quasi-reversible system [A], n is the number of electrons involved in the electrochemical reaction, F is Faraday constant, C is the concentration of the electroactive probe [mol cm−3], A is the area of the working electrode [cm2], D is the (apparent) diffusion coefficient of the electroactive probe [cm2 s−1], ν is the sweep rate [V s−1], T is the absolute temperature, and R is the gas constant. In turn, α is the transfer coefficient and is a measure of the symmetry barrier in a non-reversible electrode process, and nα is the number of electrons involved in the rate-determining step. Contrary to reversible systems, the potential corresponding to the current peak is dependent on the sweep rate and shifts −30/(nα × α) for each 10-fold increase of sweep rate (at 25 °C).71 Hence, the product nα × α can be determined from the slope of the dependence of potential (at current peak) on the logarithm of sweep rate.

In Fig. 14A–C, exemplary experimental results determined for the [BMIM][PF]-based system at different scan rates, as well as a representative plot of the anodic peak current Ip versus ν1/2, and potential at current peak versus log[thin space (1/6-em)]ν are given. The apparent diffusion coefficients of the electroactive probe in the IL dispersion systems at different IL mass fractions were determined based on a linear regression of the slope of that relationship.


image file: c6ra13061e-f14.tif
Fig. 14 (A) Exemplary cyclic voltammogram of K3Fe(CN)6 determined at 25 °C for the H2O/TX-100/[BMIM][PF6] ME for the L85 dilution line at a 0.40 [BMIM][PF6] mass fraction. Particular curves refer to various sweep rates from 25 mV s−1 to 150 mV s−1. (B) Representative plot of peak current Ip versus ν1/2. (C) Dependence of potential at current peak on log[thin space (1/6-em)]ν.

The dependence of the apparent diffusion coefficients on the IL content obtained for the H2O/(TX-100[thin space (1/6-em)]:[thin space (1/6-em)]BuOH)/[BMIM][PF6] system for the 0.85 dilution line is presented in Fig. 15A. If we compare these results with the viscosity dependence (Fig. 13), we find that the profiles of both dependences are quite similar. This may be surprising if we take into consideration that the dynamic viscosity and diffusion coefficient are connected by Stokes in inverse proportion, which – at first sight – is inconsistent with our experimental data. This inconsistency appears if we do not take into consideration that the hydrodynamic diameter of the electroactive probe domain is not constant, as revealed by spectrophotometric measurements with CoCl2 as the absorption probe. From an inspection of the profile shown in Fig. 15A, we can conclude that above wIL ca. 0.7–0.8, where a significant increase in apparent diffusion coefficient is observed, the hydrodynamic diameter of the electroactive probe domain decreases drastically. This is confirmed by conductivity data, where, in this very range, a transition from W/IL to a micellar solution occurs, and the electroactive probe is no longer migrating enclosed in dispersed droplets of perhaps 100 nm in size.37 Therefore it is no longer limited by droplet diffusion, but exists in a micellar or real solution.


image file: c6ra13061e-f15.tif
Fig. 15 (A) Apparent diffusion coefficient of the H2O/(TX-100[thin space (1/6-em)]:[thin space (1/6-em)]BuOH)/[BMIM][PF6] system at a 0.15/0.85 H2O/(TX-100[thin space (1/6-em)]:[thin space (1/6-em)]BuOH) mass ratio as a function of IL content, determined at 25 °C. (B) Apparent diffusion coefficient of the H2O/(TX-100[thin space (1/6-em)]:[thin space (1/6-em)]BuOH)/IL system at a 0.15/0.85 mass ratio as a function of (image file: c6ra13061e-u15.tif) [BMIM][Tf2N] and (image file: c6ra13061e-u16.tif) [BMIM][PF6] mass fractions, determined at 25 °C.

In Fig. 15B the analogous dependence of apparent diffusion coefficient determined for the H2O/(TX-100[thin space (1/6-em)]:[thin space (1/6-em)]BuOH)/[BMIM][Tf2N] system is presented. We found it impossible to measure apparent diffusion coefficients of the H2O/(TX-100[thin space (1/6-em)]:[thin space (1/6-em)]BuOH)/[BMIM][Tf2N] system along the entire titration line with IL; similarly to Fu et al.,51 we found that the application of the Randles–Sevcik equation to obtain apparent diffusion coefficients of K3Fe(CN)6 was not possible, as the current peaks were not linearly dependent on the square root of the sweep rate. When we collate the diffusion coefficient dependence with the corresponding conductivity dependence (Fig. 3 and S1), it can be stated that the increase of apparent diffusion coefficient agrees well with the increase of conductivity slope, which has been already ascribed to the newly added portions of the IL. At the same time, the viscosity of the systems also increases, as shown in Fig. 13, which is presumably also related to the decrease of the hydrodynamic diameter of the electroactive probe domain. Behera et al.37 observed that the diameter of W/IL droplets increases linearly with an increase of water-to-surfactant ratio. Admittedly, in the present study, the overall water-to-surfactant ratio is constant, but this observation can still be useful if we take into consideration the change of distribution of surfactant between the IL continuum and palisade. The solubility of TX-100 in both ILs is definitely higher (they are miscible) than the solubility of water and butanol therein. Therefore, it is reasonable to presume that addition of IL entails transfer of surfactant aggregates to the IL continuum, making the interfacial layer thinner, and thereby the self-assembly less voluminous. However, this transfer can be of higher importance only after the abovementioned fulfillment of TX-100 for interactions with IL in the continuum, i.e. in the case of [BMIM][Tf2N] and not [BMIM][PF6]. Although we were not able to determine the size of water droplets by dynamic light scattering, as the presence of a high amount of surfactant in the continuum makes it problematic to set proper physical constants of the continuum in the experimental software, the agreement of the above justifications with both conductivity and apparent diffusion coefficient data makes them much more than mere speculation.

When we compare the above dependences in the available IL content range (Fig. 15B), a few peculiarities can be observed. In this range, apparent diffusion coefficients in the system with [BMIM][PF6] are higher than those in the system with [BMIM][Tf2N]. Specific conductivity is also slightly higher (Fig. 4), however, only the former system is characterized by significantly higher viscosity. Admittedly, it is not a new finding that in IL-MEs, viscosity and conductivity may follow the same (increasing or decreasing) trend – when titrated with water, the formation of a bicontinuous structure favored charge transfer in spite of increasing viscosity.35 However, in this case, we consider the W/IL structure, so this explanation is not in force. The system with the less-conducting IL and higher overall viscosity is characterized by higher diffusion and specific conductivity. In turn, higher diffusion coefficients could result from a lower W/IL droplet size.

4. Conclusions

In this work, the transport properties of four aqueous imidazolium IL-MEs, varying by anion type, and by the presence or absence of cosurfactant, were determined as a function of IL content. The maximum conductivity measurements resulted from a balance between the number of IL species and the degree of ion pairing, and the changes of viscosity. Introduction of the cosurfactant exerted a much more pronounced effect on the specific conductivity of the system with [BMIM][PF6] (which displayed higher maximum conductivity) than that with [BMIM][Tf2N], due to the way in which the interactions between the anion and water/butanol affected the hydrogen bonding between the anion and the C2-hydrogen of the imidazolium ring. Moreover, the conductivity of the ME systems exceeded the conductivity of the pure ILs, which we can assign to the lowering of ion pairing by water and/or butanol molecules present in the continuous phase. The presence of water pools, and therefore the formation of the W/IL-MEs, was confirmed by UV-Vis and FTIR spectroscopy. The size of the water pools diminished when the IL content increased, as revealed by the analysis of CoCl2 absorption spectra. The presence of butanol favored the occurrence of water in the bound state rather than the free state, facilitating ME formation. In this regard, the way in which the cosurfactant affects absorbance is dependent on the IL type present in the system. The dynamic viscosity dependence on ILs is quite complex and varies with water-to-surfactant mass ratio. Cyclic voltammetry measurements enabled the identification of the structural transformations which occurred since the apparent diffusion coefficients significantly increased due to the formation of micellar solutions in the ILs and their further dilution. Moreover, the apparent diffusion coefficients of the system containing [BMIM][PF6] were found to be higher than those in the system with [BMIM][Tf2N]. In summary, the ME system containing [BMIM][PF6], the less-conducting and more viscous IL, is characterized by higher diffusion and specific conductivity. These comparative studies give us better phenomenological insight into the transport properties of IL-MEs and better prospects for optimizing IL-ME components of choice.

These studies did not aim to identify the optimum kind and amount of additive, so as to get the best transport properties with minimal environmental impact. They are a part of a very broad, but almost untouched issue in the field of IL-MEs, namely how to predict the properties of ternary- or pseudo-ternary systems on the basis of the properties of individual components, where the simple comparison of the properties of the ILs is not enough. It seems essential, if IL-MEs are ever to leave laboratories, that the choice of ME components, e.g. for nanoparticles synthesis or biocatalysis, is preceded by reasonable analysis. Another issue that is worth further exploration is the action of water in enabling the formation of a ME in the system, with a surfactant that does not self-assemble in the specific IL in the applied conditions. The authors have not found any literature reports about this issue.

Acknowledgements

The authors acknowledge funding from the National Science Center (contract no. 2012/05/B/ST4/02023).

References

  1. J. S. Wilkes and M. J. Zaworotko, J. Chem. Soc., Chem. Commun., 1992, 965–967 RSC.
  2. A. Berthod, M. J. Ruiz-Ángel and S. Carda-Broch, J. Chromatogr. A, 2008, 1184, 6–18 CrossRef CAS PubMed.
  3. J. Łuczak, M. Paszkiewicz, A. Krukowska, A. Malankowska and A. Zaleska-Medynska, Adv. Colloid Interface Sci., 2016, 230, 13–28 CrossRef PubMed.
  4. T. Welton, Coord. Chem. Rev., 2004, 248, 2459–2477 CrossRef CAS.
  5. K. Huang, X.-M. Zhang, Y.-X. Li, Y.-T. Wu and X.-B. Hu, J. Membr. Sci., 2014, 471, 227–236 CrossRef CAS.
  6. S. Zhang, J. Sun, X. Zhang, J. Xin, Q. Miao and J. Wang, Chem. Soc. Rev., 2014, 43, 7838–7869 RSC.
  7. S. P. Moulik and A. K. Rakshit, J. Surf. Sci. Technol., 2006, 22, 159–186 CAS.
  8. A. Bhattacharyya and J. F. Argillier, J. Surf. Sci. Technol., 2005, 21, 161–168 CAS.
  9. C. Boned and J. Peyrelasse, J. Surf. Sci. Technol., 1991, 7, 1–31 CAS.
  10. S. Ray, S. Bisal and S. P. Moulik, J. Surf. Sci. Technol., 1992, 8, 191–208 CAS.
  11. K. Holmberg, J. Surf. Sci. Technol., 1989, 5, 209–222 CAS.
  12. S. R. Bisal, P. K. Bhattacharya and S. P. Moulik, J. Surf. Sci. Technol., 1988, 4, 121–138 CAS.
  13. S. Ajith and A. K. Rakshit, J. Surf. Sci. Technol., 1992, 8, 365–372 CAS.
  14. J. S. Huang, J. Surf. Sci. Technol., 1989, 5, 83–131 CAS.
  15. H. F. Eicke, C. Quellet and G. Xu, J. Surf. Sci. Technol., 1988, 4, 111–120 CAS.
  16. S. Das, I. Mukherjee, P. K. Paul and S. Ghosh, Langmuir, 2014, 30, 12483–12493 CrossRef CAS PubMed.
  17. H. Sirén, S. Vesanen and S. J. Suomi, J. Chromatogr. B, 2014, 945–946, 199–206 CrossRef PubMed.
  18. K. Margulis-Goshen and S. Magdassi, Curr. Opin. Colloid Interface Sci., 2012, 17, 290–296 CrossRef CAS.
  19. M. Sanchez-Dominguez, K. Pemartin and M. Boutonnet, Curr. Opin. Colloid Interface Sci., 2012, 17, 297–305 CrossRef CAS.
  20. I. Mukherjee, G. Dinda, S. Ghosh and S. P. Moulik, J. Nanopart. Res., 2012, 14, 1–14 Search PubMed.
  21. J. M. O'Donnell, Chem. Soc. Rev., 2012, 41, 3061–3076 RSC.
  22. O. Zech, A. Harrar and W. Kunz, Nonaqueous Microemulsions Containing Ionic Liquids – Properties and Applications, InTech, 2011 Search PubMed.
  23. Y. Gao, S. Wang, L. Zheng, S. Han, X. Zhang, D. Lu, L. Yu, Y. Ji and G. J. Zhang, J. Colloid Interface Sci., 2006, 301, 612–616 CrossRef CAS PubMed.
  24. H. Gao, J. Li Han, W. Chen, J. Zhang, R. Zhang and D. Yan, Phys. Chem. Chem. Phys., 2004, 6, 2914–2916 RSC.
  25. Y. Gao, N. Li, L. Zheng, X. Bai, L. Yu, X. Zhao, J. Zhang, M. Zhao and Z. Li, J. Phys. Chem. B, 2007, 111, 2506–2513 CrossRef CAS PubMed.
  26. Y. Gao, J. Zhang, H. Xu, X. Zhao, L. Zheng, X. Li and L. Yu, ChemPhysChem, 2006, 7, 1554–1561 CrossRef CAS PubMed.
  27. N. Li, Y. Gao, L. Zheng, J. Zhang, L. Yu and X. Li, Langmuir, 2007, 23, 1091–1097 CrossRef CAS PubMed.
  28. I. Mukherjee, S. Mukherjee, B. Naskar, S. Ghosh and S. P. Moulik, J. Colloid Interface Sci., 2013, 395, 135–144 CrossRef CAS PubMed.
  29. W. Kunz, T. Zemb and A. Harrar, Curr. Opin. Colloid Interface Sci., 2012, 17, 205–211 CrossRef CAS.
  30. Y. Gao, N. Li, L. Zheng, X. Zhao, S. Zhang, B. Han, W. Hou and G. Li, Green Chem., 2006, 8, 43–49 RSC.
  31. Y. Gao, S. Han, B. Han, G. Li, D. Shen, Z. Li, J. Du, W. Hou and G. Zhang, Langmuir, 2005, 21, 5681–5684 CrossRef CAS PubMed.
  32. J. Łuczak and J. Hupka, J. Mol. Liq., 2014, 199, 552–558 CrossRef.
  33. R. Rai and S. Pandey, Langmuir, 2014, 30, 10156–10160 CrossRef CAS PubMed.
  34. F. Yan and J. Texter, Chem. Commun., 2006, 2696–2698 RSC.
  35. J. Piekart and J. Łuczak, Soft Matter, 2015, 11, 8992–9008 RSC.
  36. T. Kusano, K. Fujii, K. Hashimoto and M. Shibayama, Langmuir, 2014, 30, 11890–11896 CrossRef CAS PubMed.
  37. K. Behera, N. I. Malek and S. Pandey, ChemPhysChem, 2009, 10, 3204–3208 CrossRef CAS PubMed.
  38. Y. Lian and K. Zhao, Soft Matter, 2011, 7, 8828–8837 RSC.
  39. Z. Qiu and J. Texter, Curr. Opin. Colloid Interface Sci., 2008, 13, 252–262 CrossRef CAS.
  40. S. K. Mehta and K. Kaur, Indian J. Chem., Sect. A: Inorg., Bio-inorg., Phys., Theor. Anal. Chem., 2010, 49, 662–684 Search PubMed.
  41. J. Łuczak, M. Paszkiewicz, A. Krukowska, A. Malankowska and A. Zaleska-Medynska, Adv. Colloid Interface Sci., 2016, 227, 1–52 CrossRef PubMed.
  42. M. Moniruzzaman, K. Nakashima, N. Kamiya and M. Goto, Biochem. Eng. J., 2010, 48, 295–314 CrossRef CAS.
  43. A. Serrà, E. Gómez, J. F. López-Barbera, J. Nogués and E. Vallés, ACS Nano, 2014, 8, 4630–4639 CrossRef PubMed.
  44. K. Behera, P. Dahiya and S. J. Pandey, J. Colloid Interface Sci., 2007, 307, 235–245 CrossRef CAS PubMed.
  45. J. M. Crosthwaite, S. N. Aki, E. J. Maginn and J. F. Brennecke, J. Phys. Chem. B, 2004, 108, 5113–5119 CrossRef CAS.
  46. J. Łuczak, A. Latowska and J. Hupka, Colloids Surf., A, 2015, 471, 26–37 CrossRef.
  47. A. Selwent and J. Łuczak, J. Mol. Liq., 2016, 221, 557–566 CrossRef CAS.
  48. N. Li, S. Zhang, H. Ma and L. Zheng, Langmuir, 2010, 26, 9315–9320 CrossRef CAS PubMed.
  49. C. Rabe and J. Koetz, Colloids Surf., A, 2010, 354, 261–267 CrossRef CAS.
  50. A. Jarosik, S. R. Krajewski, A. Lewandowski and P. Radzimski, J. Mol. Liq., 2006, 123, 43–50 CrossRef CAS.
  51. C. Fu, H. Zhou, D. Xie, L. Sun, Y. Yin, J. Chen and Y. Kuang, Colloid Polym. Sci., 2010, 288, 1097–1103 CAS.
  52. B. Dong, S. Zhang, L. Zheng and J. Xu, J. Electroanal. Chem., 2008, 619–620, 193–196 CrossRef CAS.
  53. M. Vranes, S. Dozic, V. Djeric and S. Gadzuric, J. Chem. Eng. Data, 2012, 57, 1072–1077 CrossRef CAS.
  54. A. Stoppa, J. Hunger and R. Buchner, J. Chem. Eng. Data, 2008, 54, 472–479 CrossRef.
  55. V. Kempter and B. Kirchner, J. Mol. Struct., 2010, 972, 22–34 CrossRef CAS.
  56. C. Schröder, T. Rudas, G. Neumayr, S. Benkner and O. Steinhauser, J. Chem. Phys., 2007, 127, 234503 CrossRef PubMed.
  57. X. Hu, Q. Lin, J. Gao, Y. Wu and Z. Zhang, Chem. Phys. Lett., 2011, 516, 35–39 CrossRef CAS.
  58. T. Singh and A. Kumar, J. Phys. Chem. B, 2008, 112, 12968–12972 CrossRef CAS PubMed.
  59. Y. Gao, N. Li, L. Zheng, X. Zhao, J. Zhang, Q. Cao, M. Zhao, Z. Li and G. Zhang, Chem.–Eur. J., 2007, 13, 2661–2670 CrossRef CAS PubMed.
  60. Y. R. Sharma, Elementary Organic Spectroscopy; Principles And Chemical Application, S. Chand & Company Ltd., 2005 Search PubMed.
  61. D. M. Zhu and Z. A. Schelly, Langmuir, 1992, 8, 48–50 CrossRef CAS.
  62. A. Caragheorgheopol, R. Bandula, H. Caldararu and H. Joela, J. Mol. Liq., 1997, 72, 105–119 CrossRef CAS.
  63. X. Liu, F. He, C. Salas, M. A. Pasquinelli, J. Genzer and O. J. Rojas, J. Phys. Chem. B, 2012, 116, 1289–1298 CrossRef CAS PubMed.
  64. Y. Zheng, W. Eli and G. Li, Colloid Polym. Sci., 2009, 287, 871–876 CAS.
  65. T. K. Jain, M. Varshney and A. Maitra, J. Phys. Chem., 1989, 93, 7409–7416 CrossRef CAS.
  66. L. Xue, H. Qiu, Y. Li, L. Lu, X. Huang and Y. Qu, Colloids Surf., B, 2011, 82, 432–437 CrossRef CAS PubMed.
  67. S. Y. Venyaminov and F. G. Prendergast, Anal. Biochem., 1997, 248, 234–245 CrossRef CAS PubMed.
  68. M. J. Clarke, K. L. Harrison, K. P. Johnston and S. M. Howdle, J. Am. Chem. Soc., 1997, 119, 6399–6406 CrossRef CAS.
  69. J. Salgado, T. Regueira, L. Lugo, J. Vijande, J. Fernández and J. García, J. Chem. Thermodyn., 2014, 70, 101–110 CrossRef CAS.
  70. J. Wang, Anal. Electrochem., John Wiley & Sons, 2000 Search PubMed.
  71. A. J. Bard and L. R. Faulkner, Electrochemical Methods. Fundamentals and Applications, John Wiley & Sons, 2001 Search PubMed.

Footnote

Electronic supplementary information (ESI) available. See DOI: 10.1039/c6ra13061e

This journal is © The Royal Society of Chemistry 2016
Click here to see how this site uses Cookies. View our privacy policy here.