Characterisation of composite films fabricated from collagen/chitosan and collagen/soy protein isolate for food packaging applications

Mehraj Ahmad*a, Nilesh Prakash Nirmalb, Mohammed Danishc, Julalak Chupromd and Shima Jafarzedehe
aInstitute of Nutrition (INMU), Mahidol University, 999 Phutthamonthon 4 Rd, Salaya, Nakhon Pathom 73170, Thailand. E-mail: mehraj.ahm@mahidol.ac.th; Fax: +66-2441-9344; Tel: +66-2800-2380 ext. 296
bCenter for Nutrition and Food Sciences, University of Queensland, St. Lucia, Brisbane 4072, QLD, Australia
cMalaysian Institute of Chemical and Bioengineering Technology, Universiti Kuala Lumpur, Alor Gajah, Melaka 78000, Malaysia
dDepartment of Microbiology, Faculty of Science, Prince of Songkla University, Hat Yai, Songkhla 90112, Thailand
eSchool of Industrial Technology, Food Technology Division, Universiti Sains Malaysia, Penang 11800, Malaysia

Received 19th May 2016 , Accepted 23rd August 2016

First published on 25th August 2016


Abstract

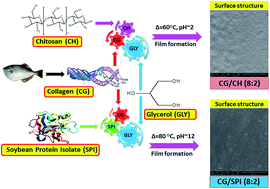
This study was undertaken to evaluate the potential of collagen/chitosan (CG/CH) and collagen/soy protein isolate (CG/SPI) composite films for food packaging applications. Two types of composite films at different blend ratios of CG/CH or CG/SPI (10[thin space (1/6-em)]:[thin space (1/6-em)]0, 8[thin space (1/6-em)]:[thin space (1/6-em)]2, 6[thin space (1/6-em)]:[thin space (1/6-em)]4, 5[thin space (1/6-em)]:[thin space (1/6-em)]5 and 0[thin space (1/6-em)]:[thin space (1/6-em)]10%, w/w) using 30% (w/w) glycerol as plasticiser were prepared and characterised. The results of mechanical tests of the CG/CH composite films displayed higher elongation at break point (EAB), but lower tensile strength (TS) and modulus of elasticity (E), compared to the CG film (P < 0.05). Conversely, the CG/SPI composite films exhibited lower EAB, but greater TS and E values (P < 0.05) compared to the CG film. Water vapour permeability (WVP) increased markedly in the CG/CH composite films; whilst it was found to decrease in CG/SPI composite films at the different blend ratios tested (P < 0.05). Transparency values and water solubility of CG/CH and CG/SPI composite films were decreased substantially, compared to the CG film (P < 0.05). Lower light transmission was observed in all composite films in ultraviolet (UV) and visible regions (200–800 nm), indicating improved UV blocking capacity. Intermolecular interactions through hydrogen bonding among polymeric components were dominant in the CG/SPI (8[thin space (1/6-em)]:[thin space (1/6-em)]2) composite film as elucidated by FTIR analysis. Thermo-gravimetric curves demonstrated that CG/CH (8[thin space (1/6-em)]:[thin space (1/6-em)]2) and CG/SPI (8[thin space (1/6-em)]:[thin space (1/6-em)]2) composite films exhibited lower heat susceptibility and weight loss (%), as compared to the CG film in the temperature range of 30–600 °C. DSC thermograms suggested that the compatible blend of CG/SPI (8[thin space (1/6-em)]:[thin space (1/6-em)]2) rendered a solid film matrix, which consisted of highly ordered and aggregated junction zones. SEM micrographs revealed that both CG/CH (8[thin space (1/6-em)]:[thin space (1/6-em)]2) and CG/SPI (8[thin space (1/6-em)]:[thin space (1/6-em)]2) composite films were slightly rougher than the CG film, but no apparent signs of cracking and layering phenomena were observed, thereby highlighting their potential use as biodegradable packaging materials.

1. Introduction

The production of sustainable and biodegradable films or coating materials from renewable resources, such as carbohydrates, proteins and lipids, has received considerable attention from researchers in recent years due to the depletion of oil resources and increasing environmental pollution caused by the extensive use of non-biodegradable petroleum based plastics.1 Among the proteins, collagen is a versatile biomaterial due to its amino acid residues in variable proportions and distributions along the macromolecular structure, which combine much functionality relevant for film-forming applications (Fig. S1).2 Collagen has been extensively used for the preparation of scaffolds as a dural substitute, for sustained-release films, for dressings as well as edible sausage casings.3 Based on the film forming properties and good barriers against oxygen and aromas at intermediate relative humidity (RH), collagen could be used for the preparation of biodegradable packaging materials.4 Nevertheless, collagen films possess relatively poor mechanical and water barrier properties, along with low thermal stability, which limit their application in the packaging industry.4 To overcome such limitations, the blending of collagen with other compatible and miscible biopolymers with different structures, especially chitosan and soy protein isolate, could render desired packaging material properties in the resulting composite films.

Chitosan is polycationic, binary heteropolysaccharide composed of randomly distributed D-glucosamine (deacetylated unit; GlcN) and N-acetyl-D-glucosamine (acetylated unit; GlcNA) linked via β-(1–4)-glucosidic bonds (Fig. S2). It can be produced commercially by deacetylation of chitin, which is found in crustacean's shells, insect's cuticle and cell wall of fungi.5 The chitin molecules are insoluble in most of the solvents. However, when the degree of deacetylation of chitin reaches about 50%, it becomes soluble in aqueous acidic media and is called chitosan.6 The chitosan solubility depends on the degree of deacetylation, the distribution of acetyl groups along the main chain and the nature of acid used for protonation.7 Apart from solubility, chitosan molecular weight can also affect the quality of the film such as elasticity or brittleness.8 Owing to non-toxic nature, superior film-forming ability, intrinsic bacteriostatic capacity and fungistatic activity of chitosan, it is emerging as green biomaterial for the manufacturing of packaging films.9 Improvement of thermal and mechanical properties was observed in films containing chitosan nanoparticles in addition to the imparted antimicrobial properties.10,11 Therefore, reinforcing chitosan with collagen to enhance its physical and mechanical properties has been attractive research topic in recent years. Moreover, the understanding at molecular level of the collagen/chitosan interactions is an important issue, and it must be elucidated.

Soy protein isolate (∼90% protein) is an amphiphilic molecule obtained as a highly refined by-product of soybean oil industry.12 Owing to its non-cytotoxicity, abundance in nature, low-cost, nutritive value and other useful functionalities, soy protein isolate attracts a greater interest to researchers as a promising alternative for synthetic polymers used in packaging industry.13 Soy protein isolate is composed of 2S, 7S, 11S and 15S fragments, where ‘S’ represents sedimentation coefficients (Fig. S3).13 The 7S (β-conglycinin; 37%) and 11S (glycinin; 31%) have the capacity of polymerisation and represent the major fractions of total extractable protein.12 More importantly, while considering the hydrophobic characteristics of soy protein isolate separately, we speculated that its blend with collagen could lead to a distinctive films having enhanced water vapour barrier property. Due to the differences in collagen and soy protein isolate with respect to their origin, structures and amino acid composition, the blend of both proteins could yield film with unique properties.14 Furthermore, the addition of a plasticiser to make the flexible and extensible film is highly desired. Plasticiser is a small molecule of low volatility added to polymeric materials to decrease attractive intermolecular forces along polymer chains, and increases free volume and chain mobility. As a result of these desired changes in molecular arrangements, films become flexible and robust to prevent cracking during storage and handling. To date, little information regarding the effect of chitosan and soy protein isolate on the material properties of collagen based films has been reported. In this context, the aim of the present work, therefore, was to prepare the composite films based on collagen/chitosan (CG/CH) and collagen/soy protein isolate (CG/SPI) at different blend ratios via casting approach using glycerol as plasticiser. In addition, the physical, mechanical, barrier and optical properties of the prepared films were comprehensively studied as a function of blend composition. The spectral, thermal and morphological properties of selected composite films exhibiting the desired set of material properties prerequisite for food packaging application were also investigated.

2. Materials and methods

2.1. Materials

Type I acid soluble collagen (CG) from unicorn leatherjacket skin (pI ∼ 5.58) containing 90.88% (w/w) of protein as determined by the Kjeldhal method,15 was extracted according to method described by Ahmad et al.2 Sodium azide and low molecular weight chitosan (CH) of ∼150 kDa (85% deacetylated) were purchased from Sigma Chemical Co. (St. Louis, MO, USA). Soy protein isolate (SPI) containing ≥90% (w/w) of protein was procured from Chengdu Protein Food Co. (Chengdu, Sichuan, China). Glycerol (98% purity), glacial acetic acid and sodium hydroxide (NaOH) were obtained from Merck (Merck Chemicals, Darmstadt, Germany). All the chemicals used in this study were of analytical grade.

2.2. Preparation of composite film forming solutions

Collagen (CG) extract was dissolved in 0.1 M acetic acid solution to obtain the protein concentration of 2% (w/v). After stirring for 2 h at room temperature, the CG solution was completely solubilised by heating at 80 °C for 30 min using a hot plate magnetic stirrer at 200 rpm (IKA® C-MAG HS-7, Selangor, Malaysia). Glycerol at 30% (w/w) based on protein content was added as plasticiser to the collagen solution and the mixture was stirred gently for 30 min at room temperature. Chitosan (CH) was dispersed in 2% (v/v) acetic acid to obtain the final concentration of 2% (w/v), followed by heating at 80 °C for 2 h. Glycerol at 30% (w/w) of total CH content was mixed with CH solution. The viscous CH solution was degassed for 10 min using ultra-sonicator water bath (Elmasonic EH075EL, New Jersey, USA) until homogenous solution was obtained. Similarly, soy protein isolate (SPI) was solubilised in distilled water with continuous stirring to obtain the protein concentration of 2% (w/v). The SPI dispersion was then adjusted to pH 11 using 6 N NaOH, followed by heating at 80 °C for 30 min to enhance the protein solubilisation. The SPI dispersion was cooled down at room temperature (28–30 °C) and then added with glycerol at 30% (w/w) based on protein content and left stirring overnight. Subsequently, composite film forming solutions (FFSs) were prepared by mixing the above solutions at different CG/CH or CG/SPI ratios (10[thin space (1/6-em)]:[thin space (1/6-em)]0, 8[thin space (1/6-em)]:[thin space (1/6-em)]2, 6[thin space (1/6-em)]:[thin space (1/6-em)]4, 5[thin space (1/6-em)]:[thin space (1/6-em)]5 and 0[thin space (1/6-em)]:[thin space (1/6-em)]10, w/w). The FFS was homogenised at a speed of 11[thin space (1/6-em)]000 rpm for 2 min using a homogeniser (Model T25 basic, IKA®18, 19 Labortechnik, Selangor, Malaysia) and allowed to stand at room temperature (28–30 °C) for 5 min to naturally remove most of the air bubbles incorporated during homogenisation, before being subjected to film casting.

2.3. Film casting, drying and conditioning of composite films

Approximately 4.0 ± 0.1 g of film forming solutions (FFSs) were cast onto a rimmed silicone resin plate (5 × 5 cm2), air-blown for 12 h at room temperature, followed by drying in an environmental chamber (Binder, KBF 115 # 00-19735, D-78532, Tuttalingen, Germany) at 25 ± 0.5 °C and 50 ± 5% RH for 24 h. Dried films were manually peeled off and subjected to further analyses.

Prior to testing, films were conditioned for 48 h at 50 ± 5% RH and 25 ± 0.5 °C. For ATR-FTIR, DSC, TGA and SEM studies, films were conditioned in a desiccator containing dried silica gel for 1 week to minimise the plasticising effect of water, followed by drying in a desiccator containing P2O5 gel for 2 weeks at room temperature (28–30 °C) to obtain the most dehydrated films (moisture content ≤ 5%).

2.4. Analyses

2.4.1. Thickness. The thickness of films was measured using a Mitutoyo digital electronic micrometer (Model ID-C112PM, Serial No. 00320, Mituyoto Corp., Kawasaki-shi, Japan). Ten random locations around each film sample were used for determination of thickness. The mean thickness values for each sample were taken and used in the calculation of mechanical and barrier properties.
2.4.2. Measurement of stress–strain properties. The stress–strain properties, such as tensile strength (TS), modulus of elasticity (E) and elongation at break point (EAB) of films were determined based on ASTM method (American Society for Testing and Materials) as described by Iwata et al.16 The test was performed using the universal testing machine (Lloyd Instrument, Hampshire, UK) in the controlled room at 25–28 °C and ∼50 ± 5% RH. Ten films (2 × 5 cm2) with the initial grip length of 3 cm were used for testing. The films were clamped and deformed under tensile loading using a 100 N load cell with the cross-head speed of 30 mm min−1 until the samples were broken.
2.4.3. Water vapour permeability. The water vapour permeability (WVP) was measured using gravimetric modified cup as described in ASTM method by Shiku et al.17 A plot of weight gained versus time was used to determine the WVP and the slope of the linear portion of this plot represented the steady state amount of water vapour diffusing through the film per unit of time (g h−1). Five films were used for analysis and WVP (g m−1 s−1 Pa−1) of the film was calculated as follows:
 
image file: c6ra13043g-t1.tif(1)
where w is the weight gain of the cup (g); l is the film thickness (m); A is the exposed area of film (m2); t is the time of gain (s); (P2P1) is the vapour pressure difference across the film (4244.9 Pa at 30 °C).
2.4.4. Film solubility. Solubility of films in water was determined as the content of dry matter matter solubilised after 24 h of immersion in water according to the modified method of Gennadios et al.18 The weight of solubilised dry matter was calculated by subtracting the weight of unsolubilised dry matter from the initial weight of dry matter and expressed as the percentage of total weight.
2.4.5. Colour properties. Colour of films was determined using a CIE colourimeter (Hunter associates laboratory, Inc., Reston, VA, USA). Colour of films was expressed as L*-(lightness/brightness), a*-(redness/greenness) and b*-(yellowness/blueness) values. Total difference in colour (ΔE*) was calculated according to the following equation:19
 
image file: c6ra13043g-t2.tif(2)
where ΔL*, Δa* and Δb* are the differences between the corresponding colour parameter of the sample and that of white standard (L* = 93.63, a* = −0.95 and b* = 0.46).
2.4.6. Light transmission and transparency. Light transmission of films against ultraviolet (UV) and visible light were measured at selected wavelengths between 200 and 600 nm, using a UV-Visible spectrophotometer (model UV-160, Shimadzu, Kyoto, Japan) according to the method of Jongjareonrak et al.20 The transparency value of film was calculated by the following equation:21
 
image file: c6ra13043g-t3.tif(3)
where T600 is the fractional transmittance at 600 nm and x is the film thickness (mm). The higher transparency value represents the opacity of films.

2.5. Characterisation of selected films

Based on adequate and desirable mechanical properties, CG/CH (8[thin space (1/6-em)]:[thin space (1/6-em)]2) and CG/SPI (8[thin space (1/6-em)]:[thin space (1/6-em)]2) composite films were further subjected to characterisation, in comparison with CG, CH and SPI films (Fig. S4).
2.5.1. Fourier transforms infrared spectroscopy (FTIR). FTIR spectra of selected films were determined using a Bruker Model Equinox 55 FTIR spectrometer (Bruker Co., Ettlingen, Germany) equipped with a horizontal attenuated total reflectance (ATR) through plate crystal cell (45° ZnSe; 80 mm long, 10 mm wide and 4 mm thick) (PIKE Technology Inc., Madison, WI, USA) at 25 °C. Films were placed onto the crystal cells and the cells were clamped in the mount of FTIR spectrometer. The spectra in the range of 400–4000 cm−1 with automatic signal gain were collected in 32 scans at a resolution of 4 cm−1 and were ratioed against a background spectrum recorded from the clean empty cell at 25 °C. Analysis of spectral data was carried out using the OPUS 3.0 data collection software programme (Bruker, Ettlingen, Germany). Prior to data analysis, the spectra were baseline corrected and normalised.
2.5.2. Differential scanning calorimetry. Thermal properties of selected films were determined using differential scanning calorimeter (DSC) (Perkin Elmer, Model DSC-7, Norwalk, CT, USA). Temperature calibration was performed using the indium thermogram. The films (4–5 mg) were accurately weighed into aluminium pans, hermetically sealed and scanned over the temperature range of −30 to 200 °C (1st heat scans) and −30 to 300 °C (2nd heat scans) with a heating rate of 10 °C min−1. The dry ice was used as a cooling medium and the system was equilibrated at −50 °C for 5 min prior to the scan. The empty aluminium pan was used as a reference. The glass transition temperature (Tg) was calculated as the inflexion point of the base line, caused by the discontinuity of the specific heat of the sample. The maximum transition temperature (Tmax) was estimated from the endothermic peak of DSC thermogram and transition enthalpy (ΔH) was determined from the area under the endothermic peak. All these properties were calculated with help of the DSC-7 software.
2.5.3. Thermo-gravimetric analysis (TGA). Dried selected films were scanned using a thermogravimetric analyser (TGA-7, Perkin Elmer, Norwalk, CT, USA) from 30 to 600 °C at a rate of 10 °C min−1.22 Nitrogen was used as the purge gas at a flow rate of 20 mL min−1. The percent weight loss (%) versus temperature plots were taken for thermo-gravimetric analysis (TGA) and derivative weight loss against temperature was taken for differential thermo-gravimetric analysis (DTG).
2.5.4. Microstructure. Microstructure of upper surface and cryo-fractured cross-section of the selected films was visualised using a scanning electron microscope (SEM) (JEOL JSM-5800 LV, Tokyo, Japan) at an accelerating voltage of 10 kV. The films were cryo-fractured by immersion in liquid nitrogen. Prior to visualisation, the composite films were mounted on brass stub and sputtered with gold in order to make the sample conductive, and photographs were taken at 8000× magnification for surface. For cross-section, cryo-fractured films were mounted around stubs perpendicularly using double sided adhesive tape, coated with gold and observed at the 5000× magnification.

2.6. Statistical analyses

Experiments were performed in triplicate (n = 3) with three different lots of film samples and a completely randomised design (CRD) was used. Data were presented as means ± standard deviation and a probability value of P < 0.05 was considered significant. Analysis of variance (ANOVA) was performed and the mean comparisons were done by Duncan's multiple range tests. Statistical analysis was performed using the Statistical Package for Social Sciences (SPSS for Windows, SPSS Inc., Chicago, IL, USA).

3. Results and discussion

3.1. Film thickness

Thickness values of composite films based on CG/CH and CG/SPI at different blend ratios are shown in Table 1. The CG film (control) had the smallest thickness value (21.0 μm) but CH film showed the highest value (57.0 μm); whereas, the thickness values of CG/CH composite films ranged from 31.0 to 39.0 μm. This indicated that the thickness values of CG/CH composite films increased significantly (P < 0.05) with an increase in the CH content. The results suggested that the alignment of CG peptide chains in film matrix was formed with lower degree of compactness, when increased content of CH was incorporated. The dispersed CH content might be inserted between CG molecules of film matrix, thereby hindering the interaction within the peptide chains. Although slight aggregation occurred between CG and CH, but those aggregates were not able to align themselves into the compact network. Consequently, the protruded film network was formed as indicated by the increased film thickness. Normally, film thickness depends on the preparation methods, drying conditions, composition of the film-forming solution and the nature of film components.1 For CH film, the film-forming solution as a consequence of its large swelling capacity was denser than CG film that promotes the formation of a thicker film once the solution is dry.23 For CG/SPI composite films, thickness values did not show much significant difference at different blend ratios (P > 0.05), but resulted in the larger values (28.0, 26.0 and 25.0 μm) than CG and SPI films (21.0 and 24.0 μm), respectively. It was noticed that the globular SPI peptide chains more likely distributed as a thicker layer between CG fibrous chains. As a result, thickness was increased in CG/SPI composite films. For CG and SPI films, the higher degree of compactness was noted in which peptide chains align themselves with less protrusion in film matrix. Overall, CG/SPI composite films were significantly thinner than CG/CH composite films, due to the differences in film-forming solutions (P < 0.05). The components of the film-forming solution affect the alignment, sorting and compacting of the molecules during film drying process, thereby causing the differences in thickness.24 The thickness values of CG/CH and CG/SPI were similar to that of presented in the literature for composite films based on fish gelatine and rice flour.25 Thickness is an important parameter which affects the migration rate of the liquid film-forming dispersion and causes the differences in film structure.26 Therefore, controlling this parameter is crucial for the mechanical and barrier properties of the films. Additionally, the thickness could increase with the concentration of the poured solution and final thickness mainly depends on the retraction of the film when solution evaporates and the rate of solution evaporation strongly affects the protein or polymer network arrangements.26
Table 1 Tensile strength (TS), elastic modulus (E), elongation at break (EAB), water vapor permeability (WVP) and thickness of CG/CH and CG/SPI composite films prepared at different blend ratiosa
Film samples TS (MPa) E (MPa) EAB (%) WVP × (10−10 g s−1 m−1 Pa−1) Thickness (μm)
a Values are given as mean ± SD (n = 3); CG/CH (collagen/chitosan); CG/SPI (collagen/soy protein isolate). Different letters (a, b, c, d, e) in the same column between CG/CH composite films together with the control CG film indicate significant differences (P < 0.05). Different capital letters (A, B, C, D, E) in the same column between CG/SPI composite films together with the control CG film indicate significant differences (P < 0.05).
CG (control) 25.3 ± 4.1aB 181.8 ± 56.7aC 14.7 ± 3.3bA 3.0 ± 0.1dA 21.0 ± 3.0eD
CG/CH (8[thin space (1/6-em)]:[thin space (1/6-em)]2) 20.1 ± 3.3b 84.6 ± 15.7b 24.0 ± 3.0a 4.5 ± 0.3c 31.0 ± 3.0d
CG/CH (6[thin space (1/6-em)]:[thin space (1/6-em)]4) 11.2 ± 1.7c 54.9 ± 17.6c 22.3 ± 4.5a 4.5 ± 0.6c 34.0 ± 2.0c
CG/CH (5[thin space (1/6-em)]:[thin space (1/6-em)]5) 13.5 ± 1.9c 55.3 ± 5.3c 24.7 ± 3.8a 5.8 ± 0.6b 39.0 ± 1.0b
CG/CH (0[thin space (1/6-em)]:[thin space (1/6-em)]10) 5.8 ± 1.3d 34.1 ± 7.0d 17.3 ± 3.5b 8.8 ± 0.8a 57.0 ± 3.0a
CG/SPI (8[thin space (1/6-em)]:[thin space (1/6-em)]2) 40.1 ± 4.6A 645.8 ± 32.8A 7.6 ± 4.9B 2.4 ± 0.3B 28.0 ± 2.0A
CG/SPI (6[thin space (1/6-em)]:[thin space (1/6-em)]4) 38.6 ± 5.8A 780.8 ± 28.7A 6.1 ± 3.8B 2.1 ± 0.2B 26.0 ± 2.0AB
CG/SPI (5[thin space (1/6-em)]:[thin space (1/6-em)]5) 35.9 ± 8.7A 737.1 ± 22.0A 6.1 ± 2.8B 1.9 ± 0.5B 25.0 ± 1.0BC
CG/SPI (0[thin space (1/6-em)]:[thin space (1/6-em)]10) 16.8 ± 1.0C 330.1 ± 14.8B 6.2 ± 2.3B 2.0 ± 0.1B 24.0 ± 1.0C


3.2. Mechanical properties

The mechanical characteristics such as tensile strength (TS), elasticity modulus (E) and elongation at break points (EAB) of composite films based on CG/CH and CG/SPI at different blend ratios are summarised in Table 1. The corresponding stress–strain curves of the respective composite films were shown in Fig. S5. These curves exhibited the typical plastic deformation behaviour at room temperature under an applied load. At low strain in all films, the stress increased rapidly with an increase in the strain and the slopes were in elastic region defining the elastic modulus (E). At strain ≥ 6%, the stress decreased slowly until failure occurred in CG film. On the other hand, the yield stress values in CG/CH composite films were lower than CG film indicating CG/CH composite films were more ductile and extensible (Fig. S5A). Nevertheless, higher yield stress values but lower yield strain values were noted in CG/SPI composite films as compared to CG film (Fig. S5B). This indicated that mechanical parameters of CG/SPI composite films obtained under lower strain conditions are clearly dependent on film composition and structure. The TS and E values of CG/CH composite films were found in the range of 11.3–20.1 MPa and 54.9–84.7 MPa, respectively, which fall between the values of CG film (TS ∼ 25.3 MPa; E ∼ 181.9) and CH film (TS ∼ 5.8 MPa; E ∼ 34.1 MPa), respectively (P < 0.05). This indicated that the TS and E values of resulting composite films were affected substantially by the CH addition in film formulation. CH incorporation produced the significant decrease in TS and E in CG/CH composite film with respect to CG film (control) (P < 0.05). The apparent plasticising effect produced by CH addition weakens the chain interactions and promotes chain mobility in CG/CH composite films. As a result of it, the film matrix is more flexible and the polymer chains can slide past each other more readily during tensile deformation. The decrease of E in CG/CH composite films could be ascribed to lack of stress transfer across blend matrix interface. Nevertheless, no significant difference in TS and E was noted when the 40–50% (w/w) CH was incorporated in CG/CH composite films (P > 0.05). The EAB values of CG/CH composite films (22.3–24.7%) were significantly higher than those of CG film (14.7%) and CH film (17.4%) (P < 0.05). Higher EAB values reflected the increased extensibility of CG/CH composite films. Increased EAB values of films prepared at acidic pH were more likely caused by the presence of weaker bonds stabilising the film matrix. The higher EAB values were coincidental with decreased TS and E values. Nevertheless, no substantial change in EAB values was noted in CG/CH composite films, regardless of increased CH content. Similar results were obtained when curdlan was added to gelatine films in which the increase of curdlan concentration decreased TS from 33.2 to 6.7 MPa.24

Higher TS (35.9–40.1 MPa) and E (645.9–780.8 MPa) but lower EAB values (6.1–7.6%) were noted in the CG/SPI composite films as compared to CG film, indicating stronger and stiffer CG/SPI composite films (P < 0.05). The TS values of the most widely used plastic films, such as LDPE and HDPE are 23.6 and 47.4 MPa, respectively.27 This showed that CG/SPI composite films relatively retained adequate tensile properties to withstand external stress during packaging of materials. Higher TS and E values of CG/SPI composite films suggested reinforcement of the film matrix, which was probably induced by a certain degree of interaction between the protein molecules of CG and SPI. This fact could be attributed to the reticulation of film network structure caused by higher protein–protein interactions due to hydrogen bonding, electrostatic or hydrophobic interactions, as well as disulphide bonding (S–S).13 These interactions are influenced by sequence of amino acid residues and three dimensional size of the entire composite film structure.13 SPI film had the lowest TS and E (P < 0.05) suggesting that proteins in SPI could not form the stable intermolecular interactions. This might be governed by the intrinsic rigidity of SPI protein molecules as evidenced by higher E value than CG film, thereby yielding the film with less extensibility.28 The SPI consists of polar and non-polar side chains and the intermolecular interactions between these side chains of SPI molecules restricts segmental rotation and molecular mobility, thus leading to brittle SPI film.29 Nevertheless, CG and SPI in composite film underwent molecular interactions in the way which the higher inter-junction with strong bonds were formed. This phenomenon allows higher chain entanglement which in turn reduces the molecular slippage upon tensile deformation. This was coincidental with the lowered EAB with the increased incorporation of SPI at all ratios (P < 0.05). From the literature review, the addition of mung protein isolate (MPI) resulted in the formation of stiffer films confirming the reinforcing effect of MPI in the polymeric matrix.30 Therefore, this can be concluded that the mechanical properties of composite films prepared from different biopolymers were largely affected by the type of biopolymer, type of molecular interactions and the ratio of biopolymers used.

3.3. Water vapour permeability

The water vapour permeability (WVP) values of composite films based on CG/CH and CG/SPI at different blend ratios are shown in Table 1. The WVP test is a common method to evaluate the potential of vapour penetration into the packaging film, which is considered as an important parameter to design the packaging film. The WVP of CG/CH composite films increased significantly from 4.6 to 5.8 (×10−10 g s−1 m−1 Pa−1), as compared to CG film (3.0 × 10⁻¹⁰ g s−1 m−1 Pa−1) (P < 0.05). It was noticed that increased CH content in CG/CH composite films, caused significant increase in WVP (P < 0.05), which could be due to the greater water affinity of CH that facilitates the migration of water vapour molecules through the film. Although, CH is insoluble in water, but its functional groups could interact with water molecules via hydrogen bonding without any modification in the chemical structure. The hydrophilic domains in the CH structure i.e., –NH2 and –OH groups, represent the binding sites for water molecules.31 Moreover, if the films are hydrophilic, water interacts with the polymer matrix and the permeation for water vapour is increased, resulting in weak moisture barrier properties.32 The water permeation through the film matrix twists a less dense structure where polysaccharide–protein chain ends are more mobile and increasing the transmission rate.32 The water vapour transfer process in packaging film depends mainly on the hydrophilic–hydrophobic ratio of the film constituents and the micro-paths of film network microstructure.1 Nevertheless, CG/CH composite films were relatively resistant to moisture transfer as compared to CH film (8.8 × 10⁻¹⁰ g s−1 m−1 Pa−1). This ideal behaviour could be due to better integration of film matrix as evidenced by stronger intermolecular interaction (≥TS) which tightens the film matrix, reduces the micro-paths and slows down the moisture transfer through the film.

The CG/SPI composite films had substantially lower WVP values ranging from 1.9 to 2.5 (×10−10 g s−1 m−1 Pa−1), compared to CG film (3.0 × 10⁻¹⁰ g s−1 m−1 Pa−1) (P < 0.05). However, there was no significant difference in WVP observed among CG/SPI composite films (P > 0.05), regardless of increased SPI content. The lower WVP in CG/SPI composite films was related to the modification of film structure due to the formation of a less hydrophilic constituent groups in the film after addition of SPI.28 Generally, the hydrophilic nature of CG molecules increased the water binding capacity of resulting film, while SPI with higher hydrophobicity in nature rendered films with lower WVP. CG might also interact with polar groups in SPI, thus hydrophilic sites along the protein chains are not exposed to water molecules, resulting in the lower water uptake.28 In addition, alkaline pH favours solubilisation of SPI and subsequent thermal treatment disrupted the quaternary structure of proteins accompanied by a partial protein denaturation (unfolding), but significant amount of native conformation remaining in their globular structure confers the hydrophobic nature.28 Moreover, unfolded proteins cross-link through intra- and intermolecular interaction of amino acid residues, as well as the formation of disulphide cross-links (S–S) and hydrophobic bonds during film drying, contributed to the lower moisture transfer through CG/SPI composite films.33 Among all films, CG/SPI composite films showed significantly lower WVP values than those of CG/CH composite films (P < 0.05). In general, CH addition increased the WVP but SPI more likely led to the lower WVP of films. The water barrier characteristics of packaging films are influenced by the chemical nature of macromolecules, structural and morphological characteristics of the polymeric matrix, chemical nature of the additives, degree of cross-linking, nature of biopolymers, especially hydrophilicity and hydrophobicity as well as the ratio of biopolymers used.34 The difference in WVP among CG/CH and CG/SPI composite films is correlated with the differences in the molecular diffusion of water vapour and hydrophilic–hydrophobic interactions. In general, WVP also depends on other factors such as the ratio between the crystalline and amorphous zone, polymeric chain mobility and specific interaction between the functional groups of the polymers.28 Thus, the SPI incorporation had profound impact on WVP of CG/SPI composite films.

3.4. Water solubility

Water solubility of composite films based on CG/CH and CG/SPI at different blend ratios is shown in Table 2. The resistance against water or water solubility can be determined by measuring the total soluble fraction of the film. The CG film exhibited highest water solubility (75.2 ± 0.5%), whilst CG/CH and CG/SPI composite films showed lower water solubility (P < 0.05). Water solubility of both CG/CH and CG/SPI composite films decreased with the increase of CH or SPI content in film formulations (P < 0.05), respectively. Nonetheless, slightly higher solubility was noted in CG/CH (6[thin space (1/6-em)]:[thin space (1/6-em)]4) composite film (P < 0.05), suggesting that weaker interaction among constituent molecules was presumed in film and non-polymerised proteins were washed-out with water. The lower water solubility of CH film might be due to the poor solubility of CH molecules in aqueous solution, but the film could be hydrated in the presence of acid, leading to increased solubility in water.35 For CG/SPI composite films, the lower water solubility might be due to the decrease in the relative amount of CG and subsequent increase of SPI in the composite films (P < 0.05). The CG contains highly acid soluble protein, but SPI could be solubilised in alkaline solution. Additionally, the decrease in the solubility of CG/SPI composite film could be due to strong interaction between these two proteins in the film matrix correlated with the highest tensile performance, causing the lower hydrophilic sites available for absorbing water. Moreover, non-polar components of SPI favourably interacted with hydrophobic domains of CG, leading to the increased hydrophobicity of the resulting film. As a consequence, the water solubility of composite films decreased. Water solubility of films can be viewed as a measure of the water resistance and integrity of a film.1 In fact, when water is progressively eliminated during the drying of composite films, proteins conformation changes, and the degree of protein unfolding determines the type and proportion of covalent (S–S bonds) or non-covalent (ionic and hydrogen bonds) interactions established between protein chains.36 The desirable content of cysteine residues is also present in SPI and hence disulphide bond formation might be taken place in the SPI film.13 Therefore, peptide chains could interact more strongly, especially via disulphide bonds, when proteins were denatured.37 Hence, the cohesion of the final structure would be a function of these bonds and determines the solubility of the film.
Table 2 Colour properties and solubility of CG/CH and CG/SPI composite films prepared at different blend ratiosa
Film samples Colour parameters Film solubility (%)
L* a* b* ΔE*
a Values are given as mean ± SD (n = 3). Key: see the caption for Table 1. Different letters (a, b, c, d, e) in the same column between CG/CH composite films together with the CG control film indicate significant differences (P < 0.05). Different capital letters (A, B, C, D, E) in the same column between CG/SPI composite films together with the CG control film indicate significant differences (P < 0.05).
CG (control) 90.0 ± 0.3bcB −1.2 ± 0.1aA 0.9 ± 0.1eC 2.8 ± 0.3cD 75.2 ± 0.5aA
CG/CH (8[thin space (1/6-em)]:[thin space (1/6-em)]2) 90.5 ± 0.1a −1.4 ± 0.1ab 1.8 ± 0.2d 2.5 ± 0.2c 52.0 ± 0.6c
CG/CH (6[thin space (1/6-em)]:[thin space (1/6-em)]4) 89.9 ± 0.2bc −1.5 ± 0.1b 2.5 ± 0.1c 3.5 ± 0.1b 58.0 ± 0.7b
CG/CH (5[thin space (1/6-em)]:[thin space (1/6-em)]5) 90.3 ± 0.2ab −1.7 ± 0.1c 3.0 ± 0.1b 3.5 ± 0.1b 31.5 ± 0.5d
CG/CH (0[thin space (1/6-em)]:[thin space (1/6-em)]10) 89.7 ± 0.3c −1.9 ± 0.1d 5.3 ± 0.1a 5.7 ± 0.1a 24.5 ± 0.4e
CG/SPI (8[thin space (1/6-em)]:[thin space (1/6-em)]2) 90.6 ± 0.3A −2.4 ± 0.1B 6.1 ± 0.2B 6.1 ± 0.3C 63.6 ± 0.6B
CG/SPI (6[thin space (1/6-em)]:[thin space (1/6-em)]4) 90.5 ± 0.4AB −2.6 ± 0.4BC 6.5 ± 1.1B 6.5 ± 1.0BC 53.0 ± 0.5C
CG/SPI (5[thin space (1/6-em)]:[thin space (1/6-em)]5) 90.2 ± 0.2AB −2.6 ± 0.1BC 7.2 ± 0.8B 7.3 ± 0.8B 49.0 ± 0.5D
CG/SPI (0[thin space (1/6-em)]:[thin space (1/6-em)]10) 89.2 ± 0.2C −2.9 ± 0.0C 9.9 ± 0.3A 10.1 ± 0.4A 44.4 ± 0.4E


3.5. Film colour

Colour parameters of composite films based on CG/CH and CG/SPI at different blend ratios are shown in Table 2. Film colour directly influences the product appearance and thus consumer acceptance. Colour of CG/CH and CG/SPI composite films was affected by the addition of CH or SPI in film formulations. The increased b*-values (yellowness) and ΔE*-values (total colour difference) with the coincidental decreases in a*-values (redness/greenness) were found in CG/CH composite films, as compared to CG film (P < 0.05). This indicated that CG/CH composite films became more yellowish as the amount of CH increased. The carbonyl groups provided by CH and amino groups of CG reacted via Maillard reaction, thereby enhanced the yellowness as revealed by the increased b*-values.38 However, L*-values (lightness) did not change significantly in CG/CH (6[thin space (1/6-em)]:[thin space (1/6-em)]4) composite film when compared to CG film (P > 0.05). For CG/CH (8[thin space (1/6-em)]:[thin space (1/6-em)]2) composite film, highest L*-value was noted (P < 0.05). It was observed that CH film had the highest ΔE*- and b*-values (P < 0.05). Highest b*-value in CH film was associated with the yellowish colouration due to the presence of β-1–4 linked 2-amino-2-deoxy-D-glucopyranose repeating units.39 The SPI film was also yellowish as evidenced by the increased b*-values (P < 0.05). It was noticed that the decrease in a*-values with simultaneous increase in b*- and ΔE*-values were obtained as higher amount of SPI was incorporated. Such changes in colour properties of resulting films were most likely attributed to the colouring components existing in SPI.28 In general, the increase in ΔE*-values was found in both CG/CH and CG/SPI composite films with the addition of CH or SPI (P < 0.05), respectively. Nevertheless, no change in ΔE*-values was observed in CG/CH (8[thin space (1/6-em)]:[thin space (1/6-em)]2) composite film, as compared to CG film (P > 0.05). The ΔE*-values were more significant in CG/SPI composite films and showed increasing trend with the addition of SPI. Therefore, film components had influence on the colour properties of resulting films, depending on the type, nature and concentration of biopolymer incorporated.

3.6. Light transmission and transparency

Light transmission in UV-visible range and transparency values of composite films based on CG/CH and CG/SPI at different blend ratios are shown in Table 3. In UV range of 200–280 nm, CG/CH and CG/SPI composite films showed the lower light transmission, compared to CG film. Among all films, CG/SPI composite films had lowest light transmission at 280 nm (UV region) due to the presence of tyrosine (Tyr, 3.8% in SPI), phenylalanine (Phe, 5.2% in SPI) and tryptophan (Trp, 1.1% in SPI), which are well known sensitive chromophores that can absorb the light at the wavelength below 300 nm.40 In general, the protein based films containing high aromatic amino acid content play an important role in absorbing UV light.40 The UV light can be subdivided into three distinct wavelength regions, UV-A (315–400 nm), UV-B (280–315 nm) and UV-C (100–280) nm. UV-A is responsible for lipid peroxidation or photo-oxidation of foods.41 The experimental results suggested that the composite films have potential to prevent UV light and retard the oxidation of the food packaged product. For CG film, light transmission in visible region (500–600 nm) was found in the range of 86.3–87.5%, which was significantly higher than the CG/CH and CG/SPI composite films (P < 0.05). However, CG/CH (8[thin space (1/6-em)]:[thin space (1/6-em)]2) composite film had lower barrier property of light in UV-visible range. The absorption of UV-visible light by film samples is restricted to certain functional groups that contain valence electrons of low excitation energy. Nevertheless, CG/CH (6[thin space (1/6-em)]:[thin space (1/6-em)]4) and CG/CH (5[thin space (1/6-em)]:[thin space (1/6-em)]5) composite films showed higher light transmission in the visible range (P < 0.05). Light transmission of films was most likely governed by the arrangement or alignment of polymer chains in the molecular structure of film. Non-uniformities in the composition of the film material can cause significant changes in optical properties.1 Optical properties of films are an important attribute which influences their appearance, marketability, and their suitability for various applications.28
Table 3 Light transmittance (%) and transparency values of CG/CH and CG/SPI composite films prepared at different blend ratiosa
Film samples Wavelength (nm) Transparency values
200 280 350 400 500 600 700 800
a Values are given as mean ± SD (n = 3). Key: see the caption for Table 1. Different letters (a, b, c, d, e) in the same column between CG/CH composite films together with the CG control film indicate significant differences (P < 0.05). Different capital letters (A, B, C, D, E) in the same column between CG/SPI composite films together with the CG control film indicate significant differences (P < 0.05).
CG (control) 0.1 50.0 81.9 84.1 86.3 87.4 88.2 88.6 3.6 ± 0.0aA
CG/CH (8[thin space (1/6-em)]:[thin space (1/6-em)]2) 0.1 36.1 55.8 58.6 60.8 61.9 62.6 63.2 3.3 ± 0.0c
CG/CH (6[thin space (1/6-em)]:[thin space (1/6-em)]4) 0.1 47.5 74.8 81.3 85.4 86.9 87.7 88.2 3.4 ± 0.0b
CG/CH (5[thin space (1/6-em)]:[thin space (1/6-em)]5) 0.1 45.8 71.5 79.4 83.9 85.5 86.4 86.9 3.3 ± 0.0bc
CG/CH (0[thin space (1/6-em)]:[thin space (1/6-em)]10) 0.1 34.0 44.9 52.3 57.0 58.9 60.2 61.5 3.0 ± 0.0d
CG/SPI (8[thin space (1/6-em)]:[thin space (1/6-em)]2) 0.1 8.9 57.5 67.6 78.2 81.3 83.1 84.2 3.4 ± 0.0B
CG/SPI (6[thin space (1/6-em)]:[thin space (1/6-em)]4) 0.1 2.7 44.5 56.8 69.8 74.2 77.0 79.2 3.4 ± 0.0B
CG/SPI (5[thin space (1/6-em)]:[thin space (1/6-em)]5) 0.1 1.0 42.2 57.8 73.3 77.8 80.7 82.5 3.5 ± 0.0B
CG/SPI (0[thin space (1/6-em)]:[thin space (1/6-em)]10) 0.1 0.1 15.3 26.2 38.7 45.1 50.4 54.8 3.2 ± 0.0C


The CG/CH composite films were more transparent, compared to CG film (P < 0.05). This could be due to the clear and transparent nature of CH solution, which might contribute to transparency of CG/CH composite films. The CG/CH composite films showed the lower transparency values when CH content increased, indicating higher film transparency (P < 0.05). Higher transparency value of CG film signifies the opaqueness. For CG/SPI composite films, the slight decrease in transparency values was obtained as the SPI content increased (P < 0.05), but the degree of decrease was lower than that found in CH incorporated composite films. The SPI molecules might closely interact with CG chains, thus resulting in more compact structure which could retard the transmission of light, as compared to CG film. Thus, CH or SPI incorporation influenced the light transmission and transparency of resulting composite films, and were more transparent and clear for packaging applications, in comparison with CG film with less transparency.

3.7. FTIR spectra

FTIR spectra of selected films in the range of 400–4000 cm−1 are depicted in Fig. 1. The corresponding assignment and wavenumber of absorption bands are summarised in Table 4. Spectra with different characteristics were obtained for each film, in which the specific bands of the corresponding functional groups could be observed. The CG film and CG/CH (8[thin space (1/6-em)]:[thin space (1/6-em)]2) composite film displayed amide-I bands at the wavenumbers of 1641.1 and 1640.2 cm−1, respectively (Fig. S6A). The shift of amide-I peak to lower wavenumber in CG/CH (8[thin space (1/6-em)]:[thin space (1/6-em)]2) composite film represented significant decrease in molecular order due to molecular reorientation in film structure induced by the addition of CH.42 This was correlated with the decrease in mechanical properties in CH incorporated films. The amide-I peak in CH film at the wavenumber of 1638.5 cm−1 was assigned to C[double bond, length as m-dash]O stretching of N-acetyl group.43 The additional peaks at amide-I region with the wavenumber of 1720.1 and 1715.5 cm−1 were found in CG/CH (8[thin space (1/6-em)]:[thin space (1/6-em)]2) composite and CH films, which more likely represented uncoupled C[double bond, length as m-dash]O stretching of the carboxyl group from acetic acid.2 On the other hand, CG/SPI (8[thin space (1/6-em)]:[thin space (1/6-em)]2) composite and SPI films showed the amide-I bands at the wavenumbers of 1642.0 and 1634.4 cm−1 (corresponding to C[double bond, length as m-dash]O connected with NH2), respectively. The higher wavenumber of CG/SPI (8[thin space (1/6-em)]:[thin space (1/6-em)]2) composite film at amide-I region confirmed the existence of structural rearrangements coupled with protein–protein interactions, implying relatively strong affinity between CG and SPI (Fig. S6A). The various reactive groups, such as –NH2, –OH and –SH of SPI could easily participate in cross-linking reactions via hydrogen bonding with CG to form strong CG/SPI (8[thin space (1/6-em)]:[thin space (1/6-em)]2) composite film.44 Nevertheless, the lower wavenumber (1634.4 cm−1) with weak peak of amide-I peak in SPI film was associated with the higher extent of intermolecular interaction as evidenced by higher rigidity (E).45 As a general rule, hydrogen bonding lowers the wavenumber of stretching vibrations, but increases the wavenumber of bending vibrations.25 These spectral differences among different films were largely attributed to intermolecular interactions, variable conformation and molecular orientation of protein and polysaccharide chains.24 The amide-II absorption band of CG/CH (8[thin space (1/6-em)]:[thin space (1/6-em)]2) composite film had lower wavenumber (1540.3 cm−1) compared to CG film (1548.6 cm−1) and CH film (1528.4–1561.3 cm−1). For the amide-II spectra of CG/SPI (8[thin space (1/6-em)]:[thin space (1/6-em)]2) composite film, the wavenumber of 1551.5 cm−1 was slightly higher than CG film, indicating the higher molecular order due to presence of intermolecular hydrogen bonding between the reactive groups of SPI and CG. For SPI film, two major intense peaks appeared in amide-II region at the wavenumbers of 1575.9 cm−1 and 1541.6 cm−1, which had been assigned to parallel (A type) or perpendicular (E1 type) α-helix.46 At amide-III region, CH incorporation led to marked decrease in the wavenumber of CG/CH (8[thin space (1/6-em)]:[thin space (1/6-em)]2) composite film (1238.2 cm−1), compared to CG film (1239.8 cm−1). Conversely, SPI addition was attributed to slight up-shift in the wavenumber of CG/SPI (8[thin space (1/6-em)]:[thin space (1/6-em)]2) composite film (1241.8 cm−1) at amide-III band associated with higher molecular order stabilised by hydrogen bonding.45 The amide-III bands of CH and SPI films were noticeable at the wavenumbers of 1207.8 and 1260.7 cm−1, respectively. The variation in wavenumber among different film samples might be due to difference in amino acid composition, functional groups and interaction between different components in composite films.1 The absorption bands that arose from asymmetric stretching vibrations of –OH groups of glycerol (plasticiser) coupled to –CH2 of amino acid residues of CG/SPI (8[thin space (1/6-em)]:[thin space (1/6-em)]2) composite film (1044.0 cm−1), CG film (1042.5 cm−1) and SPI film (1044.0 cm−1), whereas, –OH groups of CG/CH (8[thin space (1/6-em)]:[thin space (1/6-em)]2) composite film (1040.8 cm−1) and CH film (1039.0 cm−1) interacted with the glycerol via hydrogen bonding.47 The absorption band at lower frequency in CH film at 1153.6 cm−1 was assigned to the C–O–C linkage in the glycosidic structure, and the relatively broad band at 1071.4 cm−1 was assumed to the C–O stretching vibration of C6–OH group.48 The typical peaks in SPI film which arose at 799.3 cm−1, 867.2 cm−1, 929.9 cm−1 (C–C skeletal vibrations), 1044.0 cm−1 (C–O stretch at C1 and C3), 1106.4 cm−1 (C–O stretch at C2) and 1421.0–1470.2 cm−1 (–CH2 bending) wavenumbers.
image file: c6ra13043g-f1.tif
Fig. 1 FTIR spectra of films from CG, CH, SPI, CG/CH (8[thin space (1/6-em)]:[thin space (1/6-em)]2) and CG/SPI (8[thin space (1/6-em)]:[thin space (1/6-em)]2) blend.
Table 4 Assignments and wavenumber of the bands in the FTIR spectra of selected films
Assignments Wavenumber (cm−1)
CG CG/CH CH CG/SPI SPI
N–H stretching vibration, coupled with hydrogen bonding 3311.1 3314.4 3281.7 3297.2 3283.5
–CH asymmetric stretching 2882.9 2877.7 2892.4 2877.5 2850.7
2841.1 2836.7 2837.2
–CH2 asymmetric stretching 2936.4 2933.0 2942.2 2938.4 2919.0
–CH2 asymmetric bending 1410.0 1410.7   1403.4 1421.0
1451.8 1450.0   1450.9 1470.2
C[double bond, length as m-dash]O stretching/hydrogen bonding coupled with the CN stretch, CCN deformation and in-plane NH 1641.1 1640.2   1642.0 1634.4
C[double bond, length as m-dash]O stretching of N-acetyl group     1638.5    
C[double bond, length as m-dash]O stretching of the carboxyl group from CH3COOH   1720.1 1715.5    
N–H bending vibration/N–H stretching vibration/C–N stretching vibrations 1548.7 1540.3 1561.3 1551.5 1541.6
1528.4 1575.9
C–N stretching/in-plane N–H bending/CH2 stretching vibrations 1239.8 1238.1   1241.8 1260.7
O–H stretching of glycerol molecules 1042.5 1040.8 1039.0 1044.0 1044.0
O–CH skeletal vibrations 1337.5 1335.2 1322.8 1337.9  
1383.9
C–O stretching vibration (anhydro-glucose ring)   1072.4 1071.4    
C–O stretching 1107.4 1107.3   1108.6 1106.4
1162.2
C–OH stretching vibration 1206.3 1206.4 1207.8 1206.4  
1282.9
C–O–C asymmetric stretching vibration     1153.6    
C–C skeletal vibrations 738.3 736.9 734.2 791.5 799.3
856.2 850.2 853.1 869.5 867.2
923.2 926.2 900.8 925.9 929.2


In addition, amide-A band representing N–H stretching vibration coupled with hydrogen bonding, appeared at wavenumbers of 3281.7–3314.4 cm−1 for all film samples. For amide-A band as shown in Fig. S6B, CG/SPI (8[thin space (1/6-em)]:[thin space (1/6-em)]2) composite film (3297.2 cm−1) had the lower wavenumber, compared to that of CG film (3311.1 cm−1). At amide-A region, the shift of wavenumber suggesting the enhancement of reinforcing effect (increased TS and E) in CG/SPI (8[thin space (1/6-em)]:[thin space (1/6-em)]2) composite film as compared to CG film. Typically, the decrease in vibrational wavenumber and broadening of the –OH and –NH vibration bands could be indicative of interaction between biopolymers in the film via hydrogen bonding.49 The CG/CH (8[thin space (1/6-em)]:[thin space (1/6-em)]2) composite film exhibited the broader peak at wavenumber of 3314.1 cm−1 (amide-A peak), suggesting the greater decrease in intermolecular interaction (Fig. S6B). It was postulated that the reactive group could undergo interaction to the lower extent in CG/CH (8[thin space (1/6-em)]:[thin space (1/6-em)]2) composite film, thereby resulting in more flexibility in the film. This was confirmed by the decreased TS and increased EAB of CG/CH (8[thin space (1/6-em)]:[thin space (1/6-em)]2) composite film in comparison with CG film. Additionally, the amide-B bands were found at wavenumber range of 2919.0–2942.3 cm−1 for all film samples, arising from asymmetric stretch vibration of [double bond, length as m-dash]C–H as well as –NH3+.45 Both CG/CH (2933.0 cm−1) and CG/SPI (2938.3 cm−1) composite films showed the lower wavenumber at amide-B peak, compared to CG film (2936.4 cm−1), suggesting the interaction of –NH3 group with the functional groups of film matrix.45 The shift to lower wavenumber at amide-B peak in the CG/CH (8[thin space (1/6-em)]:[thin space (1/6-em)]2) and CG/SPI (8[thin space (1/6-em)]:[thin space (1/6-em)]2) composite films indicated an increase in hydrogen bonding between two components in film matrix and likely led to changes in film properties. Thus, FTIR spectra reconfirmed the changes in molecular organisation and interaction in the film matrix of resulting composite films.

3.8. Differential scanning calorimetry (DSC)

The DSC thermograms of 1st heat scan (A) and 2nd heat scan (B) of the selected films are depicted in Fig. 2 and their glass transition temperatures (Tg), melting transition temperatures (Tmax) and enthalpies (ΔH) are shown in Table 5. From the thermogram of 1st heat scan (−30 to 200 °C), it was observed that the CG film exhibited two-step like transitions which represented the Tg at 40.2 ± 1.5, followed by Tmax at 79.1 ± 1.0 °C. The Tmax in CG film was associated with the helix–coil transition and disruption of molecular ordered structure (turn or random coils). The amount of imino acid composition (proline and hydroxyproline) of triple-helical collagen structure in CG film directly determines Tmax. The Tg in all films was linked with molecular segmental motion of disordered (amorphous) structure. The Tg is governed by structural features of polymeric material such as molecular weight, chain branching, crystallinity, and extent of cross-linking. The endothermic transition in film involves disruption of crystalline or aggregated structure stabilised by various intermolecular interactions.24 For the 2nd heat scan of CG film (−30 to 300 °C), the thermogram showed one-step like transition at the Tmax of 262.5 ± 1.0 °C with ΔH of 24.4 ± 0.8 J g−1, respectively. This endothermic peak was apparently related with the complete thermal decomposition of triple-helical collagen structure caused by the irreversible breakdown of intra- and intermolecular bonds. However, no Tg was observed in the thermograms of all films (2nd heat run). This might be due to the small variations in heat capacity related to change in specific volume near Tg.50 In addition, the absorbed water acting as plasticiser might be removed during the 1st heat scan. As a consequence of water removal, the interaction in film matrix was enhanced leading to the formation of more rigid film network. From the result (1st heat run), CG/CH (8[thin space (1/6-em)]:[thin space (1/6-em)]2) composite film had lower Tmax (73.9 ± 1.0 °C) and enthalpy (ΔH = 0.6 ± 0.1 J g−1) as compared to CG film. The lower intermolecular interaction among the CG and CH strands reduced the Tmax and ΔH of CG/CH (8[thin space (1/6-em)]:[thin space (1/6-em)]2) composite film, as compared to CG film. Moreover, the lower ΔH of CG/CH (8[thin space (1/6-em)]:[thin space (1/6-em)]2) composite film indicated that lesser portion of ordered structure formed in the composite film due to the higher mobility of CG/CH chains. Lower Tg (34.5 ± 1.5 °C) of CG/CH (8[thin space (1/6-em)]:[thin space (1/6-em)]2) composite film was accompanied with decreased mechanical resistance and rigidity of film matrix, as evidenced by lower mechanical property (TS and E, as shown in Table 1), compared to the CG film. It must be noted that the loss of mechanical resistance of CG/CH (8[thin space (1/6-em)]:[thin space (1/6-em)]2) composite film was mainly due to the lack of structural integrity along with disconnected structure. In case of CG/CH (8[thin space (1/6-em)]:[thin space (1/6-em)]2) composite film (2nd heat scan), the thermogram clearly showed two separate endothermic peaks at the Tmax of 136.5 ± 1.0 and 240.2 ± 1.5 °C. This suggested that two different ordered structures coexisted in the composite film matrix, which was mostly related to those separately formed by the CG at lower Tmax and the CH at higher Tmax. Those well separated endothermic peaks observed in CG/CH (8[thin space (1/6-em)]:[thin space (1/6-em)]2) composite film suggested partial immiscibility of CG and CH molecules due to their distinct chemical structures. Among all films, lower Tg (23.3 ± 1.0 °C) and Tmax (49.5 ± 1.5 °C) with ΔH of 0.6 ± 0.1 J g−1 were noted in the thermogram of CH film (1st heating run). It might be due to the more molecular flexibility and smaller molecular size of CH.50 The lower Tmax (49.5 ± 1.5 °C) also indicated lower thermal resistance of CH film which was in agreement with the weaker film structure, as evidenced by lower mechanical property (TS and E). From the thermogram of CH film (2nd heat run), a new and wide endothermic peak arose at 225.5 ± 1.5 °C that was probably related to the decomposition of CH due to breakdown of intra- and intermolecular hydrogen bonds.51 From the 1st heat scan, the thermogram of the SPI film exhibited Tg at 40.1 ± 1.0 °C, followed by sharp endothermic peak at Tmax of 89.9 ± 1.8 °C with ΔH of 0.7 ± 0.1 J g−1. Since, the major components of soy proteins are globular proteins, 7S (35%) and 11S (52%), therefore the endothermic peak has been attributed to the melting or dissociation of 7S (β-conglycinin) and 11S (glycinin) globulins in film matrix.28 From the 2nd heat scan of SPI film, two endothermic peaks appeared at 227.8 ± 1.0 and 260.9 ± 1.0 °C were probably associated with the complete decomposition of two main globular proteins (7S and 11S) caused by the breakdown of covalent and non-covalent bonds. However, the hydrophobic interaction among globular proteins in SPI film was predominant, compared to that in CG film.28 Furthermore, disulphide bond was present in SPI film, resulting in higher thermal resistance (i.e., higher Tmax).52 For CG/SPI (8[thin space (1/6-em)]:[thin space (1/6-em)]2) composite film (1st heat scan), the thermogram showed Tg at 53.8 ± 1.0 °C, followed by a single and broad endothermic peak at Tmax of 93.1 ± 1.0 °C with ΔH of 1.9 ± 0.1 J g−1. The shift of Tmax towards intermediate position in CG/SPI (8[thin space (1/6-em)]:[thin space (1/6-em)]2) composite film recognised as a sign of miscibility/stability or interfacial interaction. The results suggested that single ordered structure existed in the CG/SPI (8[thin space (1/6-em)]:[thin space (1/6-em)]2) composite film matrix due to the molecular reorientation in film network induced by the addition of SPI that produced a certain degree of interaction between CG and SPI through hydrogen bonds. This observation was consistent with the results of the decrease of WVP and increase in TS due to a greater interaction among protein molecules, induced by SPI that restricted the molecular mobility of CG in the film matrix. From the 2nd heat scan of CG/SPI (8[thin space (1/6-em)]:[thin space (1/6-em)]2) composite film, the endothermic transition was not observed. The result suggested that upon fast (quenched) cooling before starting the 2nd heat scan, the CG/SPI molecules were not able to rearrange themselves into the ordered structure. Nevertheless, the broad endothermic peak appeared at 240.3 ± 1.5 °C, indicating the complete decomposition of globular protein cross-links in the film matrix. Additionally, the higher values of ΔH (38.6 ± 0.9 J g−1) required to disrupt the film structure possibly explained the increase in crystallinity behaviour of CG/SPI (8[thin space (1/6-em)]:[thin space (1/6-em)]2) composite film. Therefore, the addition of SPI showed the pronounced impact on thermal properties (transition) of the resulting composite film due to the intermolecular interaction and molecular organisation especially in the ordered phase/zone in the film matrix. Based on DSC results, it was postulated that the compatible blend of CG and SPI rendered the solid film matrix, which was stabilised by forming a highly ordered junction zones.
image file: c6ra13043g-f2.tif
Fig. 2 DSC thermograms of 1st heating scan (A) and 2nd heating scan (B) of films from CG, CH, SPI, CG/CH (8[thin space (1/6-em)]:[thin space (1/6-em)]2) and CG/SPI (8[thin space (1/6-em)]:[thin space (1/6-em)]2) blend.
Table 5 Glass transition temperature (Tg), endothermic transition temperature (Tmax), transition enthalpy (ΔH) of selected film samplesa
Film samples 1st heat scan 2nd heat scan
Tg (°C) Tmax (°C) ΔH (J g−1) Tg (°C)   Tmax (°C) ΔH (J g−1)
a Values are given as mean ± SD (n = 3). Different letters (a, b, c, d, e, f) in the same column indicate significant difference (P < 0.05).b P1: peak1.c P2: peak2.
CG (control) 40.2 ± 1.5b 79.1 ± 1.0b 0.9 ± 0.2b   262.5 ± 1.0a 24.4 ± 0.8c
CG/CH (8[thin space (1/6-em)]:[thin space (1/6-em)]2) 34.5 ± 1.5c 73.9 ± 1.0c 0.6 ± 0.1d P1b 136.4 ± 1.0e 0.3 ± 0.1f
P2c 240.2 ± 1.5b 8.5 ± 0.1e
CG/CH (0[thin space (1/6-em)]:[thin space (1/6-em)]10) 23.2 ± 1.0d 49.5 ± 1.5d 0.6 ± 0.1e   225.5 ± 1.5d 39.8 ± 0.9b
CG/SPI (8[thin space (1/6-em)]:[thin space (1/6-em)]2) 53.8 ± 1.0a 93.1 ± 1.0a 1.9 ± 0.1a   240.3 ± 1.5b 38.6 ± 0.9b
CG/SPI (0[thin space (1/6-em)]:[thin space (1/6-em)]10) 40.1 ± 1.0b 89.9 ± 1.8a 0.7 ± 0.1c P1b 227.8 ± 1.0c 12.3 ± 0.3d
P2c 260.8 ± 1.0a 83.8 ± 0.9a


3.9. Thermal stability

The thermogravimetric curves revealing thermal degradation behaviour of selected films are shown in Fig. 3. Their degradation temperatures (Td) and weight loss (Δw) are presented in Table 6. All the films showed multi step onset of thermal decomposition in TGA/DTG curves. Three main weight loss stages were observed in CG film, CG/CH (8[thin space (1/6-em)]:[thin space (1/6-em)]2) and CG/SPI (8[thin space (1/6-em)]:[thin space (1/6-em)]2) composite films, but CH film and SPI film exhibited four main weight loss stages. The first stage weight loss (Δw1 = 4.0 ± 0.1%) in CG film was observed at the onset temperature (Td1) of 46.7 ± 0.9 °C, and was mostly associated with the loss of free and bound water adsorbed in the film.1 For CG/CH (8[thin space (1/6-em)]:[thin space (1/6-em)]2) and CG/SPI (8[thin space (1/6-em)]:[thin space (1/6-em)]2) composite films, the first stage weight loss (Δw1 = 1.4 ± 0.1–1.5 ± 0.1%) was observed over the onset temperature (Td1) ranging from 45.8 ± 0.3 to 70.2 ± 1.4 °C. For SPI film and CH film, the first stage weight loss (Δw1 = 3.4 ± 0.1–7.9 ± 0.1%) occurred approximately at the temperature (Td1) of 24.0 ± 0.1 and 177.7 ± 0.9 °C, respectively. Thus, lower weight loss at initial temperature rise was observed in CG/CH (8[thin space (1/6-em)]:[thin space (1/6-em)]2) and CG/SPI (8[thin space (1/6-em)]:[thin space (1/6-em)]2) composite films, suggesting lower water desorption from composite film matrix. This was probably due to the hydrogen bonds in CG/CH (8[thin space (1/6-em)]:[thin space (1/6-em)]2) and slightly higher hydrophobicity in CG/SPI (8[thin space (1/6-em)]:[thin space (1/6-em)]2) composite films, compared to CG film. The second stage weight loss (Δw2 = 18.2 ± 0.1%) for CG film appeared at the onset temperature of 190.9 ± 1.9 °C (Td2), while CG/CH (8[thin space (1/6-em)]:[thin space (1/6-em)]2) and CG/SPI (8[thin space (1/6-em)]:[thin space (1/6-em)]2) composite films showed weight loss (Δw2 = 23.3 ± 0.1–24.7 ± 0.1%) over the onset temperature (Td2) ranging from 189.0 ± 1.3 to 202.2 ± 1.5 °C. For SPI film and CH film, the second stage weight loss (Δw2 = 23.3 ± 0.1–32.2 ± 0.1%) was observed at the onset temperature (Td1) ranging from 172.9 ± 1.2 to 212.6 ± 1.5 °C. This was most likely due to the degradation or decomposition of heat sensitive proteins in film components, glycerol compounds and the evaporation of structurally bound water in the film.28 For the third stage weight loss (Δw3 = 58.8 ± 0.1%), Td3 value of 289.7 ± 1.5 °C was observed in CG film that was mostly associated with the degradation of the larger-size or associated protein fragments,28 while CG/CH (8[thin space (1/6-em)]:[thin space (1/6-em)]2) composite film showed the Δw3 of 47.6 ± 0.1% at the Td3 of 312.3 ± 1.5 °C. In case of CG/SPI (8[thin space (1/6-em)]:[thin space (1/6-em)]2) composite film, the Δw3 of 45.2 ± 0.1% was noticeable at the Td3 of 290.1 ± 1.2 °C. The results revealed that both composite films showed enhanced thermal stability attributed to the stronger interaction especially in CG/SPI (8[thin space (1/6-em)]:[thin space (1/6-em)]2), yielding the stronger film structure, thus leading to the higher heat resistance of the resulting film, compared to CG film.1 The higher amount of disulphide and hydrophobic interaction between proteins in SPI at alkaline pH might contribute to heat resistance in CG/SPI (8[thin space (1/6-em)]:[thin space (1/6-em)]2) composite film. For the fourth stage weight loss (Δw4 = 11.2 ± 0.2–12.0 ± 0.2%), onset at temperature of (Td4) 392.1 ± 1.5 and 402.5 ± 1.5 °C were obtained for SPI film and CH film, respectively. Nevertheless, the fourth stage weight loss Δw4 disappeared in composite films and in the CG film. It was noted that the fourth stage weight loss might be associated with the loss of thermally stable components constituted in the film matrix. The residual mass (representing char content) at 600 °C was in the range of 18.9 ± 0.2–30.8 ± 0.5% for all films. Slight difference in char content was most likely due to different formulation and types of polymeric material, blend ratios, covalent and non-covalent interaction among the film components. Based on the TGA/DTG data, CH or SPI addition contributed to a substantial improvement in the thermal stability of the resulting CG/CH (8[thin space (1/6-em)]:[thin space (1/6-em)]2) and CG/SPI (8[thin space (1/6-em)]:[thin space (1/6-em)]2) composite films as evidenced by the higher heat-stable mass residues (27.6 ± 0.2–28.6 ± 0.5%). Thus the pyrolysis of CG could be delayed by CH or SPI incorporation which had impact on the thermal stability of the resulting composite films. In general, heat-stable components play a kind of shielding role appreciably refraining the decomposition of less thermally stable component.
image file: c6ra13043g-f3.tif
Fig. 3 TGA/DTG curves of films from CG, CH, SPI, CG/CH (8[thin space (1/6-em)]:[thin space (1/6-em)]2) and CG/SPI (8[thin space (1/6-em)]:[thin space (1/6-em)]2) blend.
Table 6 Thermal degradation temperature (Td, °C) and weight loss (Δw, %) of selected film samplesa
Film samples Δ1 Δ2 Δ3 Δ4 Residue (%)
Td1 onset (°C) Δw1 (%) Td2 onset (°C) Δw2 (%) Td3 onset (°C) Δw3 (%) Td4 onset (°C) Δw4 (%)
a Values are given as mean ± SD (n = 3). Different letters (a, b, c, d) in the same column indicate significant difference (P < 0.05). Δ1, Δ2, Δ3 and Δ4 denote the first, second, third and fourth stage weight loss, respectively, of film during TGA heating scan.
CG (control) 46.7 ± 0.9 4.0 ± 0.1 190.9 ± 1.9 18.2 ± 0.1 289.7 ± 1.5 58.8 ± 0.1 18.9 ± 0.2d
CG/CH (8[thin space (1/6-em)]:[thin space (1/6-em)]2) 70.2 ± 1.4 1.4 ± 0.1 202.2 ± 1.5 23.3 ± 0.1 312.2 ± 1.5 47.6 ± 0.1 27.6 ± 0.2b
CG/CH (0[thin space (1/6-em)]:[thin space (1/6-em)]10) 177.7 ± 0.9 7.9 ± 0.1 212.6 ± 1.5 23.3 ± 0.1 304.4 ± 1.5 25.9 ± 0.1 402.5 ± 1.5 12.0 ± 0.2 30.8 ± 0.5a
CG/SPI (8[thin space (1/6-em)]:[thin space (1/6-em)]2) 45.8 ± 0.3 1.5 ± 0.1 189.0 ± 1.3 24.7 ± 0.1 290.1 ± 1.2 45.2 ± 0.1 28.6 ± 0.5b
CG/SPI (0[thin space (1/6-em)]:[thin space (1/6-em)]10) 24.0 ± 0.1 3.4 ± 0.1 172.9 ± 1.2 32.2 ± 0.1 285.6 ± 1.2 30.2 ± 0.1 392.1 ± 1.5 11.2 ± 0.2 22.8 ± 0.2c


3.10. Microstructure

The SEM micrographs of the surface (A) and cryo-fractured cross-section (B) of selected films are illustrated in Fig. 4. As expected, CG film had smooth and homogenous surface. The CH film showed irregular and non-uniform surface with apparent spots. However, compact and smooth cross-section was detected in CG film and CH film. This clearly indicated that an ordered structure was formed without cracking and layering phenomenon in both CG film and CH film. The CG/CH (8[thin space (1/6-em)]:[thin space (1/6-em)]2) composite film had relatively rough and slightly uneven and protruded surface. The CH molecules plausibly could not interact or disperse well within CG matrix, thereby enhancing the roughness and discontinuity of film microstructure. This was in accordance with the lower mechanical and water vapour barrier properties of CG/CH (8[thin space (1/6-em)]:[thin space (1/6-em)]2) composite film, as compared to CG film. In addition, non-porous, grainy and coarser cross-section was observed in CG/CH (8[thin space (1/6-em)]:[thin space (1/6-em)]2) composite film and showed notable difference as a function of film composition. On the other hand, peptide chains entangled each other and formed strong adhesion, which was responsible for the smooth and homogenous surface along with good structural integrity in CG/SPI (8[thin space (1/6-em)]:[thin space (1/6-em)]2) composite film. Similar observations were reported by Ahmad et al.24 that worked with fish gelatine/curdlan composite films. Moreover, no distinct phase separation was observed in the blend matrix of CG/SPI (8[thin space (1/6-em)]:[thin space (1/6-em)]2) composite film. Thus, SPI was uniformly distributed within the continuous CG matrix indicating good compatibility of the CG/SPI blend. Nevertheless, small particles on surface and minor heterogeneities in cross-section were detected in CG/SPI (8[thin space (1/6-em)]:[thin space (1/6-em)]2) composite film which is typical form of brittle fracture. The presence of strong intermolecular interaction in CG/SPI (8[thin space (1/6-em)]:[thin space (1/6-em)]2) composite film matrix led to the improved mechanical and water vapour barrier properties. The profound morphological differences in surface and cross-section among CG/CH (8[thin space (1/6-em)]:[thin space (1/6-em)]2) and CG/SPI (8[thin space (1/6-em)]:[thin space (1/6-em)]2) composite films were due to different characteristics of CH and SPI in terms of their interaction or their alignment or distribution and dispersion efficiency in films. The similar microstructure has been reported in fish gelatine film incorporated with rice flour.25 Slight surface roughness in both CG/CH and CG/SPI composite films led to increased film thickness as compared to CG film (Table 1). In general, the microstructures of films are governed by molecular organisation in the film network.
image file: c6ra13043g-f4.tif
Fig. 4 SEM micrographs of surface (A) and cryo-fractured cross-section (B) of film from CG, CH, SPI, CG/CH (8[thin space (1/6-em)]:[thin space (1/6-em)]2) and CG/SPI (8[thin space (1/6-em)]:[thin space (1/6-em)]2) blend.

4. Conclusion

In this study, the properties of CG/CH and CG/SPI composite films were significantly affected by different blend ratio. Increased CH content in CG/CH composite films reduced the tensile performance (TS) and rigidity (E) but improved extensibility (EAB). The CG/SPI composite film exhibited the higher TS and E but lower EAB with the subsequent increase in SPI content, indicating the considerable improvement in mechanical properties. Furthermore, CG/SPI formed a compatible and miscible blend compared to CG/CH, as evidenced by the enhanced intermolecular interactions between CG and SPI via hydrogen bonding. Optical properties revealed that CG/CH and CG/SPI composite films were transparent and effectively prevented transmission of UV and visible light which could be beneficial for prevention of light mediated lipid oxidation in packaged foods. Based on micrographs, the components of CG/SPI blend were intimately mixed and showed good adhesion and compatibility which resulted in high structural integrity in CG/SPI (8[thin space (1/6-em)]:[thin space (1/6-em)]2) composite film, compared to CG film. Improved thermal stability was found in both CG/CH (8[thin space (1/6-em)]:[thin space (1/6-em)]2) and CG/SPI (8[thin space (1/6-em)]:[thin space (1/6-em)]2) composite films as compared to CG film as evidenced by the presence of higher heat-stable mass residues. These results suggested that the developed composite films have high potential to be used as eco-friendly UV light screening packaging materials, and further studies would be required to determine the use of these films as active packaging in commercial food systems.

Acknowledgements

The authors would like to express their sincere thanks to the Institute of Nutrition (INMU), Mahidol University, Thailand for the research facilities.

References

  1. M. Ahmad, S. Benjakul, T. Prodpran and T. W. Agustini, Food Hydrocolloids, 2012, 28, 189–199 CrossRef CAS.
  2. M. Ahmad, S. Benjakul and S. Nalinanon, Food Hydrocolloids, 2010, 24, 588–594 CrossRef CAS.
  3. E. A. Baldwin, R. Hagenmaier and J. Bai, Edible Coatings and Films to Improve Food Quality, Second Edition, CRC Press, 2011 Search PubMed.
  4. M. Ahmad, N. P. Nirmal and J. Chuprom, RSC Adv., 2016, 6, 33868–33879 RSC.
  5. K. Kurita, Prog. Polym. Sci., 2001, 26, 1921–1971 CrossRef CAS.
  6. I. Younes and M. Rinaudo, Mar. Drugs, 2015, 13, 1133–1174 CrossRef CAS PubMed.
  7. C. K. S. Pillai, W. Paul and C. P. Sharma, Prog. Polym. Sci., 2009, 34, 641–678 CrossRef CAS.
  8. S. Y. Park, K. S. Marsh and J. W. Rhim, J. Food Sci., 2002, 67, 194–197 CrossRef CAS.
  9. C. M. P. Yoshida, V. B. V. Maciel, M. E. D. Mendonça and T. T. Franco, LWT--Food Sci. Technol., 2014, 55, 83–89 CrossRef CAS.
  10. M. R. de Moura, M. V. Lorevice, L. H. C. Mattoso and V. Zucolotto, J. Food Sci., 2011, 76, N25–N29 CrossRef CAS PubMed.
  11. Z. Shi, K. G. Neoh, E. T. Kang and W. Wang, Biomaterials, 2006, 27, 2440–2449 CrossRef CAS PubMed.
  12. N. Cao, Y. Fu and J. He, Food Hydrocolloids, 2007, 21, 1153–1162 CrossRef CAS.
  13. G. A. Denavi, M. Pérez-Mateos, M. C. Añón, P. Montero, A. N. Mauri and M. C. Gómez-Guillén, Food Hydrocolloids, 2009, 23, 2094–2101 CrossRef CAS.
  14. P. Guerrero, P. M. Stefani, R. A. Ruseckaite and K. de la Caba, J. Food Eng., 2011, 105, 65–72 CrossRef CAS.
  15. J. M. Lynch and D. M. Barbano, J. AOAC Int., 1999, 82, 1389–1398 CAS.
  16. K. I. Iwata, S. H. Ishizaki, A. K. Handa and M. U. Tanaka, Fish. Sci., 2000, 66, 372–378 CrossRef CAS.
  17. Y. Shiku, P. Yuca Hamaguchi, S. Benjakul, W. Visessanguan and M. Tanaka, Food Chem., 2004, 86, 493–499 CrossRef CAS.
  18. A. Gennadios, A. Handa, G. W. Froning, C. L. Weller and M. A. Hanna, J. Agric. Food Chem., 1998, 46, 1297–1302 CrossRef CAS.
  19. A. Gennadios, C. L. Weller, M. A. Hanna and G. W. Froning, J. Food Sci., 1996, 61, 585–589 CrossRef CAS.
  20. A. Jongjareonrak, S. Benjakul, W. Visessanguan and M. Tanaka, Food Hydrocolloids, 2008, 22, 449–458 CrossRef CAS.
  21. J. H. Han and J. D. Floros, J. Plast. Film Sheeting, 1997, 13, 287–298 CAS.
  22. P. Nuthong, S. Benjakul and T. Prodpran, Int. J. Biol. Macromol., 2009, 44, 143–148 CrossRef CAS PubMed.
  23. H. Nagahama, H. Maeda, T. Kashiki, R. Jayakumar, T. Furuike and H. Tamura, Carbohydr. Polym., 2009, 76, 255–260 CrossRef CAS.
  24. M. Ahmad, N. P. Nirmal and J. Chuprom, RSC Adv., 2015, 5, 99044–99057 RSC.
  25. M. Ahmad, N. M. Hani, N. P. Nirmal, F. F. Fazial, N. F. Mohtar and S. R. Romli, Prog. Org. Coat., 2015, 84, 115–127 CrossRef CAS.
  26. S. Kokoszka, F. Debeaufort, A. Lenart and A. Voilley, Int. Dairy J., 2010, 20, 53–60 CrossRef CAS.
  27. S. Zivanovic, J. Li, P. M. Davidson and K. Kit, Biomacromolecules, 2007, 8, 1505–1510 CrossRef CAS PubMed.
  28. M. S. Hoque, S. Benjakul, T. Prodpran and P. Songtipya, Int. J. Biol. Macromol., 2011, 49, 663–673 CrossRef CAS PubMed.
  29. J. Zhang, P. Mungara and J. Jane, Polymer, 2001, 42, 2569–2578 CrossRef CAS.
  30. M. S. Hoque, S. Benjakul, T. Prodpran and P. Songtipya, Int. J. Biol. Macromol., 2011, 49, 663–673 CrossRef CAS PubMed.
  31. L. Ma, C. Gao, Z. Mao, J. Zhou, J. Shen, X. Hu and C. Han, Biomaterials, 2003, 24, 4833–4841 CrossRef CAS PubMed.
  32. S. Patricia Miranda, O. Garnica, V. Lara-Sagahon and G. Cárdenas, J. Chil. Chem. Soc., 2004, 49, 173–178 Search PubMed.
  33. A. González, M. C. Strumia and C. I. Alvarez Igarzabal, J. Food Eng., 2011, 106, 331–338 CrossRef.
  34. T. H. McHugh and J. M. Krochta, J. Agric. Food Chem., 1994, 42, 841–845 CrossRef CAS.
  35. L. Ilium, Pharm. Res., 1998, 15, 1326–1331 CrossRef.
  36. J. W. Rhim, A. Gennadios, A. Handa, C. L. Weller and M. A. Hanna, J. Agric. Food Chem., 2000, 48, 4937–4941 CrossRef CAS PubMed.
  37. A. N. Mauri and M. C. Añón, J. Sci. Food Agric., 2006, 86, 1064–1072 CrossRef CAS.
  38. T. Prodpran, S. Benjakul and A. Artharn, Int. J. Biol. Macromol., 2007, 41, 605–614 CrossRef CAS PubMed.
  39. M. Pereda, A. G. Ponce, N. E. Marcovich, R. A. Ruseckaite and J. F. Martucci, Food Hydrocolloids, 2011, 25, 1372–1381 CrossRef CAS.
  40. P. Guerrero, Z. A. Nur Hanani, J. P. Kerry and K. de la Caba, J. Food Eng., 2011, 107, 41–49 CrossRef CAS.
  41. S. Bhattacharyya, S. Majhi, B. P. Saha and P. K. Mukherjee, J. Photochem. Photobiol., B, 2014, 130, 293–298 CrossRef CAS PubMed.
  42. D. Altiok, E. Altiok and F. Tihminlioglu, J. Mater. Sci.: Mater. Med., 2010, 21, 2227–2236 CrossRef CAS PubMed.
  43. M. Liu, Y. Zhou, Y. Zhang, C. Yu and S. Cao, Food Hydrocolloids, 2013, 33, 186–191 CrossRef CAS.
  44. L. Wang, M. Xiao, S. Dai, J. Song, X. Ni, Y. Fang, H. Corke and F. Jiang, Carbohydr. Polym., 2014, 101, 136–145 CrossRef CAS PubMed.
  45. M. Ahmad and S. Benjakul, Food Hydrocolloids, 2011, 25, 381–388 CrossRef CAS.
  46. M. Shih, T. Hsieh, T. Lin, Y. C. Hsing and F. A. Hoekstra, Plant Cell Physiol., 2010, 51, 395–407 CrossRef CAS PubMed.
  47. I. Leceta, P. Guerrero, I. Ibarburu, M. T. Dueñas and K. de la Caba, J. Food Eng., 2013, 116, 889–899 CrossRef CAS.
  48. M. Cheng, J. Deng, F. Yang, Y. Gong, N. Zhao and X. Zhang, Biomaterials, 2003, 24, 2871–2880 CrossRef CAS PubMed.
  49. B. B. Doyle, E. G. Bendit and E. R. Blout, Biopolymers, 1975, 14, 937–957 CrossRef CAS PubMed.
  50. Y. Sun, Y. Liu, Y. Li, M. Lv, P. Li, H. Xu and L. Wang, Carbohydr. Polym., 2011, 84, 952–959 CrossRef CAS.
  51. F. A. López, A. L. R. Mercê, F. J. Alguacil and A. López-Delgado, J. Therm. Anal. Calorim., 2008, 91, 633–639 CrossRef.
  52. P. Guerrero and K. de la Caba, J. Food Eng., 2010, 100, 261–269 CrossRef CAS.

Footnote

Electronic supplementary information (ESI) available. See DOI: 10.1039/c6ra13043g

This journal is © The Royal Society of Chemistry 2016