Effect of alloying elements on the ideal strength and charge redistribution of γ′-Ni3Al: a first-principles study of tensile deformation

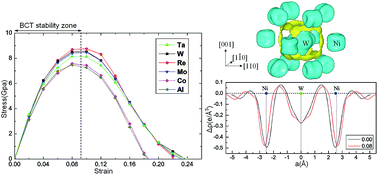
Minru Wena and Chong-Yu Wang*ab
aDepartment of Physics, Tsinghua University, Beijing 100084, China. E-mail: cywang@mail.tsinghua.edu.cn
bCentral Iron and Steel Research Institute, Beijing 100081, China

Received 19th May 2016 , Accepted 11th August 2016

First published on 11th August 2016


Abstract

The ideal strength, which is the minimum stress required to yield a perfect crystal, is fundamental for understanding the mechanical properties of real materials. Using density functional theory, the effect of the alloying elements Ta, W, Re, Mo, and Co on the ideal tensile strength (σIT) of γ′-Ni3Al along three characteristic directions was investigated. By examining the crystal mechanical stability in terms of Born criteria at every single strain during the tensile tests, the σIT values of L12-Ni3Al along the [001], [110] and [111] directions are determined to be 12.93 GPa, 7.20 GPa and 25.55 GPa, respectively. The effect of alloying elements on σIT shows obvious directionality because of directional interactions between impurities and host atoms. Doping with Ta, W, Re, Mo, and Co increases σIT in the [110] direction by 13%, 18%, 21%, 17%, and 5%, respectively. Furthermore, the electronic mechanism underlying the strengthening effect of alloying elements is determined by analyzing the d-orbital partial density of states and charge redistribution.

1. Introduction

The ideal strength of a material is the minimum stress required to yield a perfect (defect-free) crystal and sets an upper bound for the strength of real materials.1,2 Clearly, knowledge of the ideal strength, which is dominated by the behavior of valence electrons and ions, is fundamental for understanding the mechanical properties of materials and for development of practical applications. The strength experimentally observed in nanoindentation of a defect-free crystal can quantitatively agree with the value obtained by ab initio calculations.3,4

With advances in computational methods and modern computers, the ideal strength can be obtained by first-principles calculations.2,5–7 Early studies focused on the ideal strength of perfect crystals, such as single crystals (e.g., Al, Cu, Fe, and Ni)2,8–12 and ordered compound systems (e.g., FeAl, Co3(Al,W), and SiN).13–15 Calculation of the ideal strength has attracted great interest because it plays a crucial role in research of superhard synthesized materials.16–19 Furthermore, the ideal strength test has been extended to defective systems. For example, Hu et al.20 and Xu et al.21 studied the ideal strength of intermetallic compounds with a point defect, Lu et al.22 investigated the ideal tensile strength (σIT) of the Al grain boundary, and Yin et al.23 investigated the tensile and fracture process of the TiN/VN interface. Additionally, the temperature-dependent ideal strength was investigated by Shang et al.24,25 under the assumption that the effect of temperature only causes volume variation and electron–phonon and phonon–phonon interactions can be ignored.

Nickel-based single-crystal superalloys exhibit excellent elevated-temperature mechanical properties and are widely used for blade applications in advanced aeroplane engines and power-generation turbines.26,27 In general, the γ′-Ni3Al precipitate phase with its anomalous temperature dependence of the yield stress is largely responsible for the mechanical strength of alloys and their resistance to deformation at high temperature.28–30 Therefore, a study of the mechanical properties of γ′-Ni3Al should partially reflect the global properties of nickel-based superalloys. By adding alloying elements (e.g., Ta, W, Ti, Co, Cr, Re, Mo, and Ru), modern commercial nickel-based superalloys achieve extraordinary high-temperature performance.26,27,31,32 Ab initio calculations have been extensively used to investigate the influence of alloying elements on the properties of γ′-Ni3Al.33–37 However, these studies generally focus on the site preference of refractory elements in γ′-Ni3Al. The ideal strength is not emphasized. In particular, no theoretical study has focused on the effect of W, Ta, Mo, and Co on the ideal tensile strength of nickel-based superalloys, although these alloying elements have a significant influence on the properties of alloys.38–40

In this study, we performed first-principles calculations to investigate the effect of alloying elements (Ta, W, Re, Mo, and Co) on σIT of γ′-Ni3Al along the [001], [110] and [111] directions. The bonding nature of the alloying elements with host atoms, lattice evolution, and charge redistribution in the tensile process were analyzed.

2. Computational methods

For uniaxial tensile deformation, the tensile stress, σ, is given by2
 
image file: c6ra13017h-t1.tif(1)
where E is the total energy and V(ε) is the volume at the corresponding tensile strain ε. To simulate the stress–strain curve and determine the tensile strength, an incremental strain is imposed in the tensile direction. The atomic basis vectors perpendicular to the applied strain are simultaneously relaxed until the other stress components vanish. Furthermore, all the internal freedoms of the atom are relaxed at each step. Relaxation was performed until the forces on all of the atoms were less than 0.01 eV Å−1.

Based on the hypothesis of a dilute alloy, we used a single-impurity model41 to explore the strengthening effects of the alloying elements. Previous studies have shown that Ta, W, Re, and Mo prefer the Al site, whereas Co changes its site preference depending on the alloying composition in the γ′ phase.34,36,42,43 Therefore, the model with alloying element X (X = Ta, W, Re, Mo, and Co) substituting the Al atom was used. A 64-atom 2[1[1 with combining macron]0]a0 × 2[110]a0 × 2[001]a0 supercell was used for the σIT test of the [001] and [110] directions, and a 48-atom 2[1[1 with combining macron]0]a0 × [111]a0 × [11[2 with combining macron]]a0 supercell was used to calculate σIT in the [111] direction, as shown in Fig. 1(a) and (b). The sizes of these two supercells can avoid interactions between doping atoms.


image file: c6ra13017h-f1.tif
Fig. 1 (a) 64-Atom model used to test the ideal tensile processes along the [001] and [110] directions. (b) 48-Atom supercell used to test the ideal tensile processes along the [111] direction. Blue, purple, and green balls represent Ni, Al, and alloying element atom X (X = Ta, W, Re, Mo, and Co), respectively.

We used a total-energy method based on density functional theory44,45 implemented in the Vienna Ab initio Simulation Package code.46 The ion–electron interaction was described by the projector augmented wave method,47 and the generalized gradient approximation of Perdew et al.48 was used to describe the exchange–correction function. The plane wave cutoff was set to 350 eV. Following the Monkhorst–Pack scheme,49 5 × 5 × 7 and 8 × 5 × 6 k-point meshes were used for tensile tests of the 64-atom and 48-atom models, respectively. The energy convergence of electronic self-consistency was on the order of 10−5 eV.

Table 1 lists the calculated lattice parameter a0 and elastic properties of L12-Ni3Al along with the corresponding values from experiments and other DFT calculations. Furthermore, the effects of alloying elements on the elastic properties of γ′-Ni3Al are also tabulated in Table 2. A 32-atom 2[001]a0 × 2[010]a0 × 2[100]a0 supercell and a 9 × 9 × 9 k-points mesh are used for the calculations of the elastic constants of alloying systems. The lattice parameter a0 and bulk modulus B are obtained by fitting the energy and volume data to the Murnaghan equation of state.50 Under small strain, the elastic energy density of a solid is given by:51

 
image file: c6ra13017h-t2.tif(2)
where ΔE is the energy from the imposed strain increment having strain vector [e with combining right harpoon above (vector)] = (e1, e2, e3, e4, e5, e6), V0 is the equilibrium volume of the lattice cell at zero strain and Cij are the elastic constants. For the calculations of three independent elastic constants (C11, C12 and C44) of cubic lattice, sets of distortions (as listed in Table 3) with the δ parameters varying from −0.03 to 0.03 in steps of 0.005 are employed to fit the elastic constants. C11 and C12 are obtained by combining ΔE/V0 = 3(C11C12)δ2 and B = (C11 + 2C12)/3 (relationship observed in a cubic lattice according to a previous study52). The shear modulus adopts the arithmetic average G = (GV + GR)/2, where GV = (C11C12 + 3C44)/5 and GR = 5/(4S11 − 4S12 + 3S44) are the Voigt53 and Reuss54 bounds, respectively, and S11, S12 and S44 are the elastic compliances.52 The Young's modulus E and Poisson ratio ν are calculated as E = 9GB/(G + 3B) and ν = (3B − 2G)/(2(3B + G)), respectively. Our calculated equilibrium lattice parameter for Ni3Al of 3.567 Å is in good agreement with the experimental data.55,56 The calculated elastic constants and elastic moduli are also consistent with results from previous experiments55,56 and DFT calculations.14,36,37 When substituting the Al-atom with a refractory element, all of the alloying systems except Ni3(Al,Co) have increased lattice parameters, elastic constants and elastic moduli. The increased lattice parameters can be explained by the atomic radius of the X-atom (X = Ta, W, Re and Mo), which was larger than that of the Al-atom. Elastic constants have been considered as primary intrinsic mechanical properties of materials, and they are dominated by the chemical bonding and crystal symmetry. Following analyses of the density of electronic states and charge redistribution will shed light on the strengthening mechanism of these refractory elements on the elastic properties in γ′-Ni3Al.

Table 1 Calculated lattice parameter, elastic properties, and Poisson's ratio (ν) of Ni3Al along with experimental and other DFT calculated values
  Cal.a Exptb Exptc Cal.d Cal.e Cal.f
a This work.b Ref. 55.c Ref. 56.d Ref. 14.e Ref. 36.f Ref. 37.
a0 (Å) 3.567 3.57 3.57 3.568 3.579 3.56
B (GPa) 175.9 173 174.3 174.9 180.4 185 ± 6
C11 (GPa) 227.9 223 227 229.7 243.8 246 ± 6
C12 (GPa) 149.9 148 148 147.5 148.7 155 ± 6
C44 (GPa) 120.9 125 120 116.6 123.4 130 ± 0.0
G (GPa) 76.9 77 77 76.8 84.2 96 ± 0.0
E (GPa) 201.5 202 201 201 218.5  
G/B 0.44 0.45 0.44 0.44 0.47  
ν 0.309   0.308 0.308    


Table 2 Calculated lattice parameter, elastic properties, and Poisson's ratio (ν) for Ni3(Al,X)
  Ni3(Al,Ta) Ni3(Al,W) Ni3(Al,Re) Ni3(Al,Mo) Ni3(Al,Co) Ni3Al
a0 (Å) 3.579 3.573 3.571 3.573 3.559 3.567
B (GPa) 180.1 182.5 183.2 181.3 179.0 175.9
C11 (GPa) 237.5 241.9 243.9 239.7 231.0 227.9
C12 (GPa) 151.4 152.7 152.8 152.0 152.9 149.9
C44 (GPa) 122.5 126.7 127.9 124.6 118.1 120.9
G (GPa) 80.6 83.4 84.6 82.0 75.8 76.9
E (GPa) 210.4 217.1 220.0 213.8 199.4 201.4
G/B 0.45 0.46 0.46 0.45 0.42 0.44
ν 0.305 0.302 0.300 0.303 0.314 0.309


Table 3 The applied strain configurations employed to calculate the elastic constants of cubic and orthorhombic lattices
Lattice Strain configuration Energy–strain relation
Cubic phase (1) [e with combining right harpoon above (vector)] = (δ, δ, (1 + δ)2 − 1, 0, 0, 0) ΔE/V0 = 3(C11C12)δ2
(2) [e with combining right harpoon above (vector)] = (0, 0, 0, δ, δ, δ) image file: c6ra13017h-t4.tif
Orthorhombic phase (3) [e with combining right harpoon above (vector)] = (δ, 0, 0, 0, 0, 0) image file: c6ra13017h-t5.tif
(4) [e with combining right harpoon above (vector)] = (0, δ, 0, 0, 0, 0) image file: c6ra13017h-t6.tif
(5) [e with combining right harpoon above (vector)] = (0, 0, δ, 0, 0, 0) image file: c6ra13017h-t7.tif
(6) [e with combining right harpoon above (vector)] = (δ, δ, 0, 0, 0, 0) image file: c6ra13017h-t8.tif
(7) [e with combining right harpoon above (vector)] = (δ, 0, δ, 0, 0, 0) image file: c6ra13017h-t9.tif
(8) [e with combining right harpoon above (vector)] = (0, δ, δ, 0, 0, 0) image file: c6ra13017h-t10.tif
(9) [e with combining right harpoon above (vector)] = (0, 0, 0, δ, 0, 0) image file: c6ra13017h-t11.tif
(10) [e with combining right harpoon above (vector)] = (0, 0, 0, 0, δ, 0) image file: c6ra13017h-t12.tif
(11) [e with combining right harpoon above (vector)] = (0, 0, 0, 0, 0, δ) image file: c6ra13017h-t13.tif


Generally, the ideal strength of crystals refers to the first maximum point of the stress–strain curve. The corresponding stress at this point for a material is the maximum ideal tensile strength (σMIT). However, the lattice may become mechanically unstable prior to reaching the stress–strain peak in terms of violating the Born criteria of stability under uniaxial load.51,57 It is important to examine the mechanical stability of a defect-free lattice during the tensile tests as previously verified.58 The cubic lattice becomes tetragonal, orthorhombic and trigonal under the [001], [110] and [111] directional loading, respectively. The mechanical stability criteria of tetragonal, orthorhombic and trigonal lattices are given by51,52,59

 
image file: c6ra13017h-t3.tif(3)
 
C11 > 0, C22 > 0, C33 > 0, C44 > 0, C55 > 0, C66 > 0, (C11 + C22 − 2C12) > 0, (C11 + C33 − 2C13) > 0 and (C22 + C33 − 2C23) > 0, (4)
and
 
C11 > |C12|, (C11 + C12)C33 − 2C132 > 0 and (C11C12)C44 − 2C142 > 0, (5)
respectively. Herein, the elastic constants are calculated and the mechanical stability examined at every single strain until one of the stable criteria is violated during the tensile test. The stress value at which the mechanical instability occurs is the effective ideal tensile strength (σEIT) of a material. To calculate the nine independent elastic constants (C11, C22, C33, C44, C55, C66, C12, C13 and C23) of orthorhombic lattice, sets of distortions (as listed in Table 3) are employed to fit the elastic constants. For the tetragonal lattice (ab = c), the number of independent Cij reduce to six as C22 = C33, C55 = C66 and C12 = C13. Thus, for the tetragonal lattice, we employ no. 3, no. 4, no. 6, no. 8, no. 9 and no. 10 strain vectors of Table 3 to fit these six independent elastic constants.

3. Results and discussion

Fig. 2(a)–(c) show the calculated stress–strain relationships of Ni3(Al,X) (X = Ta, W, Re, Mo, Co, and Al) under uniaxial tension along the [001], [110], and [111] directions, respectively. The calculated elastic constants of Ni3Al at every strain during the [001], [110] and [111] tensile tests are shown in Fig. 3(a)–(c). As shown in Fig. 2(a), the stress of non-doped Ni3Al continuously increases with increasing strain until it reaches a maximum of 26.27 GPa at a strain of 32%, after which the stress decreases. However, according to Fig. 3(a), the lattice becomes mechanically unstable with C22 = C23 at a strain of 11% well below its peak point in the stress–strain curve. Thus, the σIT of pure Ni3Al, dictated by σEIT, is 12.93 GPa in the [001] direction. The scenario is similar to the [100] tension in a Ni crystal60 where the lattice bifurcates from tetragonal to an orthorhombic phase (C22 = C23) prior to its maximum point. When doped with alloying elements, the stress slightly increases before the yield point in the [001] direction. However, all of the doped systems yield at a smaller strain. Ni3Al doped with Re yields at a strain of 26% and the other alloying systems yield at a strain of 28%. Here, we label the loading at which the Born criteria of stability is violated by the dashed line in Fig. 3(a)–(c). Since the lattice fails as a result of mechanical instability prior to the peak point, σEIT locates the ideal strength during the [001] tensile test. As a result, the σIT values of the alloying systems slightly increase because of minimal enhanced strengthening before the yield point in the [001] direction.
image file: c6ra13017h-f2.tif
Fig. 2 (a)–(c) Stress as a function of tensile strain for Ni3(Al,X) under [001], [110] and [111] tension, respectively. X = Ta, W, Re, Mo, and Al, where X = Al represents non-doped Ni3Al. The vertical dashed lines mark the loading at which the lattice becomes unstable in terms of Born criteria.

image file: c6ra13017h-f3.tif
Fig. 3 (a)–(c) Elastic constants (upper panel) and corresponding Born criteria of stability (lower panel) of Ni3Al during the [001], [110] and [111] tensile tests, respectively. The vertical dashed lines mark the loading at which the Born criteria of stability is violated.

In terms of the [111] direction, the tensile stresses of doped Ni3Al also yield at a lower strain, as shown in Fig. 2(c). The lattice becomes mechanically unstable at a strain of 19% while the σMIT of Ni3Al is reached at a strain of 22% according to Fig. 3(c). Therefore, the ideal tensile strength of pure Ni3Al is 25.55 GPa in the [111] direction. Here, it is important to state that the supercell as shown in Fig. 1(b) was employed and treated as an orthorhombic lattice to calculate the elastic constants during the [111] tension. Certainly, the supercell still possesses six independent elastic constants, Cij, as shown in Fig. 3(c). Unlike the failure in the [001] tension, the mode of failure for the [111] tension is C44 = 0. Furthermore, the BCT stability zone (the mechanical stability zone in terms of Born criteria) includes the peak point from the σε curve for alloying systems (as shown in Fig. 2(c)). Therefore, the σIT of the substitutional systems slightly decrease in the [111] direction. Taking into consideration the Born criteria of stability during uniaxial load, Table 4 lists the σIT values and corresponding strains in all of the calculated directions. Note that the calculated σMIT of non-doped γ′-Ni3Al is in agreement with the results of Wang et al.61 who observed that the addition of Re can improve σMIT of γ′-Ni3Al by 1% and 6% in the [001] and [111] directions, respectively. The different models used in their study and the present work may be responsible for the discrepancy. Here, we used single-impurity models and the distance between impurities is farther than the fifth nearest neighbor. Such supercells can avoid interactions between doping atoms during tensile tests. Furthermore, the stress–strain curves in Fig. 2(a)–(c) are continuous and smooth, which indicates the reliability of the method used in this study.

Table 4 Calculated ideal tensile strength σIT with the corresponding engineering strain ε for Ni3(Al,X) in the [001], [110] and [111] directions
System [001] [110] [111]
σIT (GPa) ε σIT (GPa) ε σIT (GPa) ε
Ni3(Al,Ta) 13.42 0.11 8.14 0.08 23.89 0.16
Ni3(Al,W) 13.64 0.11 8.52 0.09 23.61 0.16
Ni3(Al,Re) 13.71 0.11 8.73 0.09 23.2 0.16
Ni3(Al,Mo) 13.28 0.11 8.43 0.09 23.64 0.16
Ni3(Al,Co) 12.98 0.11 7.57 0.08 22.53 0.14
Ni3Al 12.93 0.11 7.20 0.08 25.55 0.19


The stress–strain relationship in the [110] direction is different from those in the [001] and [111] directions. As shown in Fig. 2(a)–(c), the [001] and [111] directions can be considered as strong orientations with σIT as large as 12 GPa. However, the [110] direction is obviously the weakest direction for γ′-Ni3Al with σIT yielding only 7.2 GPa. In the C11 + C33 = 2C13 mode (as shown in Fig. 3(b)), the lattice remains true to the Born criteria of stability until a strain of 9%, and thereafter fails upon increasing strain in the [110] tension for non-doped, Ta-doped and Co-doped systems. For Ni3(Al,W), Ni3(Al,Re) and Ni3(Al,Mo), the point at which mechanical instability occurs is immediately prior to the yield point. Addition of alloying elements X (X = Ta, W, Re, and Mo) can considerably improve the tensile stress and σIT in the [110] direction, and Re exhibits the greatest improvement, as shown in Fig. 2(b). Note that doping with Co has a negligible effect on the stress of the γ′-Ni3Al phase. As listed in Table 4, the ability of the alloying elements to increase the σIT are in the order: Re > W > Mo > Ta > Co. Compared with pure Ni3Al, the σMIT of Ni3(Al,Re) improves from 7.2 to 8.75 GPa, an increase of 22%. Wang et al.61 found that addition of Re can increase σIT by 51% in the [110] direction. This larger increase is because of the higher alloying element concentration in their model.

According to the above results in relation to the mechanical stability in terms of Born criteria examinations, the σIT of L12-Ni3Al along the [001], [110] and [111] directions are determined to be 12.93 GPa, 7.20 GPa and 25.55 GPa, respectively. The [110] orientation is the weakest uniaxial tensile direction. It is important to mention here that we do not perform phonon calculations to verify the phonon stability during the tensile processes. In fact, phonon-induced instabilities may occur significantly prior to the stress–strain peak, similar to the scenario undergoing during the tension and 〈112〉{111} shear for an Al crystal.8 Consequently, our predictions may overestimate the ideal strength.

The effect of alloying elements on σIT of Ni3Al exhibits obvious directionality. The orientation dependence of the strengthening mechanism arises from interatomic interactions that vary significantly in different directions in Ni3Al. Analysis of charge redistribution will reveal these interactions between impurities and host atoms. Impurities have the strongest effect on the [110] direction. Hence, we will highlight the electronic mechanism of alloying elements during [110] tensile deformation in later analyses.

The dependence of the lattice parameters under [110] uniaxial strain is shown in Fig. 4. With uniformly increasing tensile strain (i.e., increasing lattice parameter a), c decreases and b remains almost constant. When the supercell of pure Ni3Al is deformed by 18%, the c lattice parameter is equal to half of a (see Fig. 4). Therefore, the distance between an Al atom and the first nearest neighbor (FNN) Ni atom along the [110] direction is equivalent to the distance between nearest Al atoms along the [001] direction, as shown in the inset of Fig. 5. Accordingly, at this point, the response of the energy under [110] tension has a saddle point, as shown in Fig. 5, which indicates that the new triclinic structure is an unstable “phase”. Consequently, the stress reaches the second zero-stress point according to eqn (1) and attains its maximum at an early strain of about half of 18%, which is consistent with the stress–strain relationship shown in Fig. 2(b). In contrast to the [110] loading direction, the energies monotonically increase between ε = 0.00 and ε = 0.50 under tension along the [001] and [111] directions (Fig. 5). It can be concluded that the σMIT of the [110] tension being the lowest σMIT among the three characteristic directional loading is an intrinsic characteristic of the L12 structure (space group: Pm[3 with combining macron]m).


image file: c6ra13017h-f4.tif
Fig. 4 Variation of the lattice parameters of Ni3(Al,X) during the [110] tensile test. X = Ta, W, Re, Mo, Co, and Al, where X = Al represents non-doped Ni3Al.

image file: c6ra13017h-f5.tif
Fig. 5 Response of the energy of L12-Ni3Al to strain under [001], [110], and [111] tensile deformation. The dashed arrows indicate the onset strain for the second zero-stress and the inset shows the structure at this point.

Fig. 4 also shows the influence of alloying elements on variation of the lattice parameters during the [110] tensile test. Doping with Co has a negligible effect on variation of the lattice parameters. Fig. 4 shows that Ta, W, Re, and Mo can considerably decrease the rate of variation of the b and c lattice parameters of γ′-Ni3Al. It is expected that Ta, W, Re, and Mo can improve the mechanical strength and deformation resistance of alloys. These results are consistent with the stress–strain relationships (Fig. 2(b)), and agree well with previous experiments.38,40,62,63

Although Co has a negligible effect on the stress of γ′-Ni3Al, the other doping elements (i.e., Ta, W, Re, and Mo) can enhance σIT in the weakest tensile direction. To reveal the strengthening mechanism, we investigated the density of states (DOS) of these alloying systems. Fig. 6(a)–(e) show the d-orbital partial DOS of doping element X and its FNN Ni atom along the [110] direction. The partial DOS of pure Ni3Al are also plotted in Fig. 6(f) for comparison. As shown in Fig. 6(a)–(e), all of the alloying elements except Co have a prominent feature: the noticeable bonding and antibonding region of X-d (X = Ta, W, Re, and Mo) orbitals is well separated by a deep valley near the Fermi level. This feature indicates that these alloying elements can stabilize the system by substituting for the Al atom in γ′-Ni3Al.64 Additionally, there are strong interactions between X and the host atom Ni in the doping systems by d–d hybridization (see Fig. 6). Here, we indicate the resonant hybridization peaks by dotted lines in Fig. 6(a)–(f). Interaction between Re and Ni shows the greatest hybridization, followed by W–Ni, Mo–Ni, and Ta–Ni. The partial DOS of Ni3(Al,Co) behaves in a different way: the Fermi level is located at the peak of the Co-d DOS and the interaction between Co-d and Ni-d is weak. It is expected that Co will improve the ductility of Ni3Al rather than the mechanical strength. Consequently, addition of Co has a negligible effect on the response of the tensile stress to strain during the [110] deformation test (see Fig. 2(b)).


image file: c6ra13017h-f6.tif
Fig. 6 (a)–(e) d-Orbital partial density of states (DOS) for doping an X atom and its first nearest neighbor (FNN) Ni-atom along the [110] direction in 64-atom Ni3(Al,Ni) at ε = 0.00 (X = Ta, W, Re, Mo and Co). (f) Partial DOS of the central Al atom and its FNN Ni atom in pure Ni3Al at ε = 0.00. The dashed and dotted lines indicate the Fermi level and the locations of resonant hybridization peaks, respectively.

We next investigated the charge density difference (Δρ) of Ni3(Al,X) in the process of tensile deformation. Charge redistribution induced by impurities can directly reflect the bonding nature between alloying atoms and host atoms. The Δρ between the impurity atom and its FNN host atoms (twelve Ni atoms) in real space and Δρ along the [110] direction in [110] tensile deformation are shown in Fig. 7. Electrons flow from both Ni and X (X = Ta, W, Re, and Mo) atoms into covalent-like Ni–X bonds (Fig. 7(a′)–(d′)). Charge accumulation shows robust directionality, mainly appearing along the 〈110〉 direction for X-doped systems (X = Ta, W, Re, and Mo), as shown in Fig. 7(a)–(d). This suggests that interactions between these impurities and Ni atoms exhibit strong directionality, which is the origin of their directional strengthening effect on the σIT in the γ′-Ni3Al phase.


image file: c6ra13017h-f7.tif
Fig. 7 (a)–(f) Charge density difference (isovalues ± 0.0672 e Å−3) in real space at zero strain. The yellow (cyan) isosurface denotes charge accumulation (depletion). (a′)–(f′) Δρ along the [110] direction at ε = 0.00 and ε = 0.08 during the [110] tensile test.

Moreover, Δρ is quite different dependent upon the alloying system. As shown in Fig. 7(b) and (c), Δρ in Re-doped and W-doped systems exhibit similar features. However, although Ta, W and Re are the adjacent element in the sixth period, Ta has a considerably weaker effect than W and Re (see Table 4) on improving σIT in the γ′-Ni3Al phase. Fig. 7(a–c) reveals the origin of the strengthening effect. Charge accumulation in the W-doped and Re-doped systems is stronger than in the Ta-doped system. Interaction of W–Ni and Re–Ni can effectively improve the mechanical strength, which agrees with experimental investigations.38,62 As shown in Fig. 7(d), Δρ in the Mo-doped system shows stronger charge accumulation than the Ta-doped system but weaker than the W-doped and Re-doped system, which is consistent with previous calculations of the ideal tensile stress (Table 4). Unlike the other alloying systems, the missing charge accumulation at the isovalue of 0.0672 e Å−3 in the Co-doped system (Fig. 7(e)) suggests more metallic bonding character between Co and FNN Ni atoms. It is expected that doping with Co can improve the malleability and ductility in nickel-based alloys rather than the mechanical strength. Al has an electronic structure of 3s23p1 with only three valence electrons, which greatly contributes to it having the smallest σIT among all of the investigated systems. Accordingly, compared with alloying elements, Δρ near the Al atom is very small in pure Ni3Al (see Fig. 7(f′)). In all of the systems, with increasing tensile strain, the distances between atoms along the [110] direction increases and Δρ becomes smoother, as shown in Fig. 7(a′)–(f′).

4. Conclusions

We have investigated the influence of alloying elements on the ideal tensile strength and charge redistribution of γ′-Ni3Al using first-principles calculations. Our results show that through examinations of mechanical stability in terms of Born criteria for all calculated orientations, the σIT of L12-Ni3Al along [001], [110] and [111] directions is determined to be 12.93 GPa, 7.20 GPa and 25.55 GPa, respectively. Doping with Ta, W, Re, Mo, and Co slightly increases σIT along the [001] direction and decreases σIT in the [111] tension, however, σIT along the [110] direction is increased by 0.94, 1.32, 1.53, 1.23, and 0.37 GPa, respectively. The directional strengthening effect arises from directional interactions between impurities and host atoms. Analysis of the lattice parameters during the tensile tests shows that W, Re, Mo, and Ta can improve the deformation resistance of nickel-based alloys and Co has a negligible effect on variation of the lattice parameters. The DOS of the alloying atom and its FNN Ni-atom along the [110] orientation in the 64-atom supercell at zero strain, and Δρ of Ni3(Al,X) during the [110] tensile deformation were also calculated. The d-orbital partial DOS indicate that Ta, W, Re, and Mo can enhance the structural stability of the Ni3Al phase when substituted for an Al atom, and interactions between impurities and host atoms are by d–d hybridization. Charge redistribution of these alloying systems shows that charges mainly gather along the 〈110〉 direction for X-doped systems, and charge accumulation in the W-doped and Re-doped systems is the strongest, followed by Mo-doped, Ta-doped, and Co-doped alloys. Our results are of importance to reveal the strengthening mechanisms of Ta, W, Mo, and Co in the γ′-Ni3Al phase for tensile deformation, which has not previously been investigated using ab initio calculations.

Acknowledgements

We are grateful to B. K. Lu, X. X. Yu and P. F. Guan for beneficial discussions. This work was supported by the National Basic Research Program of China (Grant No. 2011CB606402). The simulations were performed using the “Explorer 100” cluster system of Tsinghua National Laboratory for Information Science and Technology, Beijing, China.

References

  1. A. Kelly and N. H. Macmillan, Strong Solids, Clarendon Press, Oxford, 3rd edn, 1986 Search PubMed.
  2. D. Roundy, C. R. Krenn, M. L. Cohen and J. W. Morris Jr, Phys. Rev. Lett., 1999, 82, 2713 CrossRef CAS.
  3. A. Gouldstone, H. J. Koh, K. Y. Zeng, A. E. Giannakopoulos and S. Suresh, Acta Mater., 2000, 48, 2277 CrossRef CAS.
  4. C. R. Krenn, D. Roundy, M. L. Cohen, D. C. Chrzan and J. W. Morris Jr, Phys. Rev. B: Condens. Matter Mater. Phys., 2002, 65, 134111 CrossRef.
  5. M. Šob, M. Friák, D. Legut, J. Fiala and V. Vitek, Mater. Sci. Eng., A, 2004, 387–389, 148 CrossRef.
  6. M. Černý and J. Pokluda, Phys. Rev. B: Condens. Matter Mater. Phys., 2010, 82, 174106 CrossRef.
  7. D. Roundy, C. R. Krenn, M. L. Cohen and J. W. Morris Jr, Philos. Mag. A, 2001, 81, 1725 CAS.
  8. D. M. Clatterbuck, C. R. Krenn, M. L. Cohen and J. W. Morris Jr, Phys. Rev. Lett., 2003, 91, 135501 CrossRef CAS PubMed.
  9. S. Ogata, J. Li and S. Yip, Science, 2002, 298, 807 CrossRef CAS PubMed.
  10. D. M. Clatterbuck, D. C Chrzan and J. W Morris Jr, Acta Metall., 2003, 51, 2271 CAS.
  11. S. Ogata, J. Li, N. Hirosaki, Y. Shibutani and S. Yip, Phys. Rev. B: Condens. Matter Mater. Phys., 2004, 70, 104104 CrossRef.
  12. Y. L. Liu, Y. Zhang, H. B. Zhou, G. H. Lu and M. Kohyama, J. Phys.: Condens. Matter, 2008, 20, 335216 CrossRef.
  13. T. Li, J. W. Morris Jr and D. C. Chrzan, Phys. Rev. B: Condens. Matter Mater. Phys., 2004, 70, 054107 CrossRef.
  14. Y. J. Wang and C. Y. Wang, Appl. Phys. Lett., 2009, 94, 261909 CrossRef.
  15. C. Kocer, N. Hirosaki and S. Ogata, Phys. Rev. B: Condens. Matter Mater. Phys., 2003, 67, 035210 CrossRef.
  16. X. L. Wang, K. Bao, F. B. Tian, X. Meng, C. B. Chen, B. W. Dong, D. Li, B. B. Liu and T. Cui, J. Chem. Phys., 2010, 133, 044512 CrossRef PubMed.
  17. X. X. Zhang, Y. C. Wang, J. Lv, C. Y. Zhu, Q. Li, M. Zhang, Q. Li and Y. M. Ma, J. Chem. Phys., 2013, 138, 114101 CrossRef PubMed.
  18. F. Gao, J. Zhang and Z. Li, RSC Adv., 2014, 4, 32345 RSC.
  19. M. J. Xing, B. H. Li, Z. T. Yu and Q. Chen, RSC Adv., 2016, 6, 32740 RSC.
  20. X. L. Hu, Y. Zhang, G. H. Lu and T. Wang, J. Phys.: Condens. Matter, 2009, 21, 025402 CrossRef PubMed.
  21. W. Xu, Y. Wang, C. Wang, X. Liu and Z. K. Liu, Scr. Mater., 2015, 100, 5 CrossRef CAS.
  22. G. H. Lu, Y. Zhang, S. Deng, T. Wang, M. Kohyama, R. Yamamoto, F. Liu, K. Horikawa and M. Kanno, Phys. Rev. B: Condens. Matter Mater. Phys., 2006, 73, 224115 CrossRef.
  23. D. Yin, Y. Yang, X. Peng, Y. Qin and Z. Wang, Ceram. Int., 2014, 40, 14453 CrossRef CAS.
  24. S. L. Shang, W. Y. Wang, Y. Wang, Y. Du, J. X. Zhang, A. D. Patel and Z. K. Liu, J. Phys.: Condens. Matter, 2012, 24, 155402 CrossRef CAS PubMed.
  25. X. Wu and C. Wang, RSC Adv., 2016, 6, 20551 RSC.
  26. C. T. Sims, N. S. Stoloff and W. C. Hagel, Superalloy II, John Wiley & Sons, New York, 1987 Search PubMed.
  27. R. C. Reed, The Superalloys: Fundamentals and Applications, Cambridge University Press, New York, 2006 Search PubMed.
  28. E. A. Loria, Superalloy 718: Metallurgy and Applications, TMS, Warrendale, PA, 1989 Search PubMed.
  29. H. P. Karnthaler, E. T. Mühlbacher and C. Rentenberger, Acta Mater., 1996, 44, 547 CrossRef CAS.
  30. T. M. Pollock and S. Tin, J. Propul. Power, 2006, 22, 361 CrossRef CAS.
  31. R. C. Reed, T. Tao and N. Warnken, Acta Mater., 2009, 57, 5898 CrossRef CAS.
  32. S. L. Liu and C. Y. Wang, RSC Adv., 2015, 5, 52473 RSC.
  33. C. Y. Geng, C. Y. Wang and T. Yu, Acta Mater., 2004, 52, 5427 CrossRef CAS.
  34. C. Jiang and B. Gleeson, Scr. Mater., 2006, 55, 433 CrossRef CAS.
  35. Y. J. Wang and C. Y. Wang, J. Appl. Phys., 2008, 104, 013109 CrossRef.
  36. Q. Wu and S. Li, Comput. Mater. Sci., 2012, 53, 436 CrossRef CAS.
  37. A. Kumar, A. Chernatynskiy, M. Hong, S. R. Phillpot and S. B. Sinnott, Comput. Mater. Sci., 2015, 101, 39 CrossRef CAS.
  38. M. V. Nathal and L. J. Ebert, Metall. Trans. A, 1985, 16, 1863 CrossRef.
  39. P. Carron and T. Khan, Aerosp. Sci. Technol., 1999, 3, 513 CrossRef.
  40. E. Fleischmann, M. K. Miller, E. Affeldt and U. Glatzel, Acta Mater., 2015, 87, 350 CrossRef CAS.
  41. C. Y. Wang, S. Y. Liu and L. G. Han, Phys. Rev. B: Condens. Matter Mater. Phys., 1990, 41, 1359 CrossRef CAS.
  42. A. V. Ruban and H. L. Skriver, Phys. Rev. B: Condens. Matter Mater. Phys., 1997, 55, 856 CrossRef CAS.
  43. A. V. Ruban, V. A. Popov, V. K. Portnoi and V. I. Bogdanov, Philos. Mag., 2014, 94, 20 CrossRef CAS.
  44. P. Hohenberg and W. Kohn, Phys. Rev., 1964, 136, B864 CrossRef.
  45. W. Kohn and L. J. Sham, Phys. Rev., 1965, 140, A1133 CrossRef.
  46. G. Kresse and J. Furthmüller, Phys. Rev. B: Condens. Matter Mater. Phys., 1996, 54, 11169 CrossRef CAS.
  47. G. Kresse and J. Joubert, Phys. Rev. B: Condens. Matter Mater. Phys., 1999, 59, 1758 CrossRef CAS.
  48. J. P. Perdew, K. Burke and M. Ernzerhof, Phys. Rev. Lett., 1996, 77, 3865 CrossRef CAS PubMed.
  49. H. J. Monkhorst and J. D. Pack, Phys. Rev. B: Solid State, 1976, 13, 5188 CrossRef.
  50. F. D. Murnaghan, Proc. Natl. Acad. Sci. U. S. A., 1944, 30, 244 CrossRef CAS.
  51. F. Milstein, Phys. Rev. B: Solid State, 1971, 3, 1130 CrossRef.
  52. J. F. Nye, Physical Properties of Crystals, Clarendon Press, Oxford, 1985 Search PubMed.
  53. W. Voigt, Lehrbuch der Kristallphysik, Teubner Press, Leipzig, 1928 Search PubMed.
  54. A. Reuss, Z. Angew. Math. Mech., 1929, 9, 49 CrossRef CAS.
  55. F. Kayser and C. Stassis, Phys. Status Solidi A, 1981, 64, 335 CrossRef CAS.
  56. M. J. Mehl, B. M. Klein and D. A. Papaconstantopoulos, Intermetallic Compounds: Principles and Practice, Wiley, New York, 1995 Search PubMed.
  57. R. Hill and F. Milstein, Phys. Rev. B: Solid State, 1977, 15, 3087 CrossRef CAS.
  58. A. Breidi, S. G. Fries and A. V. Ruban, Phys. Rev. B, 2016, 93, 144106 CrossRef.
  59. Z. J. Wu, E. J. Zhao, H. P. Xiang, X. F. Hao, X. J. Liu and J. Meng, Phys. Rev. B: Condens. Matter Mater. Phys., 2007, 76, 054115 CrossRef.
  60. F. Milstein and B. Farber, Phys. Rev. Lett., 1980, 44, 277 CrossRef CAS.
  61. Y. J. Wang and C. Y. Wang, Scr. Mater., 2009, 61, 197 CrossRef CAS.
  62. A. C. Yeh and S. Tin, Scr. Mater., 2005, 52, 519 CrossRef CAS.
  63. M. Fahrmann, W. Hermann, E. Fahrmann, A. Boegli, T. M. Pollock and H. G. Sockel, Mater. Sci. Eng., A, 1999, 260, 212 CrossRef.
  64. J. H. Xu, T. Oguchi and A. J. Freeman, Phys. Rev. B: Condens. Matter Mater. Phys., 1987, 36, 4186 CrossRef CAS.

This journal is © The Royal Society of Chemistry 2016
Click here to see how this site uses Cookies. View our privacy policy here.