Inhibitory effect of MnCr2O4 spinel coating on coke formation during light naphtha thermal cracking

Binbin Bao, Jinglei Liu*, Hong Xu, Bo Liu and Weifeng Zhang
State-Key Laboratory of Chemical Engineering, School of Mechanical and Power Engineering, East China University of Science and Technology, Shanghai, 200237, China. E-mail: ljlei@ecust.edu.cn; Fax: +86 021 64253810; Tel: +86 021 64251315

Received 19th May 2016 , Accepted 14th July 2016

First published on 14th July 2016


Abstract

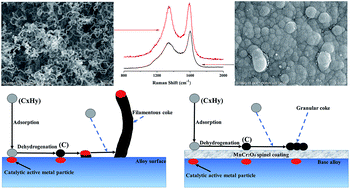
In this paper, MnCr2O4 spinel coating was fabricated on a HP40 alloy by pack cementation and subsequent thermal oxidation. The spinel coating was dense and uniform, and was applied to inhibit coke formation during light naphtha thermal cracking. Coking behaviors on the HP40 alloy and spinel coated alloy were compared under the same conditions. The anti-coking rate of the MnCr2O4 spinel coating exceeded 60% during light naphtha thermal cracking. Lots of filamentous coke formed on the uncoated HP40 alloy, but catalytic coke was completely inhibited on the MnCr2O4 spinel coated alloy resulting in a granular appearance of coke. Raman spectra analyses indicated that coke deposited on the surface of the spinel coating had a larger proportion of disordered carbon and amorphous carbon compared with that on the uncoated HP40 alloy.

1. Introduction

Hydrocarbon thermal cracking is the major process to produce olefins and aromatics, and the process is usually carried out in cracking coils made of Fe–Cr–Ni alloys. Hydrocarbons can adsorb on the surface of alloys and then lose hydrogen atoms during high temperature thermal cracking of hydrocarbons.1–4 Afterward, Fe and Ni particles will catalyze the growth of the remaining carbons and be lifted by the growing filamentous carbon.5,6 Coke filaments will keep growing and more coking precursors will adsorb and then be incorporated in the coke layer. Therefore, metal dusting and coking become serious problems for Fe–Cr–Ni alloys used as cracking coils. The coke adhering on the surface of the alloys can reduce the inner diameter of the coils and hamper heat transfer from cracking coils to pyrolysis gas, resulting in pressure drop and higher coils temperature. The coke on the surface can also react with surface metal, so as to deteriorate the overall performance of the coils. Moreover, decoking process has to be conducted periodically by air/steam mixture, leading to reduction of ethylene yield and lifetime of the coils.1,7

It has been accepted that coke formation during hydrocarbons thermal cracking is mainly assigned to three mechanisms: catalytic coking, radical coking and polymerized coking.1–4,8 Wherein, catalytic coke formation is the dominant coking mechanism at the initial stage of coking and is the main cause of metal dusting. Consequently, protecting Fe and Ni elements from hydrocarbons is an efficient method to avoid metal dusting and inhibit coke formation during high temperature thermal cracking. Recently, inert coating techniques have drawn more and more attention, and various coatings for anti-coking has been developed, such as glass,9 Al2O3,10 SiO2/S,1,3 TiN6 and rutile TiO2.11 The results show that the coatings can efficiently inhibit coke formation.

The main oxide-forming elements in Fe–Cr–Ni alloys are Fe, Ni, Cr, Mn and Si. The oxide growth and composition depends on the oxygen affinity and diffusivity of these elements. Selective oxidation of Mn and Cr can be realized under proper low oxygen partial pressure utilizing the higher oxygen affinity of Mn and Cr.12–14 Moreover, it has been proved that MnCr2O4 spinel is more stable than Cr2O3 in high temperature carbonaceous environment and shows better resistance of carburization, hence MnCr2O4 spinel is a favorable material to inhibit metal dusting and coking.12–14 Shao et al.15 oxidized HK 40 alloy under low oxygen partial pressure to form oxide scales on the alloy, which were only about 1 μm thickness. The oxide scales are composed of MnCr2O4 and Cr2O3, and exhibiting both granular and blade structures. However, MnCr2O4 spinel is also found to have a low rate of carbide conversion under high temperature hydrocarbon cracking environment,13 so the thin protective spinel layer is inclined to be damaged and gradually loses its protection due to the small thickness, and the blade type structures may lead to coke accumulation.

In this paper, MnCr2O4 spinel coating with favorable thickness was fabricated on HP40 alloy for the first time. The characters of the spinel coating were examined. The inhibitory effect of the coating on coking was researched under light naphtha thermal cracking condition which is similar to industrial ethylene production.

2. Experimental

2.1 Preparation of MnCr2O4 spinel coating

Samples in the size of 10 mm × 10 mm × 3 mm were cut from a HP40 alloy tube by wire cutting. The samples were ground with 600 grits SiC abrasive papers, and then cleaned ultrasonically in acetone before use. The composition of selected HP40 alloy is listed in Table 1.
Table 1 The composition of selected HP40 alloy
Element Ni Cr Mn Si C Nb Fe
Content (wt%) 34.82 24.98 1.11 1.56 0.471 0.955 35.67


Firstly, the samples were successively dealt in Mn-base and Cr-base pack mixture by pack cementation process. The process was carried out as follows: pack cementation powders were mixed and packed into a retort, then the samples were placed in the center with powders around. Afterward, the retort was sealed and then heated in a muffle furnace for several hours.

The pack-cemented samples were placed in a reaction tube and heated under a low oxygen partial pressure atmosphere created by H2–H2O gas mixture. The H2–H2O gas mixture was generated by bubbling H2 through distilled water at controlled temperature (T = 20 °C), and subsequently introduced into the reaction tube. After cooling, MnCr2O4 spinel coating formed on the HP40 alloy samples.

2.2 Characterization of MnCr2O4 spinel coating and its anti-coking property

The morphology and chemical composition of as-fabricated spinel coating were characterized by scanning electron microscope (SEM) and energy dispersive X-ray spectroscopy (EDX), respectively. The phase composition of the coating was detected by X-ray diffraction (XRD). Raman spectrum was also adopted to analyze the surface phase structures of the coating, which was measured with a laser Raman spectrometer, utilizing the 514.5 nm line of an argon ion laser at room temperature, and recording in the range of 120–1000 cm−1. The cross-sectional morphology and elemental distribution of the coating were examined by SEM and EDX line scan.

The anti-coking property of the coating was evaluated by thermal cracking of light naphtha. Fig. 1 exhibits a schematic diagram of coking experimental apparatus. The coking experiments were carried out in a quartz reaction tube placed vertically in a heating furnace. The reaction tube was firstly purified by N2 for several minutes, then feedstock and steam were introduced into the reaction tube for thermal cracking. The thermal cracking conditions were as follows: the cracking temperature was 850 °C, the flow rates of light naphtha and steam were 180 and 60 ml h−1, the cracking duration was from 1 h to 6 h, respectively. The amounts of coke were calculated by weighing the samples before and after coking. Three coking experiments under the same condition were repeated, and the mean value of the three calculation was considered as the final result. The composition of light naphtha used in the experiments is shown in Table 2. To be coincide with the practice, the blank samples were oxidized in air for 14 h at 750 °C before coking.2,16


image file: c6ra13009g-f1.tif
Fig. 1 Schematic diagram of coking experimental apparatus: (1) DI water; (2) naphtha; (3) metering pump; (4) needle valve; (5) temperature controller; (6) preheating furnace; (7) three-way valve; (8) gas flowmeter; (9) cracking furnace; (10) quartz fiber; (11) sample; (12) water cooling; (13) water condensate tank; (14) heavy hydrocarbon condensate tank; (15) ball valve; (16) purification plant.
Table 2 Composition of light naphtha
Carbon number Mass concentration (%)
N-Alkane Isoparaffin Olefin Naphthenes Aromatics
5 2.84 1.74 0.16 0.67
6 9.08 22.98 0.79 5.22 0.02
7 3.77 17.23 0.35 10.51 0.35
8 1.06 9.96 11.08
9 0.32 1.56 0.29
Total 17.07 53.47 1.3 27.78 0.37


The coke morphologies and structures formed after different coking time were characterized by SEM and Raman spectra, respectively. Raman spectra of the cokes were recorded in the range of 800–2000 cm−1. The anti-coking rate J of the MnCr2O4 spinel coating was calculated as the following form:

 
image file: c6ra13009g-t1.tif(1)
where M is the amount of coke formed on the blank samples, and the m is the amount of coke formed on the samples coated with spinel coating.

3. Results and discussion

3.1 Characters of MnCr2O4 spinel coating

The phase structure of the coating were characterized by XRD, and the results are shown in Fig. 2(a). The XRD pattern displays a series of diffraction peaks, and the peaks are assigned to various compositions. It can be found that the coating is composed of MnCr2O4 spinel phase, Cr2O3 phase and SiO2 phase. The calculated intensity ratio of MnCr2O4 spinel and other formed oxides is 7.256 according to the XRD pattern, indicating that MnCr2O4 spinel is the majority phase. The phase structures of the outer surface layer of the coating can be analyzed in Raman spectrum which can provide important structural information of thin films.17,18 Fig. 2(b) shows the Raman spectrum of the coating, two obvious peaks at 511 cm−1 and 685 cm−1 appears in the spectrum. The peak at 511 cm−1 is associated with Eg and E2g symmetries, and the peak at 685 cm−1 can be assigned to the A1g mode, which is generated by the bonds in Cr3+O6 octahedral.19 As reported previously,19–21 these peaks can be attributed to MnCr2O4 spinel. The results indicate that neither Cr2O3 nor SiO2 phase existed at the surface of the coating, and the coated surface is completely composed of MnCr2O4 spinel.
image file: c6ra13009g-f2.tif
Fig. 2 XRD pattern and Raman spectrum of the prepared coating: (a) XRD pattern; (b) Raman spectrum.

Fig. 3 shows the SEM image and EDX analysis of the MnCr2O4 spinel coating formed on HP40 alloy. As shown in Fig. 3(a), the top-view morphology of MnCr2O4 spinel coating shows that the coating is homogeneous and dense, and octahedron crystal structures present on the surface with some small crystals scatter over. Fig. 3(b) shows that only Mn, Cr and O elements present on the surface of coating, and the ratio of Mn, Cr and O is very close to 1[thin space (1/6-em)]:[thin space (1/6-em)]2[thin space (1/6-em)]:[thin space (1/6-em)]4, which is coincident with the atomic ratio in the chemical formula of MnCr2O4. MnCr2O4 spinel crystals growth under low oxygen partial pressure could follow the steps: firstly, Cr elements are initially oxidized to form Cr2O3 on alloy surface in the experimental atmosphere and; secondly, Mn elements quickly diffuse outwards and form MnO; thirdly, Cr2O3 and MnO react with each other and form MnCr2O4 spinel according to the reaction Cr2O3 + MnO → MnCr2O4.13–15


image file: c6ra13009g-f3.tif
Fig. 3 SEM image and EDX analysis of the coating surface: (a) SEM image; (b) EDX analysis.

Fig. 4 shows the SEM image and elemental distribution of the cross-section of coating. The cross-section image displays a dense and uniform coating and a discrete transition layer. The results of EDX line scan demonstrate that the coating is composed of Mn, Cr, O elements, and its thickness is about 7 μm. The results also reveal that a SiO2 transition layer exists beneath MnCr2O4 spinel coating. The solubility of Si in Cr2O3 is very low, so that Si elements are rejected in base alloy and SiO2 formed under MnCr2O4 spinel coating.13–15 Meanwhile, the elemental distribution profile indicates that the mass concentration of Mn element under the coating is obviously higher than that in base alloy, and Cr-rich regions exist under the coating, which originates from pack cementation process and contributes to the spinel coating growth.


image file: c6ra13009g-f4.tif
Fig. 4 SEM image and EDX line scan of the cross-section of the coating: (a) SEM image; (b) EDX line scan.

3.2 Inhibitory effect of MnCr2O4 spinel coating on coke formation

A series of coking experiments were carried out on both MnCr2O4 spinel coated and uncoated samples, the coke amounts of these samples and corresponding anti-coking rates of MnCr2O4 spinel coating are shown in Fig. 5. The mass of coke deposited on uncoated samples during 1 h thermal cracking is about 1.88 mg, while that on MnCr2O4 spinel coated samples is only about 0.62 mg. The mass of coke deposited on either MnCr2O4 spinel coated or uncoated samples increases with coking duration, but coke amounts deposited on uncoated samples increases faster. The anti-coking rate of MnCr2O4 spinel coating decreases slightly when coking duration is more than 1 h, however, all of the anti-coking rates of MnCr2O4 spinel coating in coking experiments exceeds 60%, indicating good anti-coking property of MnCr2O4 spinel coating. At the beginning of coke formation, catalytic coke formation is the main coking mechanism on uncoated samples, while only noncatalytic coke forms on coated samples, hence coking rate on uncoated samples is much higher than that on coated samples. With the increase of cracking time, filamentous coke catalyzed by Fe and Ni atoms will be gradually covered by noncatalytic coke, resulting in the inhibition of coke filaments growth. Under this consideration, coking rate on uncoated samples will be reduced and the anti-coking rate will also decrease. However, structure of coke layer on uncoated samples is different from that coated samples, coke deposited on coated samples is lower in density and maybe easier to peal off under thermal cracking environment. Therefore, MnCr2O4 spinel coating maintains high anti-coking rate with increasing cracking time.
image file: c6ra13009g-f5.tif
Fig. 5 Coking rates of both coated and uncoated samples and corresponding anti-coking rates of MnCr2O4 spinel coating.

Fig. 6 displays the morphologies of coke deposited on MnCr2O4 spinel coated samples as well as uncoated samples after 1 h thermal cracking. A lot of filamentous coke can be seen over the uncoated sample (Fig. 6(a) and (b)), which is catalyzed by Fe or Ni particles extracted from tube alloy. As previously studied,1–3,6 catalytic coking is the majority mechanism at the initial stage of coking on alloy surface. Only granular coke can been found on MnCr2O4 spinel coated sample (Fig. 6(c) and (d)), and granular appearance is the typical characteristic of radical coke and polymerized coke, which is also observed on other coatings by many researchers.1,6,11


image file: c6ra13009g-f6.tif
Fig. 6 SEM images of coke deposited after 1 h thermal cracking: (a and b) uncoated sample; (c and d) MnCr2O4 spinel coated sample.

The different appearance between the two coke morphologies originates from different coking mechanisms. Fig. 7 shows a schematic diagram of simplified mechanism for coke formation on uncoated and coated alloy surface after the initial stage of light naphtha thermal cracking. Fig. 7(a) presents the mechanism of filamentous coke formation on uncoated sample, which can be described as follows: firstly, coking precursors (hydrocarbon molecules) adsorb on alloy surface and convert to carbon on the surface through dehydrogenation; secondly, the deposited carbon reacts with catalytic active metal particles (Fe, Ni particles) and forms Fe or Ni carbides; finally, the carbides decompose into carbon and metal atoms or metal atomic clusters, and thus a catalytic reaction cycle forms. According to catalytic reaction cycles, coke filaments grow up with continuous accumulation of carbon, and the active metal atoms are lifted at the top of coke filaments at the same time. Fig. 7(b) shows the process of coke formation on MnCr2O4 spinel coated samples. MnCr2O4 spinel coating can act as a stable barrier between catalytic active metal particles and coking precursors, thus metal carbides and filamentous coke formation are prevented. Granular coke forms on MnCr2O4 spinel coating through adsorption and dehydrogenation of coking precursors. Filamentous coke grows quickly in the presence of catalytic active metal atoms, completely inhibited of which by MnCr2O4 spinel coating results in significantly reduction of coking rate.


image file: c6ra13009g-f7.tif
Fig. 7 Schematic diagram of simplified mechanism for coke formation on uncoated and coated alloy surface during the initial stage of light naphtha thermal cracking: (a) filamentous coke formation on uncoated sample; (b) granular coke formation on MnCr2O4 spinel coating.

Fig. 8 shows the SEM images of coke deposited after 6 h thermal cracking. Uncoated sample is fully covered by dense granular coke with a little coke filaments scattered over the layer, seen in Fig. 8(a) and (b). The coke morphology exhibits significant changes with increasing cracking time: at the initial stage of coke formation, a lot of coke filaments form on uncoated sample due to the catalyzing reaction of Fe and Ni atoms (Fig. 6(a) and (b)); coking precursors could adsorb and further form granular coke on sample surface as well as coke filaments surface, so that granular coke formation and filamentous coke growth take place simultaneously; the coke filaments are gradually covered by granular coke, and coke filaments stop growing when fully covered by coke layer. As shown in Fig. 8(a) and (b), after 6 h cracking, the uncoated sample is almost covered by granular coke, however, there are a few coke filaments can be found near the gaps of coke layer. Fig. 8(c) and (d) shows the morphology of coke deposited on MnCr2O4 spinel coated samples, indicating that only granular coke formed on the samples. The appearances of coke on both coated sample and uncoated sample are granular, whereas the diameter of coke particles formed on uncoated sample is smaller than that formed on MnCr2O4 spinel coated sample, and the density of coke layer on uncoated sample is much higher than that on coated sample. The loose and porous coke maybe easily removed by high velocity cracking gas under industrial thermal cracking environment.


image file: c6ra13009g-f8.tif
Fig. 8 SEM images of coke deposited after 6 h thermal cracking: (a and b) uncoated sample; (c and d) MnCr2O4 spinel coated sample.

Raman spectroscopy is widely used in characterizing carbonaceous materials due to its sensitivity to both crystal structure and molecular structure.21–31 As we know, coke is a highly disordered carbonaceous material, five bands around 1200, 1350, 1500, 1585 and 1620 cm−1 can be seen in the first-order region of Raman spectra of coke.22 Fig. 9 shows observed Raman spectra and corresponding curve fits of coke deposited on uncoated sample and MnCr2O4 spinel coated sample under different cracking duration. The first-order regions of all Raman spectra show two broad and overlapping peaks at about 1350 cm−1 and 1585 cm−1. The band around 1350 cm−1 is called the defect band (D1 band), corresponding to a graphitic lattice vibration mode with A1g symmetry, and can be attributed to in-plane defects and heteroatoms.22,23,25 The band around 1585 cm−1 (G band) corresponds to an ideal graphitic lattice vibration mode with E2g symmetry.22–25 Earlier studies22–25,31 have reported that, D2 band at about 1620 cm−1 is always present when the D1 band is present, thus the peak at around 1585 cm−1 comprises not only the G band but also the D2 band. The signal intensity between D1 band and G band is high, which can be attributed to another band around 1500–1550 cm−1. The band is called D3 band, and the D3 band is probably originated from the amorphous sp2-bonded forms of carbon. The amorphous carbon fraction can originate from polycyclic aromatic compounds or other organic and inorganic molecules, fragments and functional groups in poorly organized carbonaceous materials.22,23,31 A shoulder displays near D1 band at about 1200 cm−1, which is called D4 band. It can probably be attributed to sp2–sp3 bonds or C–C and C[double bond, length as m-dash]C stretching vibrations of polyene-like structures.22,23


image file: c6ra13009g-f9.tif
Fig. 9 Observed Raman spectra and corresponding curve fits of cokes: (a) coke formed on uncoated sample after 1 h thermal cracking; (b) coke formed on MnCr2O4 spinel coated sample after 1 h thermal cracking; (c) coke formed on uncoated sample after 6 h thermal cracking; (d) coke formed on MnCr2O4 spinel coated sample after 6 h thermal cracking.

According to previously reports,23,24 four Lorentzian-shaped bands (G, D1, D2, D4) and one Gaussian-shaped band (D3) were taken into consideration to completely analyze the coke Raman spectra by curve fitting. The results of spectrum decomposition also show good agreements. The spectra of cokes involved in the study are qualitatively similar. The intensity (peak area) of G band is weaker than that of D1 band, indicating the poor order of all cokes. The intensity of D3 band is comparable to that of G band, implying considerable amounts of amorphous carbon in the coke.

However, the height and shape of bands around 1350 cm−1 and 1500 cm−1 exhibit obvious differences among Raman spectra of the cokes, implying that D1 bands and D3 bands of the cokes are quantitatively different. Fig. 10 exhibits the ratios of peak intensities derived from the decompositions of Raman spectra of cokes formed under different conditions. The relative areas of the Raman bands via curve fitting show considerable differences.


image file: c6ra13009g-f10.tif
Fig. 10 Ratios of peak intensities derived from the decompositions of Raman spectra of cokes formed on uncoated and coated samples after 1 h or 6 h thermal cracking.

The relative area of G band (IG/IAll) of the cokes are 0.24, 0.18, 0.19 and 0.18, respectively. Raman spectrum of coke formed on uncoated sample after 1 h cracking exhibits the largest ratio of IG/IAll, implying its highest graphitization among all cokes.22,23 The intensity ratio of D1 band and G band (ID1/IG) has been proved to have well correlated with the degree of carbon structural order.22,23,27,29 The ID1/IG ratios of the cokes are 1.52, 1.94, 1.95 and 2.02, respectively. The lowest ID1/IG ratio of coke formed on uncoated sample after 1 h thermal cracking indicates its highest degree of graphitization. Meanwhile, the ID1/IG ratios of the other cokes are almost the same, while the coke formed on coated sample after 6 h thermal cracking is a little lower, implies the lower degree of crystalline order in the other cokes. Previous studies22,23,31 have reported that ID3/IG ratio increases with the proportion of amorphous carbon. The ID3/IG ratio of the cokes are 0.38, 1.26, 1.27 and 1.44, respectively, which indicates that the amorphous carbon fraction of coke formed on coated sample after 6 h cracking is the largest while that of coke formed on uncoated sample after 1 h cracking is the smallest. The coke formed on uncoated samples after 1 h thermal cracking comprises many coke filaments, which is supposed to have a relative high degree of carbon structural order. Therefore, the coke exhibits the lowest ratios of ID1/IG and ID3/IG. For uncoated samples, most of coke filaments are covered by granular coke after 6 h thermal cracking. Consequently, the disordered graphite fraction and amorphous carbon fraction on the surface of coke layer, represented by the ratios of ID1/IG and ID3/IG, increase significantly. It can be observed that granular coke is the only type of coke formed on MnCr2O4 spinel coated samples after 1 h cracking time. The nature of granular coke determines the higher degree of disorder and more amorphous carbon phase than filamentous coke, hence the higher ratios of ID1/IG and ID3/IG are present in coke formed on coated sample after 1 h cracking. After 6 h thermal cracking, morphology of coke is granular and the ratios of ID1/IG and ID3/IG have a little increase. In other words, the proportion of disordered graphite and amorphous carbon of coke formed on uncoated sample is significantly lower than that of coke formed on MnCr2O4 spinel coated sample at the beginning of coking. With increasing time of coking, the difference between cokes formed on coated and uncoated samples is much smaller. The Raman spectra analyses of the coke is in accordance with the corresponding SEM analyses for all cokes.

4. Conclusion

A dense MnCr2O4 spinel coating with favorable thickness is prepared on HP40 alloy via a novel method of pack cementation and thermal oxidation. The coating is composed of MnCr2O4 spinel phase and a spot of Cr2O3 phase, while the outer surface completely consists of MnCr2O4 spinel. Filamentous coke formation and growth have been completely inhibited on MnCr2O4 spinel coated samples, and coke formed on coated samples exhibits lower proportion of disordered graphite and amorphous carbon, indicating significant coke inhibitory effect of MnCr2O4 spinel coating during light naphtha thermal cracking. The anti-coking rate maintains at a high level exceeding 60% among all studied cracking duration.

Acknowledgements

This work is supported by Research Fund for the Doctoral Program of Higher Education of China (20110074110009) and Sinopec Corp., China.

References

  1. J. Zhou, H. Xu, X. Luan and X. Ling, Fuel Process. Technol., 2012, 104, 198–203 CrossRef CAS.
  2. J. Wang, M.-F. Reyniers and G. B. Marin, Ind. Eng. Chem. Res., 2007, 46, 4134–4148 CrossRef CAS.
  3. J. Zhou, H. Xu, J. Liu, X. Qi, L. Zhang and Z. Jiang, Mater. Lett., 2007, 61, 5087–5090 CrossRef CAS.
  4. L. F. Albright and J. C. Marek, Ind. Eng. Chem. Res., 1988, 27, 755–759 CrossRef CAS.
  5. Z. Wang, H. Xu, X. Luan, F. Hou and J. Zhou, Ind. Eng. Chem. Res., 2011, 50, 10292–10297 CrossRef CAS.
  6. S. Tang, S. Gao, S. Hu, J. Wang, Q. Zhu, Y. Chen and X. Li, Ind. Eng. Chem. Res., 2014, 53, 5432–5442 CrossRef CAS.
  7. A. E. Muñoz Gandarillas, K. M. Van Geem, M.-F. Reyniers and G. B. Marin, Ind. Eng. Chem. Res., 2014, 53, 13644–13655 CrossRef.
  8. J. Wang, M.-F. Reyniers, K. M. Van Geem and G. B. Marin, Ind. Eng. Chem. Res., 2008, 47, 1468–1482 CrossRef CAS.
  9. C. S. Li and Y. S. Yang, Surf. Coat. Technol., 2004, 185, 68–73 CrossRef CAS.
  10. C. Yang, G. Liu, X. Wang, R. Jiang, L. Wang and X. Zhang, Ind. Eng. Chem. Res., 2012, 51, 1256–1263 CrossRef CAS.
  11. S. Tang, J. Wang, Q. Zhu, Y. Chen and X. Li, ACS Appl. Mater. Interfaces, 2014, 6, 17157–17165 CAS.
  12. Z. Zhang and L. F. Albright, Ind. Eng. Chem. Res., 2010, 49, 1991–1994 CrossRef CAS.
  13. H. Li and W. Chen, Corros. Sci., 2010, 52, 2481–2488 CrossRef CAS.
  14. H. Li and W. Chen, Corros. Sci., 2011, 53, 2097–2105 CrossRef CAS.
  15. M. Shao, L. Cui, Y. Zheng, Y. Wang and L. Xing, Mater. Corros., 2013, 64, 777–782 CrossRef CAS.
  16. J. Wang, M.-F. Reyniers and G. B. Marin, J. Anal. Appl. Pyrolysis, 2006, 77, 133–148 CrossRef CAS.
  17. J. Tao, J. Liu, J. He, K. Zhang, J. Jiang, L. Sun and P. Yang, RSC Adv., 2014, 4, 23977–23984 RSC.
  18. X. Li, J. Wang, J. Zhang, Y. Li, Z. Hu and J. Chu, RSC Adv., 2016, 6, 27136–27142 RSC.
  19. Y. Chen, Z. Liu, S. Ringer, Z. Tong, X. Cui and Y. Chen, Cryst. Growth Des., 2007, 7, 2279–2281 CAS.
  20. H. C. Gupta, M. M. Sinha, Balram and B. B. Tripathi, J. Phys.: Condens. Matter, 1993, 192, 343–344 CAS.
  21. Z. Zhai, H. Shen, J. Chen, J. Li and S. Zhang, RSC Adv., 2016, 6, 42353–42360 RSC.
  22. A. Sadezky, H. Muckenhuber, H. Grothe, R. Niessner and U. Pöschl, Carbon, 2005, 43, 1731–1742 CrossRef CAS.
  23. C. Sheng, Fuel, 2007, 86, 2316–2324 CrossRef CAS.
  24. B. N. Sahoo and B. Kandasubramanian, RSC Adv., 2014, 4, 11331–11342 RSC.
  25. O. Beyssac, B. Goffé, J.-P. Petitet, E. Froigneux, M. Moreau and J.-N. Rouzaud, Spectrochim. Acta, Part A, 2003, 59, 2267–2276 CrossRef.
  26. J. Van Doorn, M. Vuurman, P. Tromp, D. Stufkens and J. Moulijn, Fuel Process. Technol., 1990, 24, 407–413 CrossRef CAS.
  27. T. Jawhari, A. Roid and J. Casado, Carbon, 1995, 33, 1561–1565 CrossRef CAS.
  28. A. Shamsi, J. P. Baltrus and J. J. Spivey, Appl. Catal., A, 2005, 293, 145–152 CrossRef CAS.
  29. M. Kawakami, T. Karato, T. Takenaka and S. Yokoyama, ISIJ Int., 2005, 45, 1027–1034 CrossRef CAS.
  30. G. Rantitsch, A. Bhattacharyya, J. Schenk and N. K. Lünsdorf, Int. J. Coal Geol., 2014, 130, 1–7 CrossRef CAS.
  31. A. Cuesta, P. Dhamelincourt, J. Laureyns, A. Martinez-Alonso and J. D. Tascón, Carbon, 1994, 32, 1523–1532 CrossRef CAS.

This journal is © The Royal Society of Chemistry 2016