DOI:
10.1039/C6RA12714B
(Paper)
RSC Adv., 2016,
6, 78106-78121
D-α-Tocopheryl polyethylene glycol 1000 succinate conjugated folic acid nanomicelles: towards enhanced bioavailability, stability, safety, prolonged drug release and synergized anticancer effect of plumbagin
Received
16th May 2016
, Accepted 26th July 2016
First published on 8th August 2016
Abstract
The aim of the study was to develop plumbagin (PLB) loaded D-α-tocopheryl polyethylene glycol 1000 succinate (vitamin E TPGS1k or TPGS)-folic acid conjugated nanomicelles (denoted as PTFM) to achieve controlled and targeted delivery with synergized anticancer potency and reduced PLB toxicity. PLB loaded TPGS micelles without folic acid conjugation (denoted as PTM) and PTFM were smaller in size and good encapsulation efficiency. The critical micellar concentration of TPGS-folic acid micellar solution was 0.015 mg ml−1. The micelles demonstrated sustained release and biocompatibility in hemolytic toxicity assay. Bioavailability of PLB from PTM and PTFM was increased by 3.9 and 4.8 fold with long circulation time, slower plasma elimination and no sign of blood and tissue toxicity as compared to free PLB. Moreover, formulated micelles demonstrated higher in vitro anticancer activity in folate over expressed human breast cancer MCF-7 cells. The targeting effect for the PTFM was also demonstrated. The concentration of the drug needed for growth inhibition of 50% of cells in a designed time period (GI50) was 13.15 ± 1.31 μg ml−1 for PLB while it was decreased by 40.68% for the PTM. Furthermore, the GI50 value of PTFM was 3.2 ± 0.4 μg ml−1, i.e., a 75.67% decrease was observed as compared to free PLB. A synergistic effect of TPGS and PLB was also achieved which reveals a new concept of a polymeric micellar drug delivery system where a carrier having therapeutic effects brings about a reduction in dose as well as cost.
Introduction
Plumbagin (PLB) (5-hydroxy-2-methyl-naphthalene-1,4-dione) (Fig. 1), a naturally occurring naphthoquinone widely distributed in the roots of the Plumbaginaceae family,1 has been used in the treatment of various cancers such as promyelocytic leukemia,2 prostate cancer,3 ovarian,4 melanoma,5 breast cancer,6 non-small cell lung carcinoma7 and cervical cancerous cell lines,8 where PLB causes cell-cycle arrest at G2/M phase and inhibition of topoisomerase II.9 Despite the great therapeutic interest, PLB showed low oral bioavailability (39%) due to its high lipophilicity (log
P 3.04), poor aqueous solubility (79.3 μg ml−1) and short biological half life (4 h).10–12 PLB, being a quinine moiety, is reported to be highly toxic and acts as spindle poison by inhibiting cell mitosis at low concentrations, and by exhibiting radiomimetic and cytotoxic effects at higher concentrations.13,14 PLB also has a tendency to cause hemorrhage on chronic administration due to competitive inhibition of vitamin K activity.15 Other toxic effects of PLB include diarrhea, skin rashes and hepatotoxicity.16
 |
| Fig. 1 Structure of plumbagin. | |
Several pharmaceutical carriers such as niosomes, microspheres based on albumin, chitosan and poly(lactic-co-glycolic) acid (PLGA), betacyclodextrin complex, phospholipid–tween 80 mixed micelles, gold nanoparticles, thermosensitive and pegylated liposomes have been investigated in order to improve PLB anticancer potential and reduce its toxicity.17–26 However, niosomes and albumin microspheres did not improve the anti-cancer efficacy of PLB, PLGA-based formulations are expensive and necessitate the use of toxic organic solvents which limits their usage. Thermosensitive liposomes may not be clinically feasible.27 Tween 80 causes neurotoxicity, fluid retention and musculoskeletal toxicity, hemolysis and cholestasis.28 Liposome shows low drug loading capacity, drug-leakage and instability.29 Metal nanoparticles are low biocompatible.30 Considering these limitations, the efficient delivery system is warranted at this stage to meet the requirements for PLB in clinical use.
Micelles are unique self assembled core–shell structure which enables the incorporation of poorly water soluble drugs into the inner hydrophobic core thus improving solubility, stability and bioavailability. The outer hydrophilic shell plays an important role in protection of drug from inactivation in biological environment and improvement in pharmacokinetic and biodistribution behaviour of the micelles.31 Moreover, as compared to other delivery systems, micelles due to its small size (<200 nm), shows advantages of passive targeting in to the tumour cells through the leaky vasculature, termed as the enhanced permeability and retention (EPR) effect.32 Long circulation time of micelles can also be achieved due to stearic hindrance caused by the presence of a hydrophilic shell.33 However, traditional micelles have limitations such as high critical micelle concentration (CMC) which decreases the encapsulation efficiency and thus increasing the amount of the micelles per given dose, causes instability of micelles in the plasma and due to lack of active targeting effect it lowers therapeutic efficiency with occurrence of side effects.34
D-α-Tocopheryl polyethylene glycol 1000 succinate (vitamin E TPGS1k or TPGS) is a non-ionic water soluble derivative of natural vitamin E (α-tocopherol) which is conjugated with polyethylene glycol 1000.33 TPGS is used as an effective solubilizer, emulsifier, surfactant and absorption enhancer in various formulations.33 Furthermore, presence of TPGS on the polymeric nanoparticle surface has enhanced oral bioavailability, cellular uptake and prolonged blood circulation time of the drug.35 TPGS has amphiphilic structure comprising lipophilic alkyl tail and a hydrophilic polar head portion resulting in micelles formation above its CMC (0.02% w/v). The bulky lipophilic portion of TPGS allows poorly soluble drug to solubilise in the micelles that facilitates effective treatment of cancer therapy.36 TPGS also helps in overcoming multidrug resistance (MDR) by inhibiting P-gycoproteins.37 They have also been reported to improve solubility, bioavailability and therapeutic efficacy of various anticancer drugs such as docetaxel, taxanes, paclitaxel, doxorubicin, gambogic acid, quercetin, emodin, topotecan, camptothecin and cisplatin.36,38–43 One of the most sophisticated designs of drug delivery system would be the use of carrier materials having therapeutic effects which may either treat the side effects caused by or promote synergistic effects with the encapsulated drug. So far, there has been limited number of such drug delivery systems available in the literature. In fact, vitamin E analogues such a TPGS are mitocans which have been found to have selective cytotoxicity for cancer cell. TPGS acts by destabilizing the organelles, unleashing their apoptogenic potential resulting in the death of malignant cells and thus suppressing the tumour growth.44
Furthermore, through the strategy of synthesis, reactive functional groups can be introduced by selecting functionalized polyethylene glycol (PEG) at the polymer termini for further attachment of target moieties. Literature revealed that folic acids (FOL), an oxidised form of folate was efficiently internalised into cells through the receptor-mediated endocytosis when conjugated with a wide variety of bioactive molecules. Folate receptors are over-expressed in most types of human cancer cells such as ovarian, breast and prostate cancers while only minimally distributed in normal tissue.45
In the present study, we further synthesized the TPGS-FOL conjugates to achieve targeted delivery for PLB. It was predicted that the conjugate can from micelles at low CMC and it should display higher encapsulation efficiency, longer circulation time in the plasma and thus higher therapeutic effects with reduced toxicity. It was hypothesized that the PLB loaded TPGS-FOL conjugated micelles (PTFM) by the way of increasing solubility, stability, bioavailability and targetability of PLB shall increase its therapeutic efficacy as compare to PLB-loaded TPGS micelles (PTM) and free PLB. To the best of our knowledge no previous studies have been attempted PLB-loaded TPGS or TPGS-FOL micelle system to improve its anticancer efficacy. Therefore, this study was undertaken to investigate the potential of TPGS and TPGS-FOL conjugated micelles as vehicle for systemic delivery of PLB. Further, it could provide an ideal solution for the problems of PLB as well as other anti-cancer drugs and produce a controlled and targeted delivery. Moreover, TPGS micelles formulation may also achieve synergistic effects with the formulated PLB.
Materials and methods
Materials
Plumbagin (99%) was purchased from Research Organic, Chennai, India. Vitamin E TPGS (D-α-tocopheryl polyethylene glycol 1000 succinate/TPGS1k, average ethylene glycol monomer content = 22 based on average molecular weight of ∼1513 kDa) was generous gifted from Antares Health Products Inc, Illinois, USA. Folic acid (FOL), 1,10 carbonyldiimodazole (CDI), N,N′-dicyclohexylcarbodiimide (DCC), triethylamine (TEA), ethylenediamine, dimethyl sulfoxide (DMSO), dichloromethane (DCM), N-hydroxysuccinimide (NHS) and dialysis bag with a 1000 molecular weight cut off were purchased from Sigma-Aldrich Chemical Private Ltd (Bangalore, India). The water used was pre-treated with the Milli-Q Plus System (Millipore Corporation, Bedford, USA). All other solvents and chemicals used were of analytical grade.
Animals
Female Wistar rats weighing 150–200 g and female Swiss Albino mice weighing 18 to 22 g were purchased from National Institute of Biosciences, Pune. The animals were housed in polypropylene cages and maintained under environmental condition of temperature 25 ± 1 °C and relative humidity of 45–55% under 12 h light
:
12 dark cycle. The animals had free access to food pellet (Nav Maharashtra Chakan oil mills Ltd., Pune) and water ad libitum. All the experimental protocols were approved by the Institutional Animal Ethics Committee (IAEC) of Poona College of Pharmacy (Registration number: 1703/PO/c/13/CPCSEA) constituted under the guidelines of Committee for the Purpose of Control and Supervision of Experiment on Animals (CPCSEA, India) with protocol approval number CPCSEA/PCEUT/12/2014-15. The CPCSEA guidelines were adhered to during the housing and experimentation of the animals.
Synthesis of TPGS-NH2
TPGS was first activated by CDI to form an imidazole carbamate intermediate (TPGS-CDI). Briefly, TPGS and CDI with a stoichiometric molar ratio of 1
:
5 were dissolved in dioxane and reacted at 37 °C for 2 h. The reaction mixture was precipitated three times in cold diethyl ether and dried overnight in a vacuum oven to get TPGS-CDI intermediate.
Subsequently, amino terminated TPGS (TPGS-NH2) was synthesized by reacting TPGS-CDI intermediate with ethylenediamine. Briefly, TPGS-CDI and ethylenediamine with a stoichiometric molar ratio of 1
:
5 were dissolved in DMSO and stirred under nitrogen atmosphere at room temperature for 24 h. The reaction mixture was dialyzed (MWCO 1000) against DMSO for 48 h and against ultrapure waters for another 48 h. The remaining mixture in the dialysis bag was freeze dried to obtain TPGS-NH2 powder.
Synthesis and characterization of TPGS-FOL
For synthesis of TPGS-FOL, TPGS-NH2, folic acid, DCC and NHS were weighed in stoichiometric ratio 1
:
1
:
2
:
2 and dissolved in DCM. Here, FOL was reacted with DCC and NHS for activation of folate, from which carboxylic group reacts with amino terminal of the TPGS to achieve TPGS-FOL with elimination of water molecule. The solution was mixed with 20 μl of TEA and left to stir in a nitrogen environment at dark place for 2 days. The solution was filtered to remove by-products and precipitated in cold diethyl ether. The obtained precipitate was washed by diethyl ether, dissolved in water and dialyzed against water. The milky dispersion was filtered to remove impurities and the filtrate was freeze dried to get yellowish powder of TPGS-FOL. The synthetic scheme of TPGS-FOL conjugate is shown in Fig. 2. The chemical structure of TPGS-FOL conjugate was characterized by 1H NMR spectra, recorded on a Bruker ARX-400 spectrometer operating at 300 MHz using dimethyl sulphoxide (DMSO-d6) as solvent and with tetramethylsilane (TMS) as internal standard.
 |
| Fig. 2 Synthetic scheme of TPGS-FOL conjugate. | |
Preparation of PLB loaded TPGS and TPGS-FOL micelles
PLB loaded TPGS micelle was prepared by ethanol injection method.20 PLB (10 mg) and TPGS (50 mg) were dissolved in 5 ml of ethanol and the obtained organic solution was injected in to 10 ml of water with continuous stirring for 1 h. The resultant mixture was filtered through 0.2 μm membrane filter to obtain a PLB loaded TPGS micelles. The targeting micelles were prepared in the same way with TPGS replaced by TPGS-FOL. The obtained PLB loaded TPGS and TPGS-FOL micelles were named as PTM and PTFM, respectively.
Characterization of PTM and PTFM
Micelles size, size distribution and zeta potential analysis
The micelles size and size distribution were determined by laser diffraction technique (Malvern 2000 SM; Malvern Instruments, Malvern, UK). The micelles size measurement was carried out at a 90° scattering angle. The samples were dispersed in distilled water and the average micelles size was determined and expressed in terms of d(0.9) μm. The zeta potential was measured with the laser Doppler electrophoretic mobility measurements using Zetasizer 300 HSA (Malvern Instruments Ltd.) at a temperature of 25 °C.
Encapsulation efficiency
The amount of PLB encapsulated in the micelles was measured by high performance liquid chromatography (HPLC, Jasco UV 2057, Japan). A reverse phase ODS Hypersil C-18 column (4.8 mm × 150, particle size 5 μm) was used. 1 ml of micelles was freeze dried and dissolved in 1 ml of DCM. After evaporation of DCM, 3 ml mobile phase (methanol/water/glacial acetic acid, 70/30/1) was added to dissolve PLB. The solution was filtered by 0.45 μm syringe filter for HPLC analysis. The flow rate was kept at 0.8 ml min−1. The column effluent was detected at 254 nm with a UV/Vis detector. The percentage encapsulation efficiency was calculated as actual amount of the drug encapsulated in micelles/initial amount of the drug used in the micelles × 100.
Critical micelles concentration determination
An iodine UV spectroscopy method was used to determine the CMC of TPGS and TPGS-FOL in double distilled water as previously reported.39 To prepare a standard KI/I2 solution, 1 g of iodine and 2 g of potassium iodide were dissolved in 100 ml of deionized water. For CMC determination, a set of polymer solutions (concentrations ranging from 0.001% to 0.1%) containing the same amount of KI/I2 (25 μl of the standard solution) were prepared. The final solutions were equilibrated for 12 h in the dark at room temperature before measurement. The UV absorbance value of various polymer concentrations at 366 nm was measured using a UV-Vis spectrometer (Shimadzu UV-2401, Shimadzu, Tokyo, Japan). The absorption intensity was plotted against the logarithm of the polymer mass concentration.
Surface morphology
Surface morphology of the PTFM was performed by using transmission electron microscopy (TEM). To prepare the sample for TEM, a drop of diluted sample was placed onto a carbon-coated copper grid to form a thin liquid film. After excess solution was removed, the sample was examined and photographed with a Zeiss EM 109 transmission electron microscope at an accelerating voltage of 80 kV.
Fourier transform infrared spectroscopy
Fourier transform infrared spectroscopy (FT-IR) spectra was recorded after appropriate background subtraction using an FTIR spectrometer (FTIR-8400; Shimadzu Corporation, Kyoto, Japan) equipped with a diffuse reflectance accessory (DRS-8000; Shimadzu Corporation, Japan) and a data station. About 2–3 mg of the sample was mixed with dry potassium bromide and the samples were scanned from 3700 to 400 cm−1 wave numbers at a resolution of 2 cm−1.
Differential scanning calorimetry
Thermal properties of lyophilized PTM and PTFM were recorded using DSC 821e (Mettler-Toledo, Greifensee, Switzerland). Samples (5 mg) were heated in hermetically sealed aluminium pan with a heating rate of 10 °C min−1 over a range of 25 to 270 °C under a nitrogen atmosphere (flow rate of 50 ml min−1).
In vitro drug release
The in vitro release of PLB from TPM and TFPM was carried out in phosphate-buffer saline (PBS, pH 7.4) using dialysis bag diffusion technique. Formulation equivalent to 1 mg of PLB or 1 mg PLB solution (1 mg ml−1 in 50%w/w mixture of PEG 400 and water) as control added into the dialysis bag (cellulose membrane, mw cut off 12
000 Da), hermetically sealed and immersed into 50 ml of phosphate buffer (pH 7.4) medium. The entire system was kept at 37 ± 0.5 °C with continuous magnetic stirring at 100 rpm. At selected time interval, sample was removed and replaced with fresh medium in order to maintain sink conditions. The amount of PLB released was determined by the HPLC method as described in the drug encapsulation efficiency determination. The error bars were obtained from triplicate sample.
Stability study
Dilution stability in 5% glucose solution
The PTM and PTFM were mixed with appropriate volume of 5% glucose solution to dilute the samples 10 times. The diluted samples were incubated at 37 °C. Samples were taken to determine the particle size and encapsulation efficiency at 2, 4, 6, 8, 12, 18 and 24 h. The experiments were represented three times and the average values are reported.46
Stability under storage condition
Freshly prepared PTM and PTFM were transferred into glass vials and exposed to refrigerated condition at 4 °C for a period of 45 days. After 45 days, the micelles size, zeta potential and encapsulation efficiency were analysed in order to determine the effect of storage condition on the stability of the formulation.47
Hemolytic toxicity assay
The hemolytic potential of the PTM and PTFM were determined using the method described by Love et al.48 Rat blood was collected in EDTA coated Eppendorf tubes and centrifuged at 3000 rpm for 5 min. The supernatant (plasma) was removed and red blood cells (RBCs) were collected at the bottom of tubes. RBCs were washed thrice with normal saline (0.9% NaCl solution). The cells were resuspended in normal saline to obtain a 2% red blood cell suspension. Tubes were labeled from 1–7 and each number represented a set of three tubes. To all the tubes, 2.5 ml of the red blood cell suspension was added. The tubes labeled 1 were diluted with 2.5 ml of distilled water as the hemolysis control (100% hemolysis) and the tubes labeled 2 were diluted with 2.5 ml of normal saline as the nonhemolysis control (0% hemolysis). The remaining tubes were diluted with PTM corresponding to PLB concentrations of 0.25, 0.5, 0.75, 1 and 1.5 mg ml−1 and volume made up to 5 ml with normal saline. All tubes were incubated for 1 h at 37 °C and then for 5 min at 0 °C to stop hemolysis. Tubes were dislodged and centrifuged at 2000 rpm for 15 min. Absorbance of supernatants was determined at 453 nm with UV-Vis spectrophotometer. Normal saline was taken as blank during analysis. The same procedure was used for PTFM haemolytic toxicity study. The % hemolysis was estimated by following equation
where Abs, Abs100 and Abs0 were the absorbance of the samples, absorbance of the samples in a solution of 100% and 0% hemolysis, respectively.
Pharmacokinetic study in rats
Experimental design and sample collection
The rats were randomly divided into three groups (six animals each). Animals were fasted, but provided free access to water, overnight before the commencement of the experiment. Group I received PLB at the dose of 20 mg kg−1 (formulated in 30% PEG and 70% saline at a final concentration of 1.3 mg ml−1) by intraperitoneal (i.p.) route. Group II and III received TPM and TFPM at the dose of 20 mg kg−1 by i.p. After mild ether aesthesia, blood samples were collected using retro-orbital puncture technique at predetermined time intervals (0.5, 1, 2, 3, 4, 5, 6, 7 and 8 h) in EDTA-coated tubes (BD Vacutainer® K2 EDTA) serially (0.5 to 2 ml each). Samples were centrifuged at 10
000 rpm for 15 min at 4 °C (Cryocentrifuge 2810R, Eppendorf, USA) and the plasma obtained was stored in polypropylene tubes below −20 °C and promptly analyzed by validated HPLC method.
Analytical method
The plasma PLB concentrations were determined by HPLC (reverse phased) analysis according to the method reported by Yen et al., with slight modifications.49 After reequilibration to room temperature, plasma samples (100 μl) were transferred to 2 ml Eppendorf centrifuge tube, to which 500 μl of ethyl acetate was added and homogenized by vortex mixing for 15 min to precipitate proteins. Samples were kept in ice bath for 15 min and centrifuged at 10
000 rpm at 4 °C for 15 min. The separated organic layer was collected and evaporated to dryness at 40 °C under a gentle stream of nitrogen gas. The obtained residues were reconstituted in 100 μl of mobile phase with vortex mixing from which 20 μl was injected to the HPLC system.
The HPLC system specifications were as follows: pump, PU-1580 (JASCO, Japan); injector, auto sampler (AS-1555; JASCO); column, Hypersil ODS C18, 150 × 4.6 mm, 5 μm (Thermo Electron Corporation, USA) with a Javelin Guard column (10 × 4.6 mm, 5 μm) filled with the same materials; detector, UV/visible (UV-1575; JASCO). Data acquisition and analysis were carried out using Borwin/HSS 2000 software (LG 1580-04; JASCO). The mobile phase was a mixture of methanol
:
water
:
glacial acetic acid (70
:
30
:
1 v/v). The column temperature and flow rate were 40 °C and 0.8 ml min−1; wavelength was 254 nm. The HPLC analytical method was well validated. PLB was eluted at 5.7 min. Limit of detection and quantification for PLB were of 0.02 and 0.06 μg ml−1, respectively. The PLB calibration curve was linear (y = 3367.4x − 3138.71) at a concentration range of 40–280 ng ml−1 with its correlation coefficient being 0.995. The peak area of PLB was used for quantification of plasma samples which was linear.
Pharmacokinetic and statistically analysis
The pharmacokinetic parameters were analysed by a non-compartmentalised model with the aid of the programme WINNON-LIN 4 (Pharsight Corp., Mountain View, CA, USA). Peak plasma concentration (Cmax) and times to reach peak concentration (Tmax) were determined from the individual plasma concentration–time curves. The terminal elimination half-life (t1/2) was calculated as 0.693/Ke. The area under the plasma concentration–time curve (AUC) was calculated using the log-linear trapezoidal rule. Mean residence time (MRT) was calculated as AUMC/AUC. The apparent clearance (Cl/F) was calculated as dose/AUC. The apparent volume of distribution (Vd) was calculated as MRT.Cl. The differences in pharmacokinetic parameters of the study groups were statistically evaluated by the t-test. All values were expressed as their mean ± S.D. Difference was considered to be significant at a level of p < 0.05.
In vivo toxicity assessment in mice
Healthy 8 weeks old female mice weighing 18–22 g were fasted overnight with free access to water before the study. To investigate the toxicity of free PLB, PTM and PTFM, 24 female mice were randomly divided into four groups (six mice in each). Group I (vehicle treated group) received distilled water by i.p. route. Group II received free PLB at the dose of 2 mg kg−1 (formulated in 30% PEG and 70% saline at a final concentration of 1.3 mg ml−1) by i.p. route. Group III and IV received TPM and TFPM at the dose of equivalent to 2 mg kg−1 by i.p. route for 15 consecutive days. Twenty four hours after the last dose, blood was collected by retro-orbital vein and evaluated for any hematological changes such as total RBC and WBC counts, hemoglobin, hematocrit values and platelet counts using automated blood cell counter Erma PCE-210 (Japan). The animals were sacrificed by excess ether inhalation and necropsy was performed to analyze the macroscopic external features of vital organs such as heart, liver, spleen and kidney. These organs were carefully removed and fixed in 10% buffered formalin and embedded in paraffin. Histology sections (5 μm thick) were stained with hemotoxylin and eosin dye and examined under a light microscope (Olympus CH02).
In vitro anticancer study
In vitro anticancer activity of free PLB, PTM, PTFM and blank TPGS micelles (BTM) were evaluated against folate over expressed human breast cancer MCF-7 cells using in vitro sulforhodamine B assay (SRB assay).20 The cells were cultured in RPMI1640 medium, supplemented with 10% v/v fetal bovine serum (FBS) and 2 mM L-glutamate. Cells were seeded at the density of 5 × 10³ cells per well in 96-well plates using in situ fixing agent trichloroacetic acid (TCA). After 24 h of incubation at 37 °C with 100% relative humidity (RH), the growth medium was replaced with 100 μl of fresh medium containing various concentrations (5–20 μg ml−1) of free PLB in DMSO (the final concentration of DMSO should below 0.2%), PTM, PTFM and BTM. The culture media without any drug formulation was used as a control. After 48 h incubation, assay was terminated by adding 50 μl of the cold TCA and incubated for 60 min at 4 °C. The media was removed and washed with sterile PBS and dried. 50 μl of SRB solution (0.4% w/v in 1% acetic acid) was added to each well and further incubated for 20 min at room temperature. After staining, unbound dye was removed by washing with 1% acetic acid and plates were air dried. Bound stain was eluted with 10 mM trizma base and the absorbance was measured on an ELISA plate reader at a wavelength of 540 nm with 640 nm reference wavelength. Percent growth was calculated on a plate-by-plate basis for test results relative to control wells using the following equation.
Cell growth (%) = (Avg absorbance of the test well/Avg absorbance of the control wells) × 100 |
Using the six absorbance measurement (time zero (Tz)), control growth (C) and test growth in the presence of drug at various concentration level (Ti), the percentage growth was calculated at each of the drug concentration levels, percentage growth inhibition was calculated as: [(Ti − Tz)/(C − Tz)] × 100 for concentration where Ti ≥ Tz or (Ti − Tz) is positive or zero; as [(Ti − Tz)/Tz] × 100 for concentration where Ti ≤ Tz or (Ti − Tz) is negative.
Growth inhibition of 50% (GI50) was calculated from equation [(Ti − Tz)/(C − Tz)] × 100 = 50 as the drug concentration resulting in a 50% reduction in the net protein increase (as measured by SRB staining) in control cells during the drug incubation.
Results and discussion
Over the past few decades, nanomedicine-based drug delivery systems have provided tremendous applicability in improving the reliability and safety of existing drugs. Naturally derived bioactives are preferred over synthetic drugs because of their relative safe and biocompatible nature. However, the low aqueous solubility, poor bioavailability, environmental and physiological instability hamper their clinical use. Many diseases like cancer need targeted drug delivery release which can be achieved by using novel drug delivery system. Therefore, nanomedicine-based drug delivery systems have been developed for various natural bioactives to improve safety, efficacy and patient compliance.50–54 Several edible plant-derived compounds have been linked to the chemoprevention and treatment of cancer.55 Among these natural compounds, the naphthoquinones have shown several pharmacological properties of interest in the prevention and treatment of cancer.56 PLB, a naturally occurring bioactive, inhibits the growth of different types of cancers. Its poor aqueous solubility and toxicity continues to be highlighted as a major challenge in developing formulation for clinical efficacy. In the present study, we developed TPGS and TPGS-FOL conjugated micelles as a carrier for PLB to enhance therapeutic efficacy and reduce its toxicity. Moreover, TPGS have selective cytotoxicity for cancer cells which could achieve synergistic therapeutic effect with PLB.
Characterization of TPGS-FOL conjugate
TPGS-FOL conjugate was synthesized by reaction between TPGS-NH2 and FOL as schematized in Fig. 2. 1H NMR spectroscopy measurements were carried out to identify the conjugation of folate onto TPGS (Fig. 3). The spectrum of folate exhibits typical peaks of folic acid at 1.93 ppm (β-CH2 of glutamic acid), 2.07 ppm (γ-CH2 of glutamic acid), 4.51 ppm (methylene proton), 6.66 and 6.98 ppm (aromatic protons), 8.17 ppm (aliphatic amide proton) and 8.67 ppm (pteridine proton). The peaks at 2.50 and 3.30 ppm should be ignored as they are corresponding to DMSO and H2O peaks respectively. The spectrum of the TPGS exhibits an intense peak at 3.65 ppm which is the characteristic of methylene proton of PEO part in TPGS. The spectrum of TPGS-FOL contains both signals originating from folate and TPGS, but relatively weaker intensity for the signal of folate which may be due to the small molecular weight of folate (441 kDa) compared to that of TPGS (1513 kDa).
 |
| Fig. 3 1H NMR spectra of (a) folic acid, (b) TPGS and (c) TPGS-FOL conjugate. | |
PLB-loaded TPGS-FOL micelles
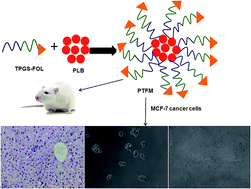
In micelles, inner hydrophobic core which involves hydrophobic–hydrophobic interaction between nonpolar head groups and the outer shell surface with hydrophilic groups.20 The micelles formed by TPGS-FOL are viewed as a hydrophobic (alkyl tail) core surrounded by a larger shell made from the hydrophilic polyethylene chain with their water of hydration (Fig. 4). The drug is immersed in hydrophobic core of the micelles by hydrophobic interactions and hydrogen bonds.
 |
| Fig. 4 Schematic representation of PTFM (PLB loaded TPGS-FOL micelles). | |
Micelles size and size distribution
Micelles size has a direct effect on the stability, drug release, biodistribution and cellular uptake. The micelles size and size distribution measured by the laser diffraction technique are shown in Table 1 and Fig. 5a. The mean size of PTM was 114.3 ± 1.1 nm whereas the mean size of PTFM was found to be increased to 128.4 ± 0.8 nm. The increased size of ligand conjugated micelles is in agreement with the literature.38 Clearly, this implies that folic acid contributes to interactions that favour the micelle growth. Folic acid is composed of three primary structures 2-amino-4-hydroxy-6-methyl-pteridin, para-amino benzonic acid and L-glutamic acid. Since it comprised of hydrophilic carboxyl and amino groups, it can interact via hydrogen bonding. Therefore, we speculate that attractive interactions between folic acid moieties in the micelle may lead to micellar growth and a broader size distribution. The polydispersibility index was close to 0.1 which can be regarded as acceptable narrow size distribution.
Table 1 Particle size, polydispersity index, zeta potential and encapsulation efficiency of PTM and PTFMa
Formulation |
Micelles size (nm) |
Polydispersity index |
Zeta potential (mV) |
Encapsulation efficiency (%) |
PTM, PLB loaded TPGS micelles; PTFM, PLB loaded TPGS-FOL micelles; PLB, plumbagin. |
PTM |
114.3 ± 1.1 |
0.146 ± 0.010 |
−28.71 ± 0.65 |
78.54 ± 1.57 |
PTFM |
128.4 ± 0.8 |
0.164 ± 0.014 |
17.20 ± 0.44 |
67.24 ± 2.22 |
 |
| Fig. 5 (a) Particle size and (b) zeta potential of PTM (PLB loaded TPGS micelles) and PTFM (PLB loaded TPGS-FOL micelles). | |
A hydrophobic drug can be encapsulated into micelles by chemical conjugation or physical entrapment. The physical entrapment of drug in micelles results from hydrophobic interactions, hydrogen bond and van der Waals forces. In the present study, micelles showed low particle size that could be attributed to the effect of hydrogen bonds between the hydroxy, carbonyl groups of PLB and TPGS. Furthermore, the enhanced cohesive force of the hydrophobic interaction might be another reason.37 Size of both formulations are above 100 nm and below 200 nm which are suitable for efficient drug delivery via parentral route. This is a point of distinctive advantage since nanoparticles bigger than 10 nm could escape renal clearance and smaller than 200 nm can escape phagocytosis by macrophages, have prolonged circulation half-lives and are more favourable for passive targeting to solid tumour via EPR effect.20
Zeta potential
Surface charges of the particles are reflected by zeta potential which plays a significant role in both colloidal stability and interaction with physiological body cells. The PTM showed negative zeta potential (−28.71 ± 0.65 mV) which may be due to terminal polyethylene oxide (PEO) group of TPGS on surface. The PTFM showed positive zeta potential (+17.20 ± 0.44 mV) due to charge neutralization effects through non-covalent interaction between TPGS and folic acids and the amount of protonated amino group of folic acid on surface (Fig. 5b). Numerous studies have shown that high magnitude of zeta potential may have detrimental effects on blood circulation time. In the present study, it seems to be in appropriate value considering the colloidal stability and blood clearance.
Encapsulation efficiency
The drug encapsulation efficiency of PTM and PTFM determined by HPLC are shown in Table 1. The encapsulation efficiency of PTM was 78.54 ± 1.57% whereas of TFPM was 67.24 ± 2.22%. PTM achieved high drug encapsulation efficiency which may be due to bulky non polar head group of the TPGS molecules that form a strong hydrophobic core which interacts with PLB and permits more encapsulation.
Critical micelles concentration
CMC is an important parameter for the stability of drug-loaded micelles, both in vitro and in vivo. In this study, iodine was used as a hydrophobic probe to monitor the formation of TPGS and TPGS-FOL micelles. As a small hydrophobic molecule, iodine prefers to enter the hydrophobic microenvironment of copolymers causing the conversion of I3 to I2 from the excess KI in the solution which maintains the saturated aqueous concentration of I2.57 At the low concentration, TPGS-FOL molecules are well dispersed in the aqueous medium. As the concentration increased, the free energy of the system rises because of unfavourable interaction between hydrophobic domain and at the surrounding water molecule. At a specific concentration, termed the CMC, amphiphilic molecules with the appropriate geometry, orients themselves in such a way that the hydrophobic segments are isolated from the aqueous environment, achieving a state of minimum energy that leads to the formation of colloidal assemblies termed micelles. The CMC of TPGS-FOL was determined to be 0.0150 mg ml−1 which was much lower than that of TPGS (0.0225 mg ml−1) (Fig. 6). The obvious decrease in CMC suggested that the TPGS-FOL micelles would provide good stability for the drug in the suspension and great resistance to dissociation even on dilution by the much larger volume of blood in the body.57
 |
| Fig. 6 Plot of the absorbance intensity of I2 as a function of (a) TPGS and (b) TPGS-FOL concentrations, (n = 3). | |
Surface morphology
Surface morphology of the PTFM was assessed using transmission electron microscope (TEM) from which it can be seen that the micelles have smooth surfaces and are spherical in shape (Fig. 7). The micelles shown in the TEM are little bigger in size than that tested from laser diffraction technique, which is due to low melting point of TPGS (∼39 °C). The micelles undergoes the melting and expansion to certain extent under the high energy electron beam in TEM which makes them seem bigger in TEM image than in laser diffraction test.
 |
| Fig. 7 Transmission electron microscopy image of PTFM (PLB loaded TPGS-FOL micelles). | |
Fourier transform infrared spectroscopy
FT-IR spectroscopy was carried out to study the possibility of chemical interaction between free PLB and carrier (Fig. 8a). The FT-IR spectrum of free PLB showed the presence of OH stretching at 3321 cm−1, 2-methyl at 1674 cm−1, quinine carbonyl groups (ketone) at 1662 cm−1, Ar C
C at 1609 cm−1 and Ar C–H stretching at 751 cm−1. The PTM and PTFM showed almost complete disappearance of the hydroxyl band at 3321 cm−1. The concomitant shift of the carbonyl peak from 1662 cm−1 to a lower frequency 1623 and 1625 cm−1 in PTM and PTFM, respectively. This might be a consequence of intermolecular interactions such as hydrogen bonding which demonstrates the transformation of drug crystal into amorphous form.58
 |
| Fig. 8 Fourier transform infrared spectra of PLB, PTM (PLB loaded TPGS micelles) and PTFM (PLB loaded TPGS-FOL micelles). | |
Differential scanning calorimetry
In order to determine the molecular state of the PLB, before and after loading in to micelles, DSC study was performed for the free PLB, PTM and PTFM (Fig. 8b). A sharp melting transition of free PLB was observed at 79.40 °C with ΔH 137.4 J g−1 shows transit crystallinity. In PTM and PTFM thermograms, the free PLB peak was disappeared indicating molecular dispersion of PLB in the core of micelles, where hydrogen bonding between the PLB and polymer also reduced crystallinity.
In vitro drug release
In vitro drug release of PLB from its solution and micelle were investigated by diffusion bag technique. Being systemic administration, the drug release studies were conducted in phosphate buffer saline pH 7.4. Fig. 9a revealed that PLB could freely diffuse from its solution with 100% drug release within 4.5 h. However PLB release from both micelles showed a biphasic pattern with initial burst release (18.15 ± 1.89% and 24.25 ± 2.63% for TPM and TFPM, respectively) within the first 1 h followed by sustained release up to 22 h. Initial burst release may be due to hydration of the drug that is associated on the interface of the micelles core and hydrophilic corona or even within the micelle corona compartment and their passive diffusion. It is useful to inhibit the growth of cancer cells in the beginning of the treatment. In the following hours, the cumulative release sustainably increased which ensures the ability of to provide sustained treatment of the cancer cells. After 22 h, the cumulative drug release for TPM and TFPM were of 66.67 ± 3.42% and 79.91 ± 3.86%, respectively.
 |
| Fig. 9 (a) In vitro PLB release from PLB solution, PTM and PTFM in phosphate buffer saline pH 7.4. (b and c) Stability study of the PTM and PTFM in 5% glucose solution. Each point represents an average ± SD (n = 3). PLB, plumbagin; PTM, PLB loaded TPGS micelles and PTFM, PLB loaded TPGS-FOL micelles. | |
Normally, three basic mechanisms, namely swelling/erosion, diffusion and degradation are contributed for the release of a loaded drug from polymeric particles.59 Any or all of these mechanisms may occur in a given release system.60 The different between the release behaviour of PLB from its solution and micelles might be attributed to the fact that the drug was encapsulated into the core micelles. The hydrophilicity of the polymer determines the rate of water uptake during the course of release, where, swelling of micelles initiates diffusion of drug through water channels. In PTM, hydrophilic part PEO of TPGS facilitates the water uptake and accelerates the diffusion of PLB through water channels. However, PTFM showed faster release of PLB than PTM which may be due to formation of more water channel by larger hydrophilic part of folic acid. The drug incorporated into the inner core compartment stayed firmly inside the micelles showing a very slow release even at sink conditions with 33.33% and 20.09% of the initially incorporated drug still being associated with the TPM and TFPM micelles even after 22 h.61
Stability study
Dilution stability is very important for a drug-delivery system administered by injection because one of the major differences between the in vitro and in vivo conditions is the dilution effect. When drug-encapsulated micelles injected into the circulation, it result in many-fold dilution and the dissociation of micelles into monomers.37 The effect of dilution by physiological solution on the stability of the prepared micelles was determined in terms of micelles size and encapsulation efficiency. As shown in Fig. 9b and c, the micelles size did not change significantly upon 10 times dilution with 5% glucose solution. The encapsulated PLB was completely retained in the core of micelles. These data suggested that upon injections, PTM and PTFM were more stable towards dilution.
The physicochemical stabilities of PTM and PTFM were determined by measuring micelles size, zeta potential and encapsulation efficiency. PTM displayed micelles size 116.7 ± 1.4 nm, 26.82 ± 0.73 mV and 76.54 ± 1.62% and PTFM showed 131.5 ± 1.7 nm, 16.62 ± 0.31 mV and 66.37 ± 1.62%. Therefore, both PTM and PTFM showed high physical and chemical stability up to 45 days at storage condition.
Hemolytic toxicity assay
A drug delivery system administered parentally needs to be tested for haemolytic toxicity studies. In this investigation, distilled water was used as standard that causes hemolysis by rupturing of RBCs. It solubilises the cell membrane lipids, disturbs the membrane integrity and lyses the cells. As shown in Fig. 10a, at all the concentrations the PTM and PTFM haemolyses less than 3%, indicating their high biocompatibility.48
 |
| Fig. 10 (a) Haemolytic toxicity study of PTM and PTFM (mean ±, n = 3). (b) The mean plasma concentration–time profiles of PLB after i.p. administration of PLB solution, PTM and PTFM in rat. PLB, plumbagin; PTM, PLB loaded TPGS micelles and PTFM, PLB loaded TPGS-FOL micelles. | |
Pharmacokinetic study in rats
The influence of the micelles formulation on PLB bioavailability was examined in rats. Upon intravenous injection of a classical nanoparticle, the particles interact with the apolipoproteins and are captured by the reticulo-endothelial system leading to their rapid elimination from the blood compartment.53 To avoid this, we followed i.p. route of administration for the bioavailability studies. Plasma levels of PLB from PTM and PTFM were compared with free PLB (Fig. 10b). Both micelles yielded higher PLB plasma concentrations as compared to free PLB. The relevant pharmacokinetic parameters derived by noncompartmental analysis are listed in Table 2. The PTM and PTFM showed 1.8, 1.7, 3.9, 1.9 and 2, 1.8, 4.8, 2 fold increase in Cmax, t1/2, AUC and MRT (p < 0.05), respectively. There was no significant difference in the time to reach peak concentration (Tmax) of the PTM, PTFM and free PLB.
Table 2 Mean non-compartment pharmacokinetic parameters of PLB after single i.p. dose (20 mg kg−1) administration of PTM, PTFM and free PLB in rat plasmaa
Parameters |
Free PLB |
PTM |
PTFM |
Each value represents the mean ± SD of six rats. PTM, PLB loaded TPGS micelles; PTFM, PLB loaded TPGS-FOL micelles; PLB, plumbagin; AUC area under the plasma concentration–time curve from 0 h to ∞, Cmax peak concentration, Tmax time to reach peak concentration, t1/2 elimination half-life, Cl clearance, MRT0–∞ mean retention time, Vd volume of distribution, *P < 0.05 significantly different from free PLB. |
Cmax (ng ml−1) |
45.95 ± 3.27 |
81.92 ± 2.59* |
94.62 ± 3.68* |
Tmax (h) |
0.5 ± 0.06 |
0.5 ± 0.02 |
0.5 ± 0.02 |
T1/2 (h) |
2.82 ± 0.04 |
4.87 ± 0.09* |
5.05 ± 0.06* |
AUC0–∞ (h ng ml−1) |
196.50 ± 7.27 |
770.72 ± 9.82* |
960.276 ± 11.48* |
MRT0–∞ (h) |
4.00 ± 0.43 |
7.74 ± 0.27* |
8.05 ± 0.34* |
Cl (ml h−1 g−1) |
20 355.61 ± 600 |
5189.91 ± 86.48* |
4165.49 ± 74.28* |
Vd (l g−1) |
828.32 ± 21.53 |
36.47 ± 4.82* |
30.40 ± 3.63* |
PTM and PTFM displayed higher Cmax and long terminal half-life. This would lead to long residence time with slow plasma elimination and consequent remarkable improvement in in vivo anticancer effect. As compared with free PLB, both the micelle showed lower clearance due to less metabolism through glucuronidation, because of micelle structure protect the entrapped drug from degradation or metabolism. The enhanced PLB bioavailability is probably due to faster absorption and the slow drug release from micelles causing prolonged residence time in blood. Intraperitoneal administration also favours the lymphatic distribution of drugs, especially anticancer drugs which must access the lymph nodes that frequently harbour metastases.62 Similar results were reported for the hydrophobic anticancer paclitaxel where i.p. administration led to a significant improvement in its bioavailability.63
In vivo toxicity assessment in mice
The free PLB, PTM and PTFM were tested for normal toxicity by performing hematological and histopathological studies. The hematopoietic system, being one of the most sensitive targets of toxic chemicals, is an important index of physiological and pathological status of human and animals. The effects of free PLB, PTM and PTFM on the hematological parameters are given in Table 3. The free PLB treatment caused significant decrease in RBC, hematocrit and hemoglobin count as compared to vehicle treated group whereas upon PTM and PTFM treatment, there was a significant increase in RBC, hematocrit and hemoglobin count as compared to PLB treated group. However, there was an increase in the WBC count and percentage of lymphocytes in all treated groups as compared with the respective vehicle treated controls group indicating immunostimulant activity of PLB. It was observed that animals treated with PTM and PTFM had improved mean platelet counts compared to free PLB treated group. These observations indicated that PTM and PTFM did not affect the hemopoietic system compared to PLB.
Table 3 Effect of free PLB, PTM and PTFM on hematological parameters on 15th day of post-treatment (n = 4)a
Parameters |
Vehicle treated |
Free PLB |
PTM |
PTFM |
PLB, plumbagin; PTM, PLB loaded TPGS micelles; PTFM, PLB loaded TPGS-FOL micelles; *P < 0.05 compared to vehicle-treated group, **P < 0.001 compared to vehicle-treated group. |
Red blood cells |
RBC (×106/μl) |
8.23 ± 0.46 |
4.40 ± 0.97** |
6.20 ± 0.14* |
6.43 ± 0.69* |
Hemoglobin (g dl−1) |
12.62 ± 0.51 |
5.22 ± 0.61** |
9.86 ± 0.27** |
10.16 ± 0.72* |
Hematocrit (%) |
41.83 ± 2.37 |
19.63 ± 1.63** |
33.84 ± 1.89** |
34.27 ± 1.47** |
![[thin space (1/6-em)]](https://www.rsc.org/images/entities/char_2009.gif) |
White blood cells |
WBC (×103/μl) |
5.17 ± 1.64 |
6.42 ± 1.13* |
11.45 ± 2.34** |
8.14 ± 0.64** |
Lymphocytes (%) |
55.34 ± 3.51 |
58.62 ± 2.36* |
70.62 ± 3.28** |
72.48 ± 1.85** |
Platelet count (×106/μl) |
1.47 ± 0.21 |
1.09 ± 0.28** |
1.22 ± 0.14** |
1.27 ± 0.21** |
The reduced systemic toxicity was further reflected in tissue toxicity study by macroscopic examination on vital organs. As shown in Fig. 11, the free PLB caused abnormal tissue toxicity such as myocardial necrosis, infiltration of inflammatory cells and myocardial degeneration in heart; congested blood vessels, perivascular cuffing, hepatocellular necrosis and focal infiltration of inflammatory cells in liver; severe necrosis of tubules and glomeruli, lymphocytic infiltration and congestion of blood vessels in kidney; markedly reduced white pulp and presence of megakaryocytes in spleen. Whereas, PTM and PTFM treatment did not cause any significant tissue toxicity on vital organs. The reason behind the reduced systemic toxicity for PTM and PTFM formulations could be attributed to the slow release of the PLB from the micelles over prolonged period of time in comparison to the free PLB which is released in ∼8 h duration as evidenced in pharmacokinetics study. Lower apparent volume of distribution is also responsible for reduced tissue toxicity. Also, the survival data further supports the reduction in the systemic toxicity with the PTM and PTFM with 10% increased life span (ILS) in comparison to free PLB. The results demonstrated no signs of normal tissue toxicity in both the PTM and PTFM treated group indicating its non-toxic nature. This study clearly substantiates the safety of PTM and PTFM supporting the need for further clinical exploration.
 |
| Fig. 11 Tissue toxicity assessment of free PLB, PTM (PLB loaded TPGS micelles) and PTFM (PLB loaded TPGS-FOL micelles) in mice. The histopathologic examination of tissue sections of heart, liver, kidney and spleen was made after mice were sacrificed and staining with H and E stain; magnification 40×. | |
In vitro anticancer study
The in vitro anticancer activity of PLB, PTM, PTFM and BTM were investigated against evaluated against folate over expressed human breast cancer MCF-7 cells using in vitro SRB assay (Fig. 12a–e).The advantages of the TPGS micelles formulation of PLB was quantified by the GI50 value which is defined as the drug concentration needed to inhibit 50% of the incubated cells growth in a deigned time period.64 From Fig. 12f, it is observed that the GI50 for PLB is 13.15 ± 1.31 μg ml−1 while it was greatly decreased to 7.8 ± 0.8 μg ml−1, i.e., a 40.68% decrease for the PTM. Furthermore, the GI50 value for PTFM was 3.2 ± 0.4 μg ml−1, i.e., a 75.67% decrease compared to PLB and 58.97% decrease compare to PTM. The enhanced anticancer activity of PTM is attributed to the enhanced solubility of PLB in micelles solution, increased stability of PLB inside the micelles core, high drug transportation by passive targeting to cancer cells, the controlled drug release and P-gp inhibition properties of TPGS. Further, improved anticancer activity of PTFM demonstrated active targeting effects to the cancer cells which may suggest that the FOL conjugated micelles were endocytosed via a folate receptor-mediated mechanism. To explore the synergistic effects between PLB and TPGS, the GI50 of BTM was calculated which was 14.26 ± 1.5 μg ml−1. It is a point of distinct importance that such GI50 value of PLB is almost equivalent to the concentration of BTM. The value is much larger than PTM. This demonstrates the possible synergistic effects of TPGS with PLB.
 |
| Fig. 12 (a) Microphotograph of MCF-7 cancer cell. (b), (c), (d) and (e) blank TM, PLB, PTM and PTFM treated MCF-7 cancer cell. (f) GI50 value of PLB, blank TM, PTM and PTFM on breast cancer cell MCF-7. Each point represents an average ± SD (n = 3). PLB plumbagin, TM TPGS micelles, PTM PLB loaded TPGS micelles and PTFM PLB loaded TPGS-FOL micelles. | |
It is clear that the BTM showed certain cytotoxicity. This finding is consistent with the results obtained for vitamin E in the form of alpha-tocopheryl succinate which has been demonstrated to inhibit growth of several cancer cell lines including pancreas, breast and prostate.65 Vitamin E succinate (and its analogues) causes generation of large amount of reactive oxygen species (ROS) and these ROS can diffuse across the mitochondrial membrane at which they are activated probably by redox-active iron, so that they can catalyse formation of disulfide bridge between Bax (proapoptotic gene) monomers. This conformational change of Bax exposes the trans-membrane domain of the protein and Bax dimer moves to the mitochondrial outer membrane where it forms a megachannel. Besides, the vitamin E analogues also bind to the anti-apoptotic Bcl2 and Bcl-XL protein so that the activated Bax cannot be diverted from forming mega channels. The accumulated ROS also triggers the cytochrome c oxidase activity, which, as a result, release cytochrome c that traverses the MOM through the megachannel and activates the caspase cascade leading to apoptosis of the cancer cells.66
Conclusion
The developed PLB loaded TPGS and FOL conjugated TPGS micelles (denoted as PTM and PTFM, respectively) displayed smaller in size, good encapsulation efficiency, more stable upon dilution, sustained release, biocompatible with no sign of blood and tissue toxicity. PTM and PTFM demonstrated 3.9 and 4.8 fold increase in PLB bioavailability as compared to PLB solution. Moreover, the PTM and PTFM micelles showed passive and active targeting effect to folate over expressed human breast cancer MCF-7 cells. The developed micelles also synergized anticancer effect of PLB which reveals that the carrier materials can also have therapeutic effects and may bring about reduction in dose as well as cost. These results indicate that PTM and PTFM are valuable drug delivery carriers to produce synergistic anticancer effect and decreased toxicity of PLB. Our results imply that the PTFM could have high potentials to be used for targeted and synergistic chemotherapy.
Conflict of interest
The author(s) declare(s) that they have no conflicts of interest to disclose.
Acknowledgements
The authors are thankful to All India Council for Technical Education (AICTE), New Delhi, India for providing financial support in the form of a Quality Improvement Programme (QIP) Fellowship to Ms. Rabiya Patel.
Notes and references
- C. Bothiraja, P. P. Joshi, G. Y. Dama and A. P. Pawar, Eur. J. Intern. Med., 2011, 3, 39 Search PubMed.
- K. H. Xu and D. P. Lu, Leuk. Res., 2010, 34, 658 CrossRef CAS PubMed.
- A. A. Powolny and S. V. Singh, Pharm. Res., 2008, 25, 2171 CrossRef CAS PubMed.
- K. A. Thasni, S. Rakesh, G. Rojini, T. Ratheeshkumar, G. Srinivas and S. Priya, Ann. Oncol., 2008, 19, 696 CrossRef CAS PubMed.
- C. C. C. Wang, Y. M. Chiang, S. C. Sung, Y. L. Hsu, J. K. Chang and P. L. Kuo, Cancer Lett., 2008, 259, 82 CrossRef CAS PubMed.
- A. Ahmad, S. Banerjee, Z. Wang, D. Kong and F. H. Sarkar, J. Cell. Biochem., 2008, 105, 1461 CrossRef CAS PubMed.
- Y. L. Hsu, C. Y. Cho, P. L. Kuo, Y. T. Huang and C. C. Lin, J. Pharmacol. Exp. Ther., 2006, 318, 484 CrossRef CAS PubMed.
- P. Srinivas, G. Gopinath, A. Banerji, A. Dinakar and G. Srinivas, Mol. Carcinog., 2004, 40, 201 CrossRef CAS PubMed.
- A. Kawiak, J. Piosik, G. Stasilojc, A. Gwizdek-Wisniewska, L. Marczak, M. Stobiecki, J. Bigda and E. Lojkowska, Toxicol. Appl. Pharmacol., 2007, 223, 267 CrossRef CAS PubMed.
- C. Bothiraja, A. P. Pawar, G. Y. Dama, P. P. Joshi and K. S. Shaikh, J. Pharmacol. Toxicol. Methods, 2012, 66, 35 CrossRef CAS PubMed.
- C. Bothiraja, A. P. Pawar, A. J. Mali and K. S. Shaikh, Int. J. Surf. Sci. Eng., 2013, 7, 181 CrossRef CAS.
- S. Rajalakshmi, A. P. Pawar, A. J. Mali and C. Bothiraja, Mater. Res. Express, 2014, 1, 025405 CrossRef.
- F. E. Solomon, A. C. Sharada and P. U. Devi, J. Ethnopharmacol., 1993, 38, 79 CrossRef CAS PubMed.
- S. Nair, R. R. Nair, P. Srinivas, G. Srinivas and M. R. Pillai, Mol. Carcinog., 2008, 47, 22 CrossRef CAS PubMed.
- R. Vijayakumar, M. Senthilvelan, R. Ravindran and S. S. Devi, Vasc. Pharmacol., 2006, 45, 86 CrossRef CAS PubMed.
- S. K. Sandur, H. Ichikawa, G. Sethi, K. S. Ahn and B. B. Aggarwal, J. Biol. Chem., 2006, 281, 17023 CrossRef CAS PubMed.
- R. A. Naresh, N. Udupa and P. U. Devi, J. Pharm. Pharmacol., 1996, 48, 1128 CrossRef CAS PubMed.
- D. P. Kini, S. Pandey, B. D. Shenoy, U. V. Singh, N. Udupa, P. Umadevi, R. Kamath and R. K. Nagarajkumari, Indian J. Exp. Biol., 1997, 35, 374 CAS.
- M. R. Sunil Kumar, A. Kiran, A. Aravind, S. Gopal, N. Udupa, A. Karthik, M. Prashant, B. Krishnamoorthy and B. S. Satish Rao, Drug Delivery, 2010, 17, 103 CrossRef PubMed.
- C. Bothiraja, H. S. Kapare, A. P. Pawar and K. S. Shaikh, Ther. Delivery, 2013, 4, 1247 CrossRef CAS PubMed.
- U. V. Singh, K. S. Bisht, S. Rao, P. Uma Devi and N. Udupa, J. Pharm. Sci., 1996, 2, 407 CAS.
- U. V. Singh and N. Udupa, Indian J. Physiol. Pharmacol., 1997, 41, 171 CAS.
- A. Y. Kilcar, V. Tekin, F. Zumrut Biber Muftuler and E. Ilker Medine, J. Radioanal. Nucl. Chem., 2016, 308, 13 CrossRef.
- P. Srinivas, C. R. Patra, S. Bhattacharya and D. Mukhopadhyay, Int. J. Nanomed, 2011, 6, 2113 CrossRef CAS PubMed.
- S. B. Tiwari, R. M. Pai and N. Udupa, J. Drug Targeting, 2002, 10, 585 CrossRef CAS PubMed.
- M. R. Sunil Kumar, B. Kiran Aithal, N. Udupa, M. Sreenivasulu Reddy, V. Raakesh, R. S. R. Murthy, D. Prudhvi Raju and B. S. Satish Rao, Drug Delivery, 2011, 18, 511 CrossRef CAS PubMed.
- G. A. Kining, L. Li and T. L. M. Ten Hagen, Ther. Delivery, 2010, 5, 707 CrossRef.
- N. I. Marupudi, J. E. Han, K. W. Li, V. M. Renard, B. M. Tyler and H. Brem, Expert Opin. Drug Saf., 2007, 6, 609 CrossRef CAS PubMed.
- H. Kulhari, D. Pooja, S. K. Prajapati and A. S. Chauhan, Int. J. Pharm., 2011, 405, 203 CrossRef CAS PubMed.
- M. M. Van Schooneveld, E. Vucic, R. Koole, Y. Zhou, J. Stocks, D. P. Cormode, C. Y. Tang, R. E. Gordan, K. Nicolay, A. Meijerink, Z. A. Fayad and W. J. Mulder, Nano Lett., 2008, 8, 2517 CrossRef CAS PubMed.
- U. Kedar, P. Phutane, S. Shidhaye and V. Kadam, Nanomedicine, 2010, 6, 714 CAS.
- Y. P. Li, K. Xiao, J. T. Luo, J. Lee, S. R. Pan and K. S. Lam, J. Controlled Release, 2010, 144, 314 CrossRef CAS PubMed.
- M. S. Muthu, S. A. Kulkarni, J. Xiong and S. S. Feng, Int. J. Pharm., 2011, 421, 332 CrossRef CAS PubMed.
- N. Tang, G. J. Du, N. Wang, C. C. Liu, H. Y. Hang and W. Liang, J. Natl. Cancer Inst., 2007, 99, 1004 CrossRef CAS PubMed.
- E. M. Collnot, C. Baldes, U. F. Schafer, K. J. Edgar, M. F. Wempe and C. M. Lehr, Mol. Pharm., 2010, 7, 642 CrossRef CAS PubMed.
- D. Pooja, H. Kulhari, M. K. Singh, S. Mukherjee, S. S. Rachamalla and R. Sistla, Colloids Surf., B, 2014, 121, 461 CrossRef CAS PubMed.
- J. Dou, H. Zhang, X. Liu, M. Zhang and G. Zhai, Colloids Surf., B, 2014, 114, 20 CrossRef CAS PubMed.
- J. Zhao, Y. Mi and S. S. Feng, Biomaterials, 2013, 34, 3411 CrossRef CAS PubMed.
- V. Saxena and M. D. Hussain, Int. J. Nanomed., 2012, 7, 713 CAS.
- Y. Gao, L. B. Li and G. X. Zhai, Colloids Surf., B, 2008, 64, 194 CrossRef CAS PubMed.
- L. Y. Zhao, Y. K. Shi, S. H. Zou, M. Sun, L. B. Li and G. X. Zhai, J. Biomed. Nanotechnol., 2011, 7, 358 CrossRef CAS PubMed.
- Z. P. Zhang, S. H. Lee and S. S. Feng, Biomaterials, 2007, 28, 1889 CrossRef CAS PubMed.
- G. Wang, B. Yu, Y. Wu, B. Huang, Y. Yuan and C. S. Liu, Int. J. Pharm., 2013, 446, 24 CrossRef CAS PubMed.
- Y. Zhao, J. Neuzil and K. Wu, Mol. Nutr. Food Res., 2009, 53, 129 CAS.
- Y. T. Liu, K. Li, J. Pan, B. Liu and S. S. Feng, Biomaterials, 2010, 31, 330 CrossRef CAS PubMed.
- X. Li, Y. Zhang, Y. Fan, Y. Zhou, C. Fan, Y. Liu and Q. Zhang, Nanoscale Res. Lett., 2011, 6, 275 CrossRef PubMed.
- S. S. Kulthe, N. N. Inamdara, Y. M. Choudharia, S. M. Shirolikar, L. C. Borde and V. K. Mourya, Colloids Surf., B, 2011, 88, 691 CrossRef CAS PubMed.
- S. A. Love, J. W. Thompson and C. L. Haynes, Nanomedicine, 2012, 7, 1355 CrossRef CAS PubMed.
- J. H. Yen, C. L. Lei and H. T. Tung, J. Chromatogr. B: Anal. Technol. Biomed. Life Sci., 2006, 844, 1 CrossRef PubMed.
- C. Bothiraja, A. P. Pawar, K. S. Shaikh and P. Sher, Nanosci. Nanotechnol. Lett., 2009, 1, 156 CrossRef CAS.
- C. Bothiraja and A. P. Pawar, Eur. J. Drug Metab. Pharmacokinet., 2011, 35, 123 CrossRef PubMed.
- C. Bothiraja and A. P. Pawar, Int. J. Nanotechnol., 2011, 8, 764 CrossRef.
- C. Bothiraja, B. D. Yojana, A. P. Pawar, K. S. Shaikh and U. H. Thorat, Expert Opin. Drug Delivery, 2014, 11, 17 CrossRef CAS PubMed.
- C. Bothiraja, U. H. Thorat, A. P. Pawar and K. S. Shaikh, Mater. Sci. Technol., 2014, 29, B120 CrossRef CAS.
- Y. J. Surh, Nat. Rev. Cancer, 2003, 3, 768 CrossRef CAS PubMed.
- S. G. Gupta, J. H. Kim, S. Prasad and B. B. Agarwal, Cancer Metastasis Rev., 2010, 29, 405 CrossRef CAS PubMed.
- C. Oerlemans, W. Bult, M. Bos, G. Storm, J. F. Nijsen and W. E. Hennink, Pharm. Res., 2010, 27, 2569 CrossRef CAS PubMed.
- C. Bothiraja, M. B. Shinde, S. Rajalakshmi and A. P. Pawar, J. Pharm. Pharmacol., 2009, 61, 1465 CrossRef CAS PubMed.
- L. Mu, M. M. Teo, H. Z. Ning, C. S. Tan and S. S. Feng, J. Controlled Release, 2005, 103, 565 CrossRef CAS PubMed.
- M. S. Muthu, R. V. Kutty, Z. Luo, J. Xie and S. S. Feng, Biomaterials, 2015, 39, 234 CrossRef CAS PubMed.
- S. Kim, Y. Shi, J. Y. Kim, K. Park and J. X. Cheng, Expert Opin. Drug Delivery, 2010, 7, 49 CrossRef CAS PubMed.
- Y. Nishioka and H. Yoshino, Adv. Drug Delivery Rev., 2001, 47, 55 CrossRef CAS PubMed.
- D. Soma, J. Kitayama, H. Ishigami, S. Kaisaki and H. Nagawa, J. Surg. Res., 2009, 155, 142 CrossRef CAS PubMed.
- M. S. Muthu, S. A. Kulkarni, Y. Liu and S. S. Feng, Nanomedicine, 2012, 7, 353 CrossRef CAS PubMed.
- J. Quin, D. Engle, A. Litwiller, E. Peralta, A. Grasch, T. Boley and S. Hazelrigg, J. Surg. Res., 2005, 127, 139 CrossRef CAS PubMed.
- J. Neuzil, J. C. Dyason, R. Freman, L. F. Dong, L. Prochazka, X. F. Wang, I. Scheffler and S. J. Ralph, J. Bioenerg. Biomembr., 2007, 39, 65 CrossRef CAS PubMed.
|
This journal is © The Royal Society of Chemistry 2016 |
Click here to see how this site uses Cookies. View our privacy policy here.