Confinement of thermoresponsive microgels into fibres via colloidal electrospinning: experimental and statistical analysis†
Susana C. S. Marques,
Paula I. P. Soares *,
Coro Echeverria*,
Maria H. Godinho and
João P. Borges
 *
*
I3N – CENIMAT, Departamento de Ciência dos Materiais, Faculdade de Ciências e Tecnologia, FCT/UNL, 2829-516 Caparica, Portugal. E-mail: pi.soares@campus.fct.unl.pt; coro@fct.unl.pt; jpb@fct.unl.pt
First published on 8th August 2016
Abstract
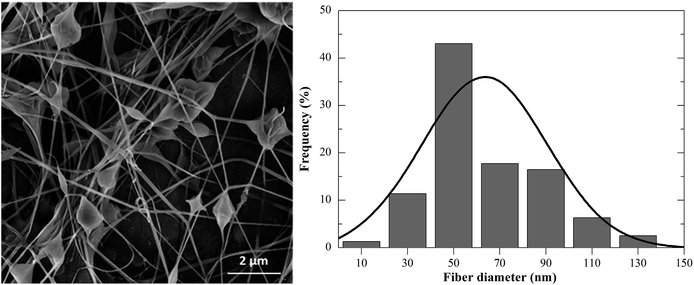
The strategy of confining stimuli-responsive microgels in electrospun fibres would allow the fabrication of polymeric networks that combine the microgels swelling ability and properties with the interest features of the electrospun fibres. Colloidal electrospinning is an emerging method in which fibres containing microgels can be produced by a single-nozzle and designed through the solution carrier materials. The incorporation of poly(N-isopropylacrylamide) (PNIPAAM) and PNIPAAM–chitosan (PNIPAAM–CS) in poly(ethyleneoxyde) (PEO) fibres via colloidal electrospinning producing composite fibres was the main purpose of the present work, which was confirmed by means of Scanning Electron Microscopy (SEM). Dynamic light scattering was used to analyse the microgels hydrodynamic diameter ranging up to 900 nm depending on the composition and temperature of the surrounding medium. By performing a statistical analysis the relationship of the processing variables over the fibre size was evaluated following the response surface methodology (RSM). From the set of parameters aimed to minimize the fibre diameter, composite fibres with an average diameter of 63 nm were produced. Only the as-prepared microgels with higher monodispersity provided “bead-on-a-string” morphologies.
Introduction
In the field of polymeric materials, microgels – intramolecularly crosslinked polymer particles – are found to be in an outstanding position due to their versatility from both fabrication/synthesis and application perspectives.1,2 For instance, stimuli responsive or “smart” polymeric microgels can be synthesised by radical polymerization of intrinsic thermoresponsive monomers3–6 or copolymerized with monomers that could infer additional functionalities.7–9 They can also be hybridized by encapsulation or in situ growth of metallic/magnetic nanoparticles embedded in the microgel matrix ending up with multi-responsive systems.10–12 By exploiting such versatility, microgel particles can be fabricated for a wide spectra of applications ranging from industrial (paints, ink printings, cements, oil recovery) to promising biomedical applications2 (protein purification,13 drug delivery,14 molecular imprinting,15 carriers,16 among others). It is of importance to highlight that microgels have also been thought of as building blocks to infer self-healing properties in layer-by-layer fabricated hydrogels.17 Authors took advantage of their swelling ability and dynamic in the solvated state to induce a fast and autonomous self-healing ability to the hydrogel.18,19Following this thread, in this contribution we pursue the confinement of thermoresponsive microgels in electrospun fibres that could behave as active sites in electrospun non-woven mats, as a first step toward the fabrication of a polymeric network that would have potential biomedical applications and added self-healing abilities. In particular, we propose the colloidal electrospinning method as a tool for both the confinement of thermoresponsive microgels and the development of a desired architecture/morphology. In this line, encapsulating microgels in a fibre matrix is a process mainly dictated by the features and behaviour of the precursor materials in the fibre solution carrier.20 Understanding more about the evolution from the precursor materials to the electrospun composite fibers can help to forecast appropriate designs, allowing the effective core encapsulation and desired fibre's aspect ratio towards the improvement of their performance in target applications. Previous studies in colloidal electrospinning showed the production of functional surfaces by encapsulating thermoresponsive microgels with different concentrations of particles in the feeding solution.21,22 Despite of these interesting studies, spinning “smart” microgels within polymers with low or no affinities to each other still presents challenges in design and efficiency of the process.23 The manipulation of the core-diameter-to-shell-diameter and fibre diameter would allow the production of fibres with the desired aspect ratio.
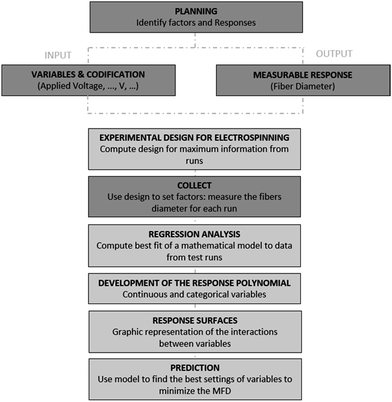
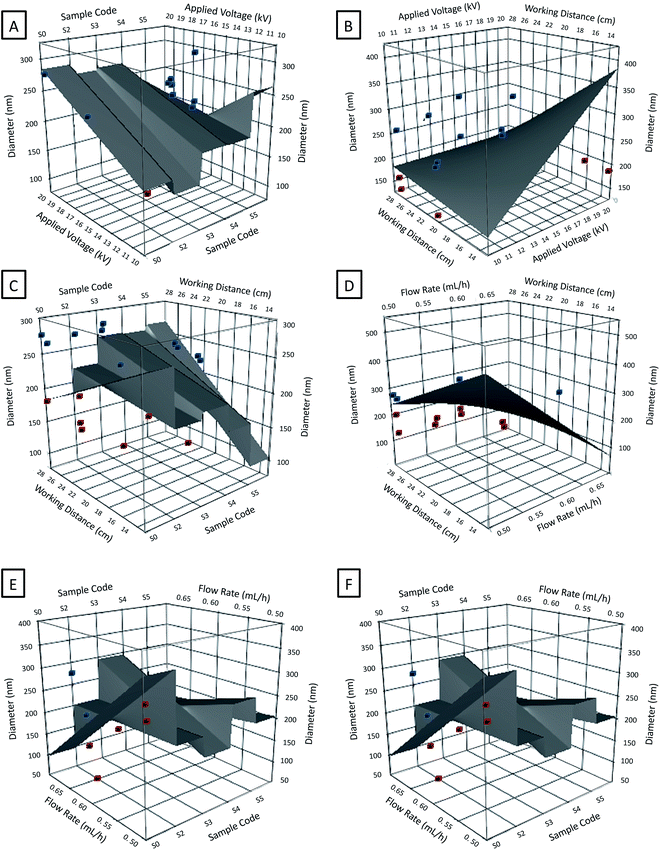
Therefore, in this work two main objectives are pursued; first, the confinement of thermoresponsive microgels in polymer fibres (poly(ethylene oxide), PEO) in order to obtain composite fibers by means of colloidal electrospinning; and second, we aim to control the architecture of the composite fibers in terms of the aspect ratio by minimizing its diameter using the Response Surface Methodology (RSM) as a statistic tool. With this methodology we will be able to optimize the electrospinning processing parameters24 and to understand their influence on the diameter of the fibres and on the confinement of microgels. Thus, the relationship between the fibre diameter and the process parameters is visualized by response surfaces, which gives access to the relative influence of each variable on the fibre diameter.25
Experimental section
Materials
N-Isopropylacrylamide (NIPAAM, Aldrich Chemistry, 97%) was used as monomer and N,N-methylene bis-acrylamide (MBA, Sigma-Aldrich, 99%) as cross-linker, ammonium persulfate was chosen as initiator (APS, Sigma-Aldrich, 99%) and sodium bisulfite (SBS, Acrös Organics) was used as catalyzer. All reagents were used as received without any further purification. High molecular weight chitosan (CS, 469 kDa, Cognis) was depolymerized using glacial acetic acid (Panreac) and sodium nitrite (NaNO2, EKA) in order to obtain low molecular weight CS through the oxidative fragmentation.26 Ethanol (C2H6O, Scharlau, analytic grade) and poly-ethylene oxide (PEO, Sigma Aldrich, Mw = 5![[thin space (1/6-em)]](https://www.rsc.org/images/entities/char_2009.gif) 000
000![[thin space (1/6-em)]](https://www.rsc.org/images/entities/char_2009.gif) 000 Da) were used in the study.
000 Da) were used in the study.
Methods
| Sample code | NIPAAM (g) | CSb (wt%) | CSb (kDa) |
|---|---|---|---|
| a Weight percentages of MBA, APS and SBS were determined as a function of NIPAAM total mass for 10, 10 and 5 wt%, respectively.b CS content was determined in respect to the total mass of NIPAAM using different molecular weights of CS namely 30, 50 and 85 kDa. | |||
| PNIPAAMa | 2.5 | — | — |
| PNIPAAM–CS1 | 1 | 20 | 85 |
| PNIPAAM–CS2 | 30 | ||
| PNIPAAM–CS3 | 40 | 30 | |
| PNIPAAM–CS4 | 50 | ||
| PNIPAAM–CS5 | 85 | ||
Fibre template solution was prepared by dissolving 2 wt% of PEO in the mixture water/ethanol at a ratio of 4![[thin space (1/6-em)]](https://www.rsc.org/images/entities/char_2009.gif) :
:![[thin space (1/6-em)]](https://www.rsc.org/images/entities/char_2009.gif) 1 (v/v). The as-prepared microgel dispersions were mixed to the PEO spinning solution in a ratio of 1
1 (v/v). The as-prepared microgel dispersions were mixed to the PEO spinning solution in a ratio of 1![[thin space (1/6-em)]](https://www.rsc.org/images/entities/char_2009.gif) :
:![[thin space (1/6-em)]](https://www.rsc.org/images/entities/char_2009.gif) 1 (v/v) under magnetic stirring during 5 h for further colloidal electrospinning process.
1 (v/v) under magnetic stirring during 5 h for further colloidal electrospinning process.
Characterization
The hydrodynamic diameter of the microgels were analysed by dynamic light scattering (DLS) using a Horiba SZ-100 Nanopartica series Analyser Light Scattering instrument equipped with 592 nm He–Ne laser for a scattering angle of 90° and an autocorrelator SZ-100. The swelling properties of microgel dispersions were accessed by increasing the temperature from 25 °C to 42 °C with a Peltier system (25 °C) within disposable cuvette cells. All measurements were carried out for highly diluted dispersions.The morphology of the as-prepared microgel dispersions as well as the composite electrospun non-woven mats were checked by means of scanning electron microscopy equipped with a Carl Zeiss Auriga CrossBeam system (SEM-FIB). To observe the distribution size of microgels, one drop of aqueous dispersions of each sample under study was deposited on Formvar carbon-coated Cu grid. While the small pieces of the non-woven mats were fixed on conductive carbon tape, mounted on the support and then sputtered with a thin layer of gold/palladium (8–10 nm) using Q300T D sputter coater. For the composite fibres, at least 50 diameters of dried microgels were measured for the minor axis (perpendicular to length fibre) and about 100 fibres were measured to obtain the average diameter per SEM micrograph.
Design of experiments
Results and discussion
Microgel dispersions as precursor materials
Electrospinning of colloidal systems is a process mainly dictated by the precursor materials composition, stability and homogeneity.30,31 In this work, since thermoresponsive microgels are the precursor material it is crucial to determine and understand microgels properties to be further electrospun within PEO fibres. In order to test the ability of the microgels to shape the surface of fibres and analyse the influence of their features in the process, the precursor materials were analysed by SEM and DLS techniques.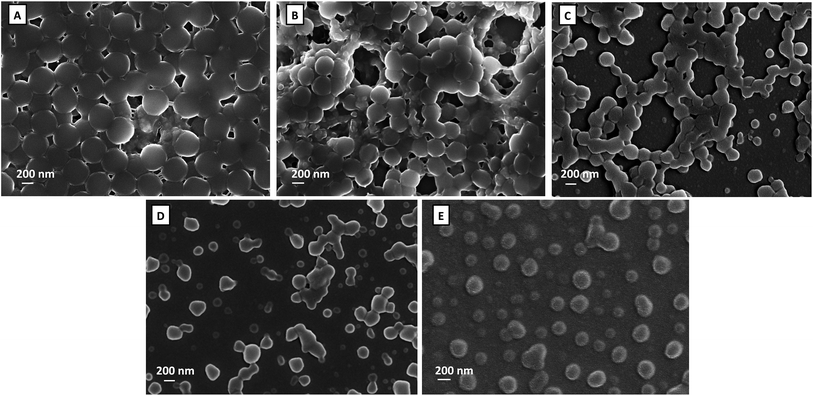 | ||
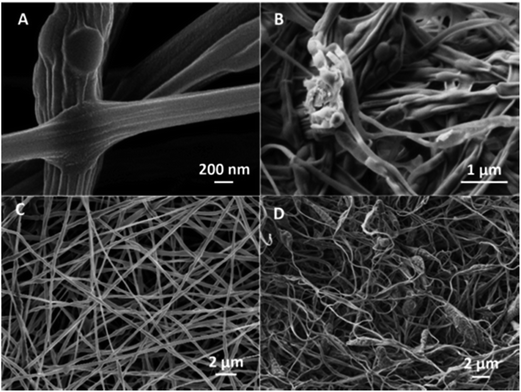
| Fig. 1 SEM micrographs corresponding to the samples PNIPAAM (A) and PNIPAAM/CS containing 20% (B), 30% (C) and 40% of CS with 50 kDa (D) and 85 kDa (E). | ||
| Sample code | SEM diameter (nm) | VPTT (°C) |
|---|---|---|
| PNIPAAM | 525 ± 20 | 34 |
| PNIPAAM–CS1 | 348 ± 45 | 35 |
| PNIPAAM–CS2 | 292 ± 59 | 36 |
| PNIPAAM–CS4 | 217 ± 75 | 37 |
| PNIPAAM–CS5 | 283 ± 55 | 36 |
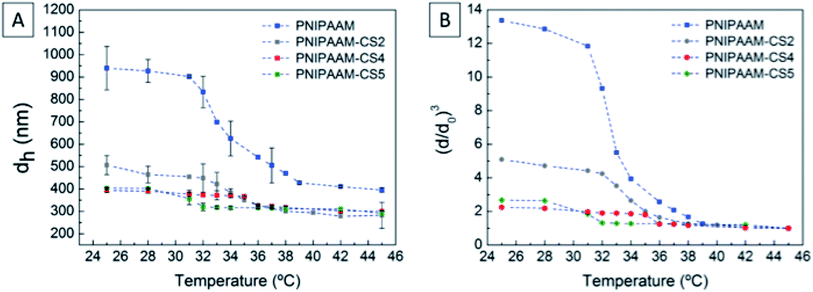
In previous work27 we determined that below 20% of CS no stable dispersions were obtained. Additionally, for the sample containing 20% of CS we determined that there was no sufficient NH3+ groups to ensure the effective complexation of the CS with PNIPAAM, which led to free CS in the system that was detected by an unexpected increase of the hydrodynamic diameter above the VPTT. In the present work a similar unexpected increase in hydrodynamic diameter well above the VPTT was also detected for the sample containing 20% and the one containing 40% of CS with 30 kDa.
To further understand the microgels' behaviour during the electrospinning process we focused in the volume phase transition temperature (VPTT), the critical temperature at which microgel particles start to collapse. Slight differences are observed in the VPTT between PNIPAAM and PNIPAAM–CS samples, in fact the VPTT occurs at 31–32 °C which is the intrinsic LCST of the parent polymer, although a less defined transition is observed as the content of CS is increased.
Electrospun composite fibres
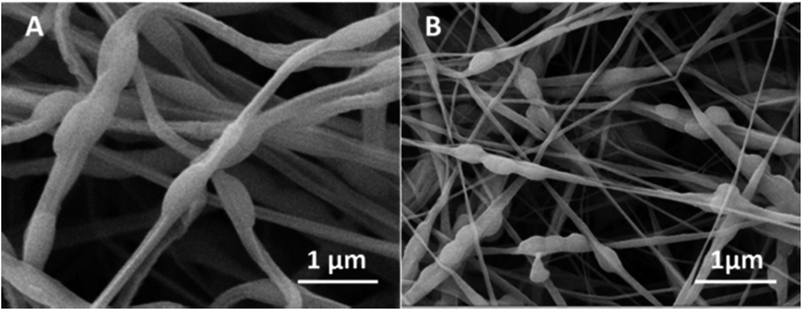 | ||
| Fig. 3 SEM micrograph of PEO fibres incorporating (A) PNIPAAM microgels and; (B) PNIPAAM–CS1 microgels. | ||
Considering that the electrospinning process was performed at temperatures slightly above the VPTT of microgels, the observed diameters of the microgels in the fibres are similar to their hydrodynamic diameter when collapsed (DLS tests in Table 3). This fact could be explained considering that at such temperatures the solvent evaporation in the electrospinning process occurs while microgels are in their collapsed state. The fast evaporation of solvents may “freeze” microgels in such collapsed state which is maintained in the non-woven mat. It is also noticeable an ellipsoidal appearance of the beads often observed in the colloidal electrospinning. This behaviour is a consequence of the electrostatic forces involved in the process, which induced the change of shape of the largest microgels in the Taylor cone.31
| Sample code | DLS measurements | SEM measurements | |
|---|---|---|---|
| dh in the swollen state (nm) | dh in the collapsed state (nm) | Microgels' diameter inside the fibers (nm) | |
| PNIPAAM | 940 ± 97 | 396 ± 10 | 367 ± 100 |
| PNIPAAM–CS1 | 485 ± 14 | 329 ± 32 | 252 ± 105 |
| PNIPAAM–CS2 | 507 ± 42 | 286 ± 58 | 238 ± 70 |
| PNIPAAM–CS3 | 531 ± 18 | 363 ± 17 | 216 ± 54 |
| PNIPAAM–CS4 | 393 ± 8 | 300 ± 3 | 197 ± 54 |
| PNIPAAM–CS5 | 404 ± 1 | 292 ± 2 | 188 ± 52 |
In colloidal electrospinning the fibres' morphologies can be differentiated either as core–shell,36 “bead-on-a-string”,21 spindle-like,35 corn-type structures,37 burst-beads38 or a dispersion of the separated phase within the polymer fibre matrix.39 Different factors may induce a fibre morphology change at the selected processing parameters.40 In this case, the influence of the composition of the as-prepared microgels can be observed. Comparing the surfaces of the fibres containing PNIPAAM microgels (Fig. 4A and C) to those that incorporate PNIPAAM–CS microgels (Fig. 4B and D) noticeable differences in the roughness of the electrospun non-woven mats are observed. PEO fibres containing PNIPAAM–CS microgels show higher roughness but also reveal the formation of clusters within beads as early presented in SEM images of the corresponding as-prepared microgel dispersions (Fig. 1B–E).
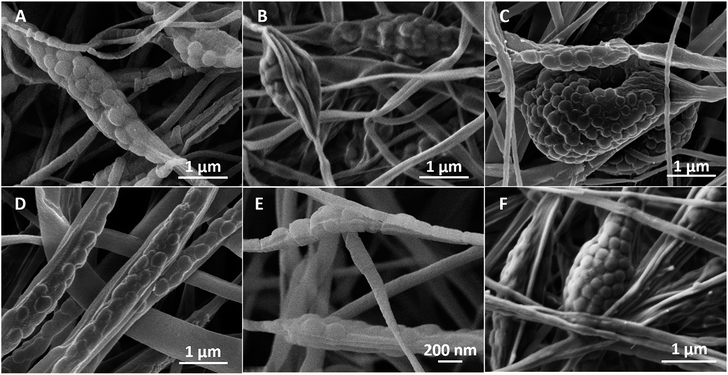
Fig. 5A–C shows the evolution of the morphology of the beads in the composite fibres by varying the molecular weight of chitosan, whereas the Fig. 5D–F illustrates the appearance of the beads for microgels with different amounts of chitosan. As a preliminary remark, by increasing both Mw and CS content, the beads evolved from elongated and stretched to protruding clusters with larger volume encompassing several microgels. This might be related to the change from positive to negative surface charge of the PNIPAAM–CS microgels upon addition of chitosan28 which provides favourable conditions to create agglomerates. Nevertheless, the hydrodynamic diameter of the microgels as well as their swelling ability decreased with the incorporation of chitosan, which might favour the production of these agglomerates.
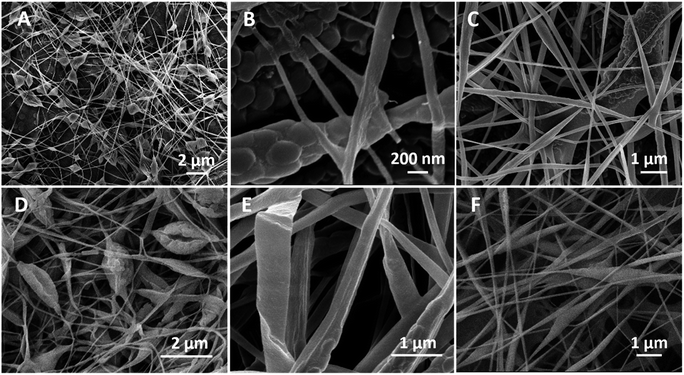
In terms of the optimized electrospun non-woven mat, the fibres do not ensure the effective encapsulation of the microgels as showed by the phase separation between the matrixes and several PNIPAAM cross-linked particles observed in Fig. 6A. Only few of the microgels were kept inside the fibres and the fibres mechanical's quality was compromised. For the systems shown in Fig. 6B and C we observed an average microgel diameter with the twice of the size of the mean fibre diameters. When the jet flows through the needle-tip towards the collector, expanding and bending instabilities take place.35 If the width of the fibre is diminished, the surrounding fluid may no longer have enough mass to fully involve the microgels in its extension, leading to the phase separation with the resulting fibres containing melted interconnections.
Fast solvent evaporation can cause morphologic defects such as burst-beads38 and ribbon structures showed in Fig. 6D and E, respectively.23,41–43 Burst-beads are more frequently noted when a polymeric skin on the jet is formed covering the dispersed particles at first and then collapsing with a quick evaporation of the solvents.38 The sharper spindle-like structures in Fig. 6F were often observed for the PEO fibres incorporating microgels without CS or with the lowest concentration of CS that likewise may decrease the whole polymer concentration.21,44
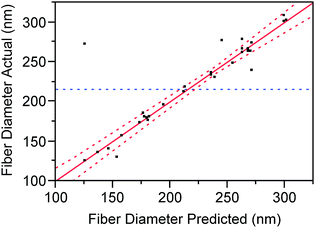
Statistical reports obtained from the fitting of the model, which are a measure of the amount of variability on the fibre diameter towards the explanatory variables, give rise to the following values: mean 210.3 nm; R2 0.99; Radj2 0.98; p < 0.0001. The statistical reports R2 and adjacent R2 indicate how well the model fits the experimental data. The value of R2 is a measure of the response being represented by its predictors, which always increases when a new term is added to the model regardless of whether the inclusion of the additional variable is statistically significant or not. On the contrary, the R2 report may or not increase when more terms are included, thereby it will increase if the new terms improve the model but will otherwise decrease with insignificant terms. In this work, R2 illustrates that 99% of the MFD are explained by the variables whereas the adjacent R2 indicates that the model predicts 98% of the variability over the fibre diameter evolution within the selected parameters space.
The accuracy of the model also can be understood by the linear regression of the experimental values of the MFD as a function of the predicted diameters (Fig. 7). From our graphic representation a strong correlation between the model's predictions and its actual results can be observed; fact that supports the good accuracy of the model, as early demonstrated by the almost null values of the model statistical reports. For each modelled effect, an optimal estimative tested by a null hypothesis is given, contributing to the calculations of the equation model. The p-values test the null hypothesis illustrating how statistical significant is a certain estimate which is rejected in a confidence of (1 − p-value) > 0.95 (Table S2† summarizes the main coefficients and their statistical reports).
| Variable term | Spinning dispersions code |
|---|---|
| S0 | PNIPAAM microgels/PEO |
| S1 | PNIPAAM–CS1 microgels/PEO |
| S2 | PNIPAAM–CS2 microgels/PEO |
| S3 | PNIPAAM–CS3 microgels/PEO |
| S4 | PNIPAAM–CS4 microgels/PEO |
| S5 | PNIPAAM–CS5 microgels/PEO |
Conclusions
This work demonstrates the effective confinement of thermoresponsive microgels in PEO electrospun fibers via colloidal electrospinning. The statistical analysis provides an effective means to study and predict the behaviour of the process towards the production of ultra-fine composite fibres. Using RSM the number of experiments was significantly reduced, generating a larger amount of information from a small number of experiments while maintaining a high level of analysis accuracy. The test of the forecasted variables aimed to minimize the size of the fibres, which resulted in the production of PEO nanofibres with a mean diameter of 63 nm, proving the ability of the procedure to predict the optimum conditions. The reduction of the fibre size to less than half of the microgel's diameter may compromise the effective encapsulation of such dispersed particles in the fibre carrier solution. Further experiments show that increasing both Mw and the content of CS in the precursor microgel dispersions affected their distribution within the PEO fibre changed from randomly distributed to agglomerates. The overall study on the morphology showed outstanding results to tailor the architecture of the composite fibres when compared with the state-of-art without statistical approaches. This report opens new strategies to design desired architectures via colloidal electrospinning by taking advantage of thermoresponsive microgels as potential active sites in composite electrospun fibers with potential biomedical applications such as drug delivery systems, biosensors or even self-healing materials.Acknowledgements
This work is funded by FEDER funds through the COMPETE 2020 Programme and National Funds through FCT – Portuguese Foundation for Science and Technology under the project UID/CTM/50025/2013. We also acknowledge support from the Portuguese Science and Technology Foundation through grant SFRH/BPD/88779/2012 (CE).Notes and references
- B. R. Saunders and B. Vincent, Adv. Colloid Interface Sci., 1999, 80, 1–25 CrossRef CAS.
- B. R. Saunders, N. Laajam, E. Daly, S. Teow, X. Hu and R. Stepto, Adv. Colloid Interface Sci., 2009, 147–148, 251–262 CrossRef CAS PubMed.
- A. Pich and W. Richtering, in Advances in Polymer Science, 2010, vol. 234, pp. 1–37 Search PubMed.
- R. Pelton, Adv. Colloid Interface Sci., 2000, 85, 1–33 CrossRef CAS PubMed.
- A. Imaz and J. Forcada, J. Polym. Sci., Part A: Polym. Chem., 2008, 46, 2510–2524 CrossRef CAS.
- J. Ramos, A. Imaz, J. Callejas-Fernández, L. Barbosa-Barros, J. Estelrich, M. Quesada-Pérez and J. Forcada, Soft Matter, 2011, 7, 5067–5082 RSC.
- C. Echeverria, D. López and C. Mijangos, Macromolecules, 2009, 42, 9118–9123 CrossRef CAS.
- M. Bradley, J. Ramos and B. Vincent, Langmuir, 2005, 21, 1209–1215 CrossRef CAS PubMed.
- C. Johansson, J. Gernandt, M. Bradley, B. Vincent and P. Hansson, J. Colloid Interface Sci., 2010, 347, 241–251 CrossRef CAS PubMed.
- C. Echeverria and C. Mijangos, Macromol. Rapid Commun., 2010, 31, 54–58 CrossRef CAS PubMed.
- C. Echeverria and C. Mijangos, Langmuir, 2011, 27, 8027–8035 CrossRef CAS PubMed.
- C. Echeverria, P. Soares, A. Robalo, L. Pereira, C. M. M. Novo, I. Ferreira and J. P. Borges, Mater. Des., 2015, 86, 745–751 CrossRef CAS.
- B. Mizrahi, S. Irusta, M. McKenna, C. Stefanescu, L. Yedidsion, M. Myint, R. Langer and D. S. Kohane, Adv. Mater., 2011, 23, H258–H262 CrossRef CAS PubMed.
- J. K. Oh, R. Drumright, D. J. Siegwart and K. Matyjaszewski, Prog. Polym. Sci., 2008, 33, 448–477 CrossRef CAS.
- W. Wu, J. Shen, Y. Li, H. Zhu, P. Banerjee and S. Zhou, Biomaterials, 2012, 33, 7115–7125 CrossRef CAS PubMed.
- W.-F. Lai, A. S. Susha and A. L. Rogach, ACS Appl. Mater. Interfaces, 2016, 8, 871–880 CAS.
- A. B. South and L. A. Lyon, Angew. Chem., Int. Ed., 2010, 49, 767–771 CrossRef CAS PubMed.
- J. C. Gaulding, M. W. Spears and L. A. Lyon, Polym. Chem., 2013, 4, 4890–4896 RSC.
- M. W. Spears, E. S. Herman, J. C. Gaulding and L. A. Lyon, Langmuir, 2013, 30, 6314–6323 CrossRef PubMed.
- C. Wang, L. Wang and M. Wang, Mater. Lett., 2014, 124, 192–196 CrossRef CAS.
- S. Y. Gu, J. B. Li, J. Ren and Z. M. Wang, Macromol. Mater. Eng., 2010, 295, 32–36 CrossRef CAS.
- J. E. Diaz, A. Barrero, M. Marquez, A. Fernandez-Nieves and I. G. Loscertales, Macromol. Rapid Commun., 2010, 31, 183–189 CAS.
- D. Crespy, K. Friedemann and A.-m. Popa, Macromol. Rapid Commun., 2012, 33, 1978–1995 CrossRef CAS PubMed.
- O. S. Yördem, M. Papila and Y. Z. Menceloğlu, Mater. Des., 2008, 29, 34–44 CrossRef.
- M. Mohammadian and A. K. Haughi, Bulg. Chem. Commun., 2014, 46, 545–555 Search PubMed.
- P. I. P. Soares, A. I. Sousa, J. C. Silva, I. M. M. Ferreira, C. M. M. Novo and J. P. Borges, Carbohydr. Polym., 2016, 147, 304–312 CrossRef CAS PubMed.
- C. Echeverria, P. Soares, A. Robalo, C. M. M. Novo, J. P. Borges, I. Ferreira and L. Pereira, Mater. Des., 2015, 86, 745–751 CrossRef CAS.
- M. K. Jaiswal, R. Banerjee, P. Pradhan and D. Bahadur, Colloids Surf., B, 2010, 81, 185–194 CrossRef CAS PubMed.
- M. A. Bezerra, L. a. Escaleira, E. P. Oliveira, R. E. Santelli and L. S. Villar, Talanta, 2008, 76, 965–977 CrossRef CAS PubMed.
- M. A. Badawi and L. K. El-Khordagui, Eur. J. Pharm. Sci., 2014, 58, 44–54 CrossRef CAS PubMed.
- M. Angeles, H. L. Cheng and S. S. Velankar, Polym. Adv. Technol., 2008, 19, 728–733 CrossRef CAS.
- J. Wu and Z. Hu, Dekker Encyclopedia of Nanoscience and Nanotechonology, 2004, pp. 1967–1976 Search PubMed.
- J. Wu, N. Wang, Y. Zhao and L. Jiang, J. Mater. Chem. A, 2013, 1, 7290 CAS.
- X. Hu, S. Liu, G. Zhou, Y. Huang, Z. Xie and X. Jing, J. Controlled Release, 2014, 185, 12–21 CrossRef CAS PubMed.
- H. Qi, P. Hu, J. Xu and A. Wang, Biomacromolecules, 2006, 7, 2327–2330 CrossRef CAS PubMed.
- A. V. Bazilevsky, A. L. Yarin and C. M. Megaridis, Langmuir, 2007, 2311–2314 CrossRef CAS PubMed.
- S. Agarwal and A. Greiner, Polym. Adv. Technol., 2011, 22, 372–378 CrossRef CAS.
- S. Maretschek, A. Greiner and T. Kissel, J. Controlled Release, 2008, 127, 180–187 CrossRef CAS PubMed.
- S. Yan, L. Xiaoqiang, L. Shuiping, M. Xiumei and S. Ramakrishna, Colloids Surf., B, 2009, 73, 376–381 CrossRef PubMed.
- M. P. Prabhakaran, S. Ramakrishna and M. Zamani, Int. J. Nanomed., 2013, 8, 2997–3017 Search PubMed.
- F. Elahi, G. Guoping, F. Khan and W. Lu, J. Bioeng. Biomed. Sci., 2013, 3, 1–14 Search PubMed.
- Y. E. Choonara, C. Dott, V. M. K. Ndesendo, L. C. du Toit, V. Pillay, L. Tomar, P. Kumar and C. Tyagi, J. Nanomater., 2013, 1–23 Search PubMed.
- D. N. Rockwood, D. B. Chase, R. E. Akins and J. F. Rabolt, Polymer, 2008, 49, 4025–4032 CrossRef CAS.
- N. Bhardwaj and S. C. Kundu, Biotechnol. Adv., 2010, 28, 325–347 CrossRef CAS PubMed.
- H. M. Khanlou, A. Sadollah, B. C. Ang, J. H. Kim, S. Talebian and A. Ghadimi, Neural Computing and Applications, 2014, 25, 767–777 CrossRef.
- S. Sukigara, M. Gandhi, J. Ayutsede, M. Micklus and F. Ko, Polymer, 2004, 45, 3701–3708 CrossRef CAS.
- I. Chun, H. Fong and D. H. Reneker, Polymer, 1999, 40, 4585–4592 CrossRef.
Footnote |
| † Electronic supplementary information (ESI) available: The defined design of experiments. See DOI: 10.1039/c6ra12713d |
| This journal is © The Royal Society of Chemistry 2016 |

