The PANI-DBSA content and dispersing solvent as influencing parameters in sensing performances of TiO2/PANI-DBSA hybrid nanocomposites to ammonia

S. Mikhaylovab, N. A. Ogurtsova, N. Redonb, P. Coddevilleb, J.-L. Wojkiewicz*b and A. A. Pud*a
aInstitute of Bioorganic Chemistry and Petrochemistry, National Academy of Sciences of Ukraine, 50 Kharkivske Shose, 02160, Kyiv, Ukraine. E-mail: alexander.pud@gmail.com; pud@bpci.kiev.ua; Tel: +380 44 559 70 03
bMines Douai, Département Sciences de l'Atmosphère et Génie de l'Environnement (SAGE), 941 Rue Charles Bourseul, F-59508 Douai, France. E-mail: jean-luc.wojkiewicz@mines-douai.fr; Tel: +33 27 71 23 33

Received 16th May 2016 , Accepted 26th August 2016

First published on 26th August 2016


Abstract

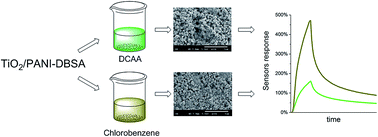
We demonstrate here strong influences of the content of polyaniline (PANI) doped with dodecylbenzenesulfonic acid (DBSA) and the nature of dispersing solvents chlorobenzene (CB) and dichloroacetic acid (DCAA) on the morphology and sensing properties of TiO2/PANI-DBSA hybrid nanocomposite layers cast on transducer electrodes. The obtained results evidence that these effects are caused by the solubility of the PANI component of the synthesized nanocomposites in the solvents and the boiling temperature of the latter. To estimate a quantitative effect of PANI, we used the real contents of the PANI-DBSA component/phase determined from the PANI polymerization yield. The highest magnitudes and rates of the sensor responses to gaseous ammonia are shown by the nanocomposite layer with an intermediate PANI-DBSA content (18.9 wt%) and cast from the nanocomposite dispersion in CB. We explain this effect by the specific morphology of the layer, which appears to be due to the poor solubility of the PANI-DBSA component in this solvent. The comparison of sensitivity of the chemically synthesized nanocomposites to ammonia with that of their mechanically mixed analogs demonstrates the better sensing performance of the former.

1. Introduction

Intrinsically conducting polymers (ICP), such as polyaniline (PANI), polypyrrole, polythiophene and their derivatives have been used as the active layers of gas sensors since the early 1980s due to their high sensitivity, relative ease of synthesis and ability to detect gases at ambient temperature.1,2 It has been shown that their sensing performances and stability can be enhanced by formation of ICP-based nanocomposites through incorporation of a second component. In case of PANI, the nanocomposite formation is typically realized by blending with an inert matrix (usually a polymer) or solution polymerization in the presence of dispersed particles of different size and nature.2 The latter is a simple and cheap approach, allowing formation of PANI nanocomposites with core–shell morphology without any special and expensive equipment3 and simultaneous improvement of gas sensing performances, such as response time, sensitivity, detection limit, stability and durability.4–7 It is well known that these nanocomposites typically give strong sensor responses to basic substances (e.g. to ammonia) due to the ability of the PANI component to participate in acid–base interactions, which underlie the gas sensing mechanism of PANI-based sensor materials:1,8

Specifically, PANI nanocomposites with TiO2 allowed to reach a record detection limit down to 50 ppt upon the gaseous ammonia sensitivity measurement.9 Recently we have studied the effects of acid-dopants dodecylbenzenesulfonic (DBSA) and laurylsulfuric (LSA) acids, which are anionic surfactants allowing preparation of conductive nanostructured PANI with enhanced processability and properties,10,11 on hybrid core–shell TiO2/PANI-dopant nanocomposites sensitivity to ammonia and amines.12 It was found that the DBSA-doped nanocomposite possess higher response levels together with the good linearity in the wide humidity range (Fig. 1).12


image file: c6ra12693f-f1.tif
Fig. 1 Mechanism of PANI–ammonia interactions, which form sensor responses of PANI based materials (adapted from ref. 1 and 8).

Naturally, the majority of the nanocomposites sensing properties depend on the doped PANI loading and nanocomposite morphology as well as on physical and physico-chemical interactions between the constituting components.2,13–16 In general, when the polymer content prevails, the properties of such nanocomposites tend to those of the pure polymer. At a low PANI content the contribution of specific chemical and physical interactions between the polymer and bearing/matrix component becomes stronger and leads to changes in doped PANI structure and morphology.17 Moreover, it has been shown recently that the small thickness of the PANI-DBSA shell in multiwall carbon nanotubes (MWCNT)/PANI-DBSA nanocomposites leads to response/recovery times shortening assigned to more facile diffusion of analyte molecules to the sensing sites/clusters.18 At the same time, to our knowledge the information on influence of PANI content in TiO2/PANI nanocomposites on ammonia sensing properties is limited only to a few publications.19,20

Obviously, in case of dopant-induced PANI solubility21,22 the influence of PANI content is closely related to an important issue of formation of PANI based sensing layers by nanocomposite dispersions casting (drop-casting, spincoating) on interdigitaded electrodes. In this case, changes in initial nanocomposite morphology are possible as a consequence of the polymer phase partial dissolution.23 Inevitably, the ability of a solvent to dissolve doped PANI phase/shell from the core particle surface when dispersing should influence the sensing capacity of the formed composite layer. At the same time, an additional effect of secondary doping on electrical, optical and structural PANI properties can be observed in the case of using specific solvents such as e.g. m-cresol or dichloroacetic acid (DCAA).24,25 In particular, DCAA appeared to be a good alternative to m-cresol allowing to achieve highly crystalline and conductive PANI.26 However, the PANI partial protonation with DCAA in addition to the primary dopant was observed.26 Moreover, using DCAA for blending in the joint solution of PANI doped with camphorsulfonic acid and the polyurethane allowed fabrication of thin polymer–polymer composite films which acted as sensitive layers in ammonia chemoresistive sensors.2 Nevertheless, the question about the influence of the PANI component dissolution on sensing and other properties of hybrid nanocomposites still remains open.

The aim of this study is to better understand the influences of the doped PANI content and dispersing solvents mainly in terms of solubility and morphological impacts on sensing properties of hybrid nanocomposites of doped PANI with TiO2 nanoparticles. We believe that these factors are still underestimated but have independent practical significance for the applications of the PANI-containing hybrid nanocomposites. In line with this view, we do not consider here other important factors of influence on these materials such as formation of p–n junction, change of PANI properties and structure due to interaction with TiO2, adsorption of analyte at TiO2 surface, etc., which have been carefully considered in other publications (e.g. ref. 9, 12, 13, 19 and 20). As objects of the research we used TiO2/PANI-DBSA nanocomposites and two solvents with different dissolving ability, namely chlorobenzene (CB) and DCAA to study how their combinations can govern sensing responses of the nanocomposites. DBSA was chosen as the acid-dopant due to both its known ability21 to facilitate PANI solubility and previously confirmed high sensitivity of the TiO2/PANI-DBSA core–shell nanocomposites to ammonia and relative analytes.12 In this research these DBSA abilities allowed us to discriminate effect of the dispersing solvents on morphology and sensing performances of the formed TiO2/PANI-DBSA layers. We used here typical ammonia-air mixtures as the illustrative example of the basic analyte media just to display the expected effects.

2. Experimental

2.1. Materials

Aniline (Merck) was distilled under vacuum and stored under argon at 3–5 °C. The reagent grade ammonium persulfate (APS) (Ukraine) and DBSA (Acros), TiO2 anatase nanoparticles 5–10 nm (MTI Corporation), DCAA (Sigma Aldrich) and CB (Sigma Aldrich) solvents were used as received.

2.2. The nanocomposites syntheses

The nanocomposites formation was based on the typical oxidative aniline polymerization procedure with some modifications.2 In short, the fabrication process involved aniline polymerization at 10 °C under the action of ammonium persulfate in the presence of the acid-dopant DBSA and TiO2 nanoparticles dispersed in the reaction medium. Different contents of PANI in the nanocomposites were predetermined by the initial weight ratios TiO2/aniline in the reaction mixture: 95/5; 90/10 and 80/20. We used typical aniline[thin space (1/6-em)]:[thin space (1/6-em)]oxidant[thin space (1/6-em)]:[thin space (1/6-em)]DBSA molar ratios 1[thin space (1/6-em)]:[thin space (1/6-em)]1.25[thin space (1/6-em)]:[thin space (1/6-em)]1.5. The reference pure PANI-DBSA was synthesized under the same conditions but in absence of TiO2.

The synthesized PANI nanocomposites were purified by dialysis against distilled water for 72 hours and dried under vacuum at 60 °C to a constant weight.

2.3. Evaluation of PANI content in the nanocomposites

The polymer yield determination was carried out according to the slightly modified protocol described elsewhere with a help of Specord M40 UV-Vis spectrophotometer.17 In short, the pure PANI and its nanocomposites were dedoped with 0.5% water ammonia solution. Then the fixed portions of the dedoped PANI containing powders were placed in 5 ml N-methylpyrrolidone (NMP) containing 0.5 g of ascorbic acid to be reduced to leucoemeraldine state. The obtained leucoemeraldine solutions were centrifuged for 15 min at 5000 rpm in order to remove TiO2 nanoparticles. The absorption maxima of the investigated leucoemeraldine solutions (after subtraction of the NMP spectrum) were used for the calculations of the dissolved PANI quantity, its polymerization yield and contents in dedoped and doped states in the synthesized nanocomposites (Table 1).
Table 1 Description of the synthesized nanocomposites
a The real dedoped PANI contents in the nanocomposites were recalculated for the doped PANI one in the form of the salt PANI(DBSA)0.5 with the stoichiometric ratio of DBSA and the imine nitrogens of PANI.b NC is a general abbreviation of the nanocomposite; numerals display the rounded calculated content of PANI-DBSA based on the real dedoped PANI contents.
Theoretical dedoped PANI content, wt% 5 10 20
Real content of the dedoped PANI, wt% 3.3 7.7 16.8
The dedoped PANI yield, % 66 77 84
PANI-DBSA contenta, wt% 8.7 18.9 36.1
Volume fraction of PANI-DBSA 0.24 0.44 0.65
Notationb NC9 NC19 NC36


2.4. Sensing layer preparations

The preparation protocol included a few steps. In particular, pure PANI-DBSA and its nanocomposites were dispersed in DCAA and CB. The obtained dispersions (10 mg ml−1) were homogenized in ultrasonic bath for 30 min followed by drop-casting deposition of 0.5 μl solution onto Au/fiberglass interdigitated electrodes array and dried under vacuum at 80 °C for 72 hours. The electrodes array was then placed inside the thermostabilized exposure chamber.27

2.5. Sensing measurements

Sensing properties of the synthesized materials were examined in the flow-type system described elsewhere 2. All the measurements were performed at 25 °C and constant relative humidity (RH = 50 ± 0.5%). The tested ammonia concentrations range was 5–100 ppm. The sensor response magnitude (SR) was calculated by equation SR = [(RR0)/R0] × 100%, where R is the sample resistance, R0 is the initial resistance value.

The time of the sensing materials interaction with ammonia was 5 min. The response rate was calculated as tangent (tgβ) of the slope (β) of initial linear part of the response trace. The recovery ability (RA) of the sensor was estimated as a difference between SR value at 5th min in NH3–air flow and SRair value measured at 10th min after NH3–air flow was replaced by pure air flow; i.e. RADCAA or CB = SR–SRair (indexDCAA or CB is used here to indicate effect of the solvent on the sensor layer recovery). The sensors resistance changes were continuously measured and recorded with a digital multimeter (Agilent 34970A) connected to computer. The in-chamber analyte concentration was generated by mixing ammonia from a standard gas cylinder (PRAXAIR Company) with purified air from a zero air generator (Whattman 76–804).

R0 was estimated as a mean resistance value measured in the flow of purified air during 5 minutes. Then, the samples were exposed to ammonia with simultaneous recording of their resistance changes. After 5 min of interaction with pollutant sensors was flushed with purified air.28

2.6. Characterization

The X-ray diffractometer DRON-3M with CuKα radiation (λ = 1.541 Å) was used for the materials morphology examinations. The additional data were obtained by transmission and scanning electron microscopy (TEM and SEM) on the JEOL JEM-1400 and HITACHI S-4300 SEM microscopes respectively. The pure PANI and its nanocomposites FTIR spectra were recorded with the help of Bruker Vertex 70 spectrometer at resolution of 1 cm−1.

The solubility of the polymer phase in the nanocomposites was tested on the NC19 sample by applying the same preparation protocol as for sensing measurements (Section 2.4.). In short, the fixed volumes of DCAA (10 ml) and CB (9.1 ml) were added to the weighed portions (ca. 10 mg) of NC19 placed at the bottom of two glass vials. The NC19 concentrations in obtained dispersions were 0.98 and 1.1 mg ml−1 respectively. These dispersions were ultrasonicated for 30 min. To avoid scattering effects, dispersed TiO2 nanoparticles were precipitated by centrifugation for 60 min at 5000 rpm and then removed from these dispersions prior to the measurements. The precipitation degree was checked by periodical UV-Vis spectra measurements.

Electrical conductivity of the as-synthesized nanocomposites and PANI-DBSA was estimated by the two-electrode scheme of measurements on their compressed pellets with the help of UNI-T UT70D digital multimeter. The pellets of dry powders tested materials with diameter d = 2.7 mm were pressed by applying a force F = 600 N. Their thicknesses were measured with a micrometer.

3. Results and discussion

3.1. Characterization of the as-synthesized TiO2/PANI-DBSA nanocomposites

Based on the known analytical technique (see ref. 17 and Section 2.3.), we determined real contents of dedoped PANI in the synthesized nanocomposites. In turn, these contents indicated that aniline polymerization in the presence of TiO2 nanoparticles proceeded quite effectively with high PANI yield (Table 1), which increased from 66% to 84% in the range of initial ratios of TiO2/aniline from 95/5 to 80[thin space (1/6-em)]:[thin space (1/6-em)]20 respectively.

The real contents of dedoped PANI were recalculated to the PANI-DBSA contents (Table 1) to use the latter for comparison of sensing and other properties of the synthesized TiO2/PANI-DBSA nanocomposites. For simplicity and clarity of this recalculation we postulated the complete PANI doping with only DBSA.

FTIR spectra of these nanocomposites demonstrate characteristic PANI-DBSA bands described recently by us on the example of the core–shell nanocomposite synthesized under conditions similar to that of NC19 (see ref. 12 and the literature cited in) and confirm the growth of PANI-DBSA loading in the nanocomposites when increasing aniline[thin space (1/6-em)]:[thin space (1/6-em)]TiO2 ratio (Fig. S1).

Unlike FTIR spectra, XRD patterns of the synthesized nanocomposites give only a weak evidence of the PANI-DBSA phase presence (Fig. 2). Thus, a small growth of the scattering in the patterns is observed in the range 2θ ∼ 12–35° where the main PANI-DBSA peaks are obviously localized. Indeed, the pure PANI-DBSA pattern contains both the visible peak near 25° and shoulders at ca. 17.4°, 29.1° assigned to the crystalline phase29,30 and the broad asymmetric scattering of the amorphous phase (Fig. 2 and S2).


image file: c6ra12693f-f2.tif
Fig. 2 XRD patterns of the synthesized nanocomposites with different PANI-DBSA contents.

In turn, the pure TiO2 and nanocomposites patterns exhibit practically the same diffraction peaks located at 2θ = 25.3, 37.9, 48, 54 and 55.1° corresponding to the (101), (004), (200), (105) and (211) anatase phase reflections. Despite the weak influence of the PANI-DBSA component on the nanocomposites patterns, the identity of their TiO2 reflexes with those of the pure TiO2 allow to separate the XRD pattern of the PANI-DBSA phase in the NC36 nanocomposite by the simple subtraction procedure (Fig. S3 and S4). This pattern demonstrates well-pronounced shoulders at ca. 15° (not revealed in the PANI-DBSA pattern), 17.4°, and 29° which obviously indicate crystallinity of the PANI-DBSA phase29,30 in the nanocomposite. However, it is difficult to compare crystallinities of the pure PANI-DBSA and its phase in the nanocomposite because of the large errors in the low-intensity difference pattern in the range from 23.4° to 27.6°. These errors and low intensity do not allow calculations of the degree of crystallinity of the PANI phase. Nevertheless, based on the earlier found enhanced crystallinity of the PANI phase in other composites17,18 and on the appearance of the shoulder at ca. 15° in the difference XRD pattern (Fig. S4b), one may expect that the polymer phase in the synthesized TiO2/PANI-DBSA nanocomposites also has an increased crystallinity.

The increase of PANI-DBSA contents in the synthesized nanocomposites results in changes of their conductivity, which allow considering these materials as a percolation-like system (Fig. 3). A similar behavior was observed earlier for TiO2/PANI nanocomposites synthesized in the aqueous medium under ultrasonic irradiation in the presence of HCl and sodium lauryl sulfate.31


image file: c6ra12693f-f3.tif
Fig. 3 Dependence of dc conductivity of the TiO2/PANI-DBSA nanocomposites (compressed pellets) on the volume fraction of PANI-DBSA. The volume fractions f of the polymer component were calculated using the densities 3.83 and 1.14 g cm−3 for TiO2 (anatase) and PANI-DBSA, respectively.32,33

This behavior is confirmed for the compressed pellets of the nanocomposites and can be roughly explained by formation of the PANI-DBSA percolation network in the porous matrix of TiO2 nanoparticles. Based on this consideration, we fitted the conductivity data with the scaling law of percolation theory:

 
σ = σ0(ffC)t (1)
where σ0 is the constant displaying conductivity of the PANI conducting phase, fC is the percolation threshold, and t is the critical exponent.

The best fit of the data (Fig. 3) yielded fC ∼ 0.19 and t ∼ 1.9. As one can see, despite the morphological specificity of the synthesized nanocomposites (see below Section 3.2.) these values match to the theoretically predicted values for a random lattice of spheres.34

3.2. Dispersing solvent effects in the nanocomposites morphology

A careful addition of DCAA into the bottle containing the powder of the pure PANI-DBSA or its nanocomposite is accompanied by practically instantaneous appearance of the green color in the solution bulk. In the case of using CB instead of DCAA the dissolution of the PANI-DBSA proceeds much slower because of less solubility in the former solvent. This effect is confirmed by much higher intensity of the bands typical of the doped PANI35 in the UV-Vis spectrum of the DCAA solution as compared with the CB case (Fig. 4).
image file: c6ra12693f-f4.tif
Fig. 4 UV-Vis spectra of the solutions in DCAA (1) and CB (2) over TiO2/PANI-DBSA (NC19) powder at the vial bottom.

The PANI-DBSA solubility data suggested not only changing morphology of the as-synthesized nanocomposites when the preparation of their dispersions but also a difference in their morphology dependently on the used solvent. This suggestion agrees with SEM images of the nanocomposites layers cast from their dispersions in DCAA and CB (Fig. 5).


image file: c6ra12693f-f5.tif
Fig. 5 SEM images of TiO2-PANI/DBSA nanocomposites with different PANI content dissolved in DCAA and CB.

In particular, SEM images display shapeless agglomerates with a sponge-like surface (Fig. 5 and S5), whose average sizes at the lowest PANI-DBSA content (8.7 wt%, NC9) are quite close after the both solvents although their polydispersity is higher in the case of using DCAA (Fig. 5a and e, the agglomerates sizes are in the range of 450–620 nm). At the increased PANI-DBSA content (18.9 wt%, NC19) the agglomerates still keep similar sizes (600–610 nm) (Fig. 5b and f) but in the case of using CB solvent there appeared places which look as if a part of the agglomerates is covered by an additional quite homogeneous layer (Fig. 5f). At the higher PANI-DBSA content (36.1 wt%, NC36) the situation is inverse to the NC9 case i.e. the agglomeration becomes more significant in case of the dispersing solvent CB (Fig. 5g). Moreover, this agglomeration is changed in comparison with the NC19 (Fig. 5f) i.e. the agglomerates are glued by PANI-DBSA, which partially washed out from the nanoparticles but left in their neighbourhood because of the worse solubility in CB as compared with the DCAA case. Indeed, in the latter case PANI-DBSA is better soluble and rapidly diffuses into the solvent bulk as we have shown above (Fig. 4). This PANI-DBSA ability kept the agglomerates of the NC36 nanoparticles disconnected while at their surface a separate structureless and shapeless phase appeared which looked as a dense polymer body (Fig. 5c). The appearance of this phase could be caused by the fact that PANI-DBSA dissolved from the nanoparticles in the good solvent DCAA and then precipitated after the DCAA evaporation. The quite dense morphology with a visually minimal porosity was formed also in the case of the pure PANI-DBSA layer cast from the DCAA solution (Fig. 5d). However, in case of CB one can see formation of macroporous morphology of the cast PANI-DBSA layer (Fig. 5h) facilitated probably by a fast evaporation of the solvent. These differences between the both pure PANI-DBSA layers, as well as the known influence of a solvent volatility (boiling point) on morphology and porosity of solution-born materials36–38 suggest that an additional input in the nanocomposites layers quality could be made by the speed of the solvent evaporation.

The morphological differences in the nanocomposites are confirmed by their TEM images (Fig. 6). In particular, the separate polymer phase (outlined with black lines in the image) is observed after dispersing NC36 in DCAA, while the aggregation of nanoparticles is higher in case of using CB (compare Fig. 5c and g with Fig. 6a and b).


image file: c6ra12693f-f6.tif
Fig. 6 TEM images of the TiO2/PANI-DBSA nanocomposite NC36 after dispersing in DCAA (a) and CB (b).

3.3. Sensing properties of the synthesized TiO2/PANI-DBSA nanocomposites

At first sight there is no apparent dependence of the sensing properties of the nanocomposites (cast from the both solvents) on PANI-DBSA content. However, the comparison of above-discussed data with differences in magnitudes and rates of the typical nanocomposites responses to ammonia (Fig. 7) suggests a significant influence of the sensing layers morphology on these responses. Thus, NC9 samples with the similar morphology after the both dispersing solvents (Fig. 5) and the lowest PANI-DBSA content (8.7 wt%) show nearly identical responses (see curves 1 in Fig. 7a and b) by magnitude (SR ∼ 300%), rate (the slope of the initial linear part of the response traces tgβ1 ≈ 74–75%/min) and recovery ability (RADCAA ∼ 154% while RACB ∼ 158%). In view of the demonstrated above partial solubility of PANI-DBSA phase of the nanocomposite (Fig. 4) this independence of the sensing behavior on the solvent is unexpected.
image file: c6ra12693f-f7.tif
Fig. 7 The influence of the PANI-DBSA content and solvents DCAA (a) and CB (b) on typical sensing responses of the synthesized TiO2/PANI-DBSA nanocomposites to ammonia at 100 ppm NH3. Content of PANI-DBSA: 1–8.7 wt%, NC9; 2–18.9 wt%, NC19; 3–36.1 wt%, NC36; 4–100 wt%, the pure polymer.

Probably, it can be understood on the basis of the recently found fact that at low contents PANI is localized in the thin shell at surface of the bearing matrix particles.17,18 This PANI differs from the bulk one by crystallinity, molecular weight, oxidation degree etc. that can probably decrease its solubility. Therefore, the morphological similarity of NC9 samples after the both solvents can at least partially explain the similar sensing behavior after the both solvents.

The increase of the PANI-DBSA content (18.9 wt%) dramatically raised the magnitude (SR ∼ 470%) and rate (tgβ2 ≈ 181%/min) of the response of the NC19 sample cast from the CB dispersion, while the sharp drop of these parameters (SR ∼ 150% and tgβ2 ≈ 50%/min, respectively) in the case of DCAA is observed (curves 2 in Fig. 7a and b). However, although it was suggested earlier that the higher the sensitivity of PANI nanostructures, the slower are their regeneration processes,39 the estimated recovery ability (can be probably considered here as parameter being symbate to regeneration rate) of the response of the NC19 sample in the CB case strongly grew (RACB ∼ 327%). But in the case of the DCAA born NC19 sample layer this suggestion is confirmed i.e. decreased sensitivity accompanied with lower recovery ability (RADCAA ∼ 91%). Based on the demonstrated different solubility of the PANI-DBSA phase of NC19 in these solvents (Fig. 4), on the morphology of the formed NC19 layers (Fig. 5 and S5) and on the core–shell structure of the nanocomposite nanoparticles12 one can explain the found sensing specificity through both the redistribution of the polymer phase on the surface of the nanocomposite particles and/or its dissolution/loss. Specifically, as discussed above (Section 3.2.) this redistribution caused the formation of the additional thin nanostructured sponge-like PANI-DBSA phase at the NC19 sample surface (Fig. 5f). In turn, this morphology facilitates an access of the analyte molecules into the sensing layer bulk and therefore enhances both the sensing response and recovery ability/regeneration rate (Fig. 7b, curve 2). In the case of DCAA solvent the PANI-DBSA phase of NC19 is dissolved in more extent than in CB. Therefore, this dissolution phenomenon leads to some PANI-DBSA losses, which are more significant than in the CB case (Fig. 4). As a consequence, the quantity of the sensing PANI-DBSA phase in the NC19 layer decreases, that in turn results in dropping the response magnitude, rate and recovery ability/regeneration rate (Fig. 7a, curve 2). This tendency in DCAA is kept for the NC36 nanocomposite with the higher PANI-DBSA content (Fig. 7a, curve 3) probably not only due to a simple transition of the PANI-DBSA into the solution bulk but also because of oversaturation of the PANI-DBSA concentration and its precipitation as the separate monolith polymer phase at a surface of the sensing layer (Section 3.2., Fig. 5c and 6a). Naturally, the low sensing properties of the pure PANI-DBSA layer cast from DCAA cannot be explained by the same reasons. However, the dense morphology of this layer (Fig. 5d) formed as a result of the slow DCAA evaporation (under conditions of preparation) can be probably considered as a possible reason or as one of the possible reasons of its poor sensing properties. Nevertheless, for better understanding of this phenomenon the independent study is needed.

It should be emphasized here that although the NC36 nanocomposite after dispersing in CB also demonstrates decrease and deceleration (to SR ∼ 198% and tgβ3 ≈ 118%/min) of the response to ammonia and regeneration (RACB ∼ 142%) as compared with NC19 (Fig. 7b, curves 2 & 3), it still has the much better sensing performance than its counterpart cast from DCAA (SR ∼ 91%, tgβ3 ≈ 38%/min and RADCAA ∼ 53%) (compare curves 3 in Fig. 7a and b). This difference is probably possible due to keeping core–shell morphology of the NC36 nanoparticles working better than the bulk heterojunction one.18 At the same time, the reason of the deterioration of the sensing properties when increase of the PANI-DBSA content from NC19 to NC36 in the case of dispersing solvent CB can be explained by formation of the more agglomerated and less porous morphology which additionally coated/blocked with the thick layer of the precipitated PANI-DBSA (Fig. 5g). This explanation agrees with the higher response magnitude of the macroporous pure PANI-DBSA layer cast from CB (Fig. 5h and 7b) while the rate of this response is significantly lower than in the case of NC36 probably because of less microporosity compare enlarged images of these samples (Fig. S5) and, therefore, because of a hindered access of the ammonia molecules to the sensing clusters in the layer bulk.

All the nanocomposite layers cast from the both solvents demonstrate linear sensor responses (calibration curves) to the ammonia in the concentration range of 5–100 ppm (Fig. 8) that suggests their applicability as sensing materials independently on the preparation conditions.


image file: c6ra12693f-f8.tif
Fig. 8 The sensors responses of the synthesized (curves 1–3) and mixed (curves 4) nanocomposites layers with different contents of PANI-DBSA cast from CB (a) and DCAA (b): 1 – NC9 (8.7 wt%); 2 – NC19 (18.9 wt%); 3 – NC36 (36.1 wt%); 4 – mechanically mixed nanocomposite of PANI-DBSA (10 wt%) with TiO2 nanoparticles.

The slopes of the calibration curves (sensitivity) of the tested samples confirm the above-discussed higher sensitivity of the sample layers cast from CB dispersions and the influence of PANI-DBSA loading (Fig. 8). In particular, the CB-born NC19 sample with the intermediate PANI-DBSA content and conductivity (Table 1, Fig. 3) has the highest sensitivity (ca. 4.7%/ppm) and can be considered as the best candidate among the investigated materials for ammonia sensing.

In this regard, the question concerning an advantage of the chemical synthesis of the nanocomposites over their preparation through a simple mechanical mixing of PANI-DBSA and TiO2 is of particular interest for the sensing applications. To clarify this point we prepared the mixed PANI-DBSA (10 wt%) nanocomposite with TiO2 and compared sensing responses to ammonia of its layers cast from DCAA and CB with those of the synthesized nanocomposites. As one can see from Fig. 8a all the synthesized nanocomposites layers cast from CB give the responses (curves 1–3) to gaseous ammonia with magnitude and sensitivity which are higher (especially in the case of NC9 and NC19) than those of its mechanically mixed analog (curve 4). This fact suggests a much better accessibility of the PANI-DBSA sensing clusters, which are more uniformly distributed in thin shells/layers on the TiO2 nanoparticles surface than in the case of the mechanical mixture analog. Indeed, because of the poor solubility of PANI-DBSA in CB, the mixed analog obviously consists of TiO2 nanoparticles (major component) randomly intermixed with the PANI-DBSA ones. The latter have mainly rigid point electrical junctions that cause a high resistance of their percolation network and, therefore, can suppress the sensor responses. Moreover, while the PANI-DBSA particle surface easily interact with ammonia molecules, their access to most of the sensing clusters localized in the particle bulk has diffusion limitations which cause the sensor response decreased as compared with NC19 sample.

Interestingly that the DCAA-born nanocomposite layers demonstrate a strongly different behavior for the CB-born samples (Fig. 8b). In particular, the mechanically mixed nanocomposite layer with 10 wt% of PANI-DBSA shows better responses (curve 4) than NC19 and NC36 (curves 2 and 3) with much higher contents of PANI-DBSA but still worse than those of the NC9 one with the less content of PANI-DBSA (Fig. 8b, curve 1). Based on the above discussed dependence of morphology and sensing properties of the nanocomposites on solubility of PANI-DBSA phase in the dispersing solvent, one can suggest that the slightly better sensing properties of the mixed nanocomposite layer cast from DCAA as compared with the NC19 and NC36 ones are the result of partial solubility of the PANI-DBSA component in this solvent followed by its precipitation as a thin layer on the bare TiO2 nanoparticles after DCAA evaporation. This new morphology can allow better accessibility of all sensing clusters inside the bulk of the PANI-DBSA phase due to its small thickness.

4. Conclusion

The important issues of the doped PANI content and dispersing solvents have been considered in terms of relationship of solubility of the PANI component, morphology and sensing properties of the TiO2/PANI-DBSA hybrid nanocomposites. Different contents of PANI-DBSA in these nanocomposites were roughly pre-set by the chemical polymerization of aniline in the presence of titania nanoparticles with initial weight ratios TiO2/aniline in the reaction mixture: 95/5, 90/10 and 80/20 in the presence of solubilizing acid-dopant DBSA. To characterize the operating properties of the nanocomposites we used real contents of the PANI-DBSA component/phase determined through the PANI polymerization yield.

The nanocomposites layers were cast on the interdigitated electrodes from two dispersing solvents CB and DCAA which were shown to be strongly different by their ability to dissolve PANI-DBSA. This feature of the solvents in combination with their boiling temperature and PANI-DBSA content strongly affected morphology and sensing properties of the nanocomposites cast layers. In particular, at the lowest PANI-DBSA content (8.7 wt%) their surface morphology and sensing responses to ammonia were quite similar after the both solvents. At the increased PANI-DBSA content (18.9 wt%) the magnitude, rate of the sensing response and recovery ability dramatically raised in the case of the sample cast from the CB dispersion but sharply dropped in the case the sample after using DCAA. However at the highest PANI-DBSA content (36.1 wt%) the sensing responses of the nanocomposite dropped in the case of the both solvents. We assign these differences to various abilities of the solvents to dissolve PANI-DBSA that resulted in the redistribution of the polymer phase on the surface of nanocomposite particles (CB case) and/or the polymer dissolution/loss (CB and DCAA cases). On the other hand the high boiling temperature of DCAA should have an additional effect on density, porosity and, therefore, sensitivity of the cast nanocomposite layers.

Based on the different ability of the both solvents to dissolve PANI-DBSA we have demonstrated the advantage for sensing applications of the chemically synthesized nanocomposites over their analog, which was mechanically mixed of PANI-DBSA (10 wt%) with TiO2.

We believe also that the results of this study are not limited only to the above considered case and should be taken into account when preparation of nanoparticles of different nature/morphology suitable for sensor, ecological and biomedical applications in various smart devices.40–43

Acknowledgements

Sergei Mikhaylov acknowledges the Mines Douai and University of Lille 1 for PhD scholarship and Armines for the partial financial support. This work is partially supported also by the project “The formation, properties and interactions of nanocomposites of conducting polymers and bioactive compounds in heterophase systems” of the program of fundamental research and by the complex scientific-technical program “Sensing devices for medical – ecological and industrial – technological problems: metrology support and trial operation” of National Academy of Sciences of Ukraine.

References

  1. H. Bai and G. Shi, Sensors, 2007, 7, 267–307 Search PubMed.
  2. J. L. Wojkiewicz, V. N. Bliznyuk, S. Carquigny, N. Elkamchi, N. Redon, T. Lasri, A. A. Pud and S. Reynaud, Sens. Actuators, B, 2011, 160, 1394–1403 Search PubMed.
  3. A. Pud, N. Ogurtsov, A. Korzhenko and G. Shapoval, Prog. Polym. Sci., 2003, 28, 1701–1753 Search PubMed.
  4. I. Izzuddin, N. Ramli, M. M. Salleh, M. Yahaya and M. H. Jumali, in IEEE International Conference on Semiconductor Electronics, Proceedings, ICSE, 2008, pp. 336–339, 4770336,  DOI:10.1109/SMELEC.2008.4770336.
  5. G. D. Khuspe, S. T. Navale, M. A. Chougule and V. B. Patil, Synth. Met., 2013, 185–186, 1–8 Search PubMed.
  6. V. Talwar, O. Singh and R. C. Singh, Sens. Actuators, B, 2014, 191, 276–282 Search PubMed.
  7. S. L. Patil, M. A. Chougule, S. Sen and V. B. Patil, Measurement, 2012, 45, 243–249 Search PubMed.
  8. D. Nicolas-Debarnot and F. Poncin-Epaillard, Anal. Chim. Acta, 2003, 475, 1–15 Search PubMed.
  9. G. Jian, L. Yinhua, H. Zeshan, Z. Zhengzhi and D. Yulin, J. Phys. Chem. C, 2010, 114, 9970–9974 Search PubMed.
  10. R. Boddula and P. Srinivasan, J. Appl. Polym. Sci., 2015, 132, 42510 Search PubMed.
  11. M. G. Han, S. K. Cho, S. G. Oh and S. S. Im, Synth. Met., 2002, 126, 53–60 Search PubMed.
  12. S. Mikhaylov, N. Ogurtsov, Y. Noskov, N. Redon, P. Coddeville, J. L. Wojkiewicz and A. Pud, RSC Adv., 2015, 5, 20218–20226 Search PubMed.
  13. H. Tai, Y. Jiang, G. Xie and J. Yu, J. Mater. Sci. Technol., 2010, 26, 605–613 Search PubMed.
  14. G. D. Khuspe, S. T. Navale, D. K. Bandgar, R. D. Sakhare, M. A. Chougule and V. B. Patil, Electron. Mater. Lett., 2014, 10, 191–197 CrossRef CAS.
  15. Y. Yu, B. Che, Z. Si, L. Li, W. Chen and G. Xue, Synth. Met., 2005, 150, 271–277 CrossRef CAS.
  16. A. Z. Sadek, W. Wlodarski, K. Shin, R. B. Kaner and K. Kalantar-zadeh, Nanotechnology, 2006, 17, 4488 CrossRef CAS.
  17. N. A. Ogurtsov, Y. V. Noskov, K. Y. Fatyeyeva, V. G. Ilyin, G. V. Dudarenko and A. A. Pud, J. Phys. Chem. B, 2013, 117, 5306–5314 CrossRef CAS PubMed.
  18. N. A. Ogurtsov, Y. V. Noskov, V. N. Bliznyuk, V. G. Ilyin, J.-L. Wojkiewicz, E. A. Fedorenko and A. A. Pud, J. Phys. Chem. C, 2016, 120, 230–242 CAS.
  19. S. G. Pawar, M. A. Chougule, S. L. Patil, B. T. Raut, P. R. Godse, S. Sen and V. B. Patil, IEEE Sens. J., 2011, 11, 3417–3423 CrossRef CAS.
  20. D. N. Huyen, N. T. Tung, N. D. Thien and L. H. Thanh, Sensors, 2011, 11, 1924–1931 CrossRef CAS PubMed.
  21. Y. Cao, P. Smith and A. J. Heeger, Synth. Met., 1992, 48, 91–97 CrossRef CAS.
  22. Y. Cao, G. M. Treacy, P. Smith and A. J. Heeger, Appl. Phys. Lett., 1992, 60, 2711–2713 CrossRef CAS.
  23. A. Beena Unni, G. Vignaud, J. K. Bal, N. Delorme, T. Beuvier, S. Thomas, Y. Grohens and A. Gibaud, Macromolecules, 2016, 49, 1807–1815 CrossRef CAS.
  24. M. Trznadel and P. Rannou, Synth. Met., 1999, 101, 842 CrossRef CAS.
  25. O. T. Ikkala, L. O. Pietilä, L. Ahjopalo, H. Österholm and P. J. Passiniemi, J. Chem. Phys., 1995, 103, 9855–9863 CrossRef CAS.
  26. T. E. Olinga, J. Fraysse, J. P. Travers, A. Dufresne and A. Pron, Macromolecules, 2000, 33, 2107–2113 CrossRef CAS.
  27. T. Mérian, N. Redon, Z. Zujovic, D. Stanisavljev, J. L. Wojkiewicz and M. Gizdavic-Nikolaidis, Sens. Actuators, B, 2014, 203, 626–634 CrossRef.
  28. M. Joubert, M. Bouhadid, D. Bégué, P. Iratçabal, N. Redon, J. Desbrières and S. Reynaud, Polymer, 2010, 51, 1716–1722 CrossRef CAS.
  29. N. V. Blinova, J. Stejskal, M. Trchová, J. Prokeš and M. Omastová, Eur. Polym. J., 2007, 43, 2331–2341 CrossRef CAS.
  30. J. P. Pouget, M. E. Jozefowicz, A. J. Epstein, X. Tang and A. G. MacDiarmid, Macromolecules, 1991, 24, 779–789 CrossRef CAS.
  31. H. Xia and Q. Wang, Chem. Mater., 2002, 14, 2158–2165 CrossRef CAS.
  32. L. Liu and X. Chen, Chem. Rev., 2014, 114, 9890–9918 CrossRef CAS PubMed.
  33. C. Y. Yang, P. Smith, A. J. Heeger, Y. Cao and J. E. Osterholm, Polymer, 1994, 35, 1142–1147 CrossRef CAS.
  34. L. W. Shacklette, C. C. Han and M. H. Luly, Synth. Met., 1993, 57, 3532–3537 CrossRef CAS.
  35. A. G. MacDiarmid and A. J. Epstein, Synth. Met., 1994, 65, 103–116 CrossRef CAS.
  36. P. Lu and Y. Xia, Langmuir, 2013, 29, 7070–7078 CrossRef CAS PubMed.
  37. S. Megelski, J. S. Stephens, D. B. Chase and J. F. Rabolt, Macromolecules, 2002, 35, 8456–8466 CrossRef CAS.
  38. E. Llorens, E. Armelin, M. del Mar Pérez-Madrigal, L. J. Del Valle, C. Alemán and J. Puiggalí, Polymers, 2013, 5, 1115–1157 CrossRef.
  39. H. Kebiche, D. Debarnot, A. Merzouki, F. Poncin-Epaillard and N. Haddaoui, Anal. Chim. Acta, 2012, 737, 64–71 CrossRef CAS PubMed.
  40. T. Sen, N. G. Shimpi and S. Mishra, RSC Adv., 2016, 6, 42196–42222 RSC.
  41. W. Sun, S. Guo, C. Hu, J. Fan and X. Peng, Chem. Rev., 2016, 116, 7768–7817 CrossRef CAS PubMed.
  42. C. Fu, C. He, L. Tan, S. Wang, L. Shang, L. Li, X. Meng and H. Liu, Sci. Bull., 2016, 61, 282–291 CrossRef CAS.
  43. F. Li, Y. Bao, D. Wang, W. Wang and L. Niu, Sci. Bull., 2016, 61, 190–201 CrossRef.

Footnotes

Electronic supplementary information (ESI) available. See DOI: 10.1039/c6ra12693f
Although this postulate is convenient for the recalculations, the recalculated values are quite rough estimations as the synthesized doped PANI component can contain an impurity of hydrogen sulfate counter-ions in addition to the dominant dopant DBSA.29

This journal is © The Royal Society of Chemistry 2016