DOI:
10.1039/C6RA12567K
(Paper)
RSC Adv., 2016,
6, 75766-75776
A first-principle study of the effect of OH− doping on the elastic constants and electronic structure of HTB-FeF3
Received
14th May 2016
, Accepted 22nd July 2016
First published on 25th July 2016
Abstract
FeF3 with a hexagonal-tungsten-bronze structure (HTB-FeF3) belongs to one type of promising cathode material for Li-ion batteries. However, poor conductivity has hindered its use for further practice. Moreover, its fundamental information, such as its geometrical structure, elastic properties and electronic structure, can rarely be found. In this study, first-principles calculations were implemented to perform a systematic investigation about the effect of OH− doping on orthorhombic HTB-FeF3. First, the single crystal elastic constants of HTB-FeF3−x(OH)x (x = 0, 0.083, 0.167, 0.333, 0.667, 0.833) were successfully obtained from the energy-strain curve calculations. The bulk and Young's modulus, as well as the Poisson's ratio for ideal polycrystalline HTB-FeF3−x(OH)x were calculated. The directionally dependent Young's modulus of HTB-FeF2.167(OH)0.833 and HTB-FeF3 was also further calculated to analyze their elastic anisotropy. These results show that the partial substitution of OH− for F− ions can improve the elastic property of HTB-FeF3. Moreover, HTB-FeF3−x(OH)x can be classified as a ductile material. Furthermore, the ductility of polycrystalline HTB-FeF3−x(OH)x can be enhanced with increasing OH− doping concentrations. In order to clarify the mechanism of OH− doping on the orthorhombic HTB-FeF3, the crystal structure and chemical bonding properties of the orthorhombic FeF2.167(OH)0.833 and HTB-FeF3 crystals were further investigated. The calculated results indicate that strong O–H⋯F hydrogen bonds play a crucial role on the strengthening effect in HTB-FeF2.167(OH)0.833. Moreover, OH− doping can improve the electronic conductivity of HTB-FeF3.
1. Introduction
In recent years, a kind of new electrode material, such as transition metal fluorides,1–5 have aroused great attention due to their high energy density, guaranteed safety, long cycle life and low cost. Unlike typical lithiated transition metal oxides (LiMnO2, LiCoO2 and LiNiO2) with the intercalation/de-intercalation behavior of Li-ion, lots of transition metal fluorides usually have two consecutive reactions with Li ions during charge and discharge. In the discharging process, the first reaction corresponds to the lithium insertion into the framework of transition metal fluorides. And the conversion reaction occurs after the insertion of lithium. Therefore, more Li ions can be transferred and multiple oxidation states of the redox metal atom are fully used during charge and discharge, which contributes to high theoretical capacity of transition metal fluorides. On the other hand, transition metal fluorides also exhibit high voltages due to the ionic nature of the M–F bond. Among various metal fluorides, FeF3·0.33H2O with a hexagonal-tungsten-bronze structure (HTB-FeF3·0.33H2O) has become one of the most promising cathode materials because of its high capacity values and lower cost. HTB-FeF3·0.33H2O has a unique one dimensional tunnel. Such an open framework can increase the Li+ storage capacity and enhance the Li+ transport kinetics compared with ReO3-type FeF3. Besides, H2O molecules are located at the channel of HTB-FeF3·0.33H2O, which can stabilize the one dimensional tunnel of HTB-FeF3·0.33H2O by forming hydrogen bonds between H2O molecules and their adjacent F atoms. HTB-FeF3·0.33H2O has been synthesized successfully by different methods. For example C. L. Li6 prepared HTB-FeF3·0.33H2O via a novel top-down approach. C. Chen7 obtained HTB-FeF3·0.33H2O by a precipitation reaction from ethanol solution. B. J. Li8 fabricated a self-supported, binder-free 3D hierarchical HTB-FeF3·0.33H2O flower-like array by a solvothermal approach. Unfortunately, HTB-FeF3·0.33H2O still suffers from sluggish kinetics during the charge/discharge process, which hinders its practical application in Li-ion batteries. In order to solve this problem, researchers have mainly focused on the preparation of nano-composite materials such as SWNT/HTB-FeF3·0.33H2O,9 HTB-FeF3·0.33H2O/C,10 HTB-FeF3·0.33H2O/OMC11 and HTB-FeF3·0.33H2O/RGO.12 Although significant improvements have been achieved, the obtained electrochemical performances are still far from satisfying. Besides, the addition of conductive additives reduces the specific capacity of HTB-FeF3·0.33H2O in some way. Thus, it is still a big challenge to further significantly enhance the electrochemical performances of HTB-FeF3·0.33H2O. From analysis of the crystal structure of HTB-FeF3·0.33H2O, it is found that water molecules can stabilize the crystal structure by hydrogen bonding between isolated H2O and F ions.13 On the other band, water molecules can also block the tunnels for Li-ion diffusion. During the Li+ intercalation process, HTB-FeF3 can accommodate 0.92 Li+ per formula unit, which is much larger than the maximum of 0.66 Li+ per formula unit for FeF3·0.33H2O. However, HTB-FeF3 still suffers from poor cycle performance due to the loss of the role of water in tuning the structural stability.14
In order to improve the cyclic stability of HTB-FeF3, HTB-FeF3−x(OH)x (0 ≤ x ≤ 0.8) is obtained successfully by the decomposition of FeF3·3H2O.15,16 HTB-FeF3−x(OH)x·0.33H2O can be fabricated by a method of microwave-assisted synthesis. And HTB-FeF2.2(OH)0.8·0.33H2O was determined by analysis with XRD. Dehydroxylation reaction was further carried out on HTB-FeF2.2(OH)0.8·0.33H2O and the whole thermal behavior of this hydroxyfluoride can be expressed as follows:
| |
 | (1) |
According to above reaction, it is obvious that a water molecule can be lost at about 220 °C. Furthermore, HTB-FeF2.2(OH)0.8 has better electrochemical properties than HTB-FeF2.2(OH)0.8·0.33H2O. Pristine HTB-FeF2.2(OH)0.8·0.33H2O can accommodate 0.5 Li+ for the first discharge. On the other hand, the removal of a water molecule greatly enhanced the discharged capacity up to 167 mA h g−1 (corresponding to 0.7 Li+) in HTB-FeF2.2(OH)0.8. Although HTB-FeF2.2(OH)0.8 can be successfully fabricated experimentally, the doping mechanism of OH− is still not clear in HTB-FeF3−x(OH)x so far. Since the cycle performance and reversible capacity of a battery has a close relationship with the stability of crystal structure of materials, it is important to investigate the elastic properties of HTB-FeF3−x(OH)x, which will help us to understand the effect of OH− doping on the mechanical property of HTB-FeF3. Herein, first-principles calculations were implemented to investigate the OH− doping mechanism and OH groups/F substitution on the effect of elastic constants of HTB-FeF3. Furthermore, the structural features, electronic structure and chemical bonding properties of FeF3−x(OH)x were thoroughly investigated. It was expected that our theoretical calculations would provide important guidance for experiments.
2. Computational details
All calculations were carried out with the density functional theory method using the VASP code17,18 to explore the structural, elastic and electronic properties of pure HTB-FeF3 and HTB-FeF3−x(OH)x. The projector augmented wave (PAW) method18 was used. The Monkhorst–Pack scheme, with 4 × 2 × 4 k points and kinetic energy cut-off of 520 eV, was implemented to obtain accurate calculations. The electronic states of 3p63d64s2, 2s22p5, 1s1 and 2s22p4 were considered as the valence states for Fe, F, H and O, respectively. GGA+U method was employed to accurately correct the strong on-site coulombic repulsion of Fe 3d states. Values of U = 6.0 eV (ref. 19) and J = 1.0 eV (ref. 19) were set. Within the framework of DFT, optB88-vdW calculations were employed20,21 to correctly describe H-bonding and van der Waals interactions due to presence of OH− group in the HTB-FeF3−x(OH)x systems. Besides, spin-polarized calculations were performed during all calculations. In the iron fluoride system, antiferromagnetic coupling between Fe ions is considered.
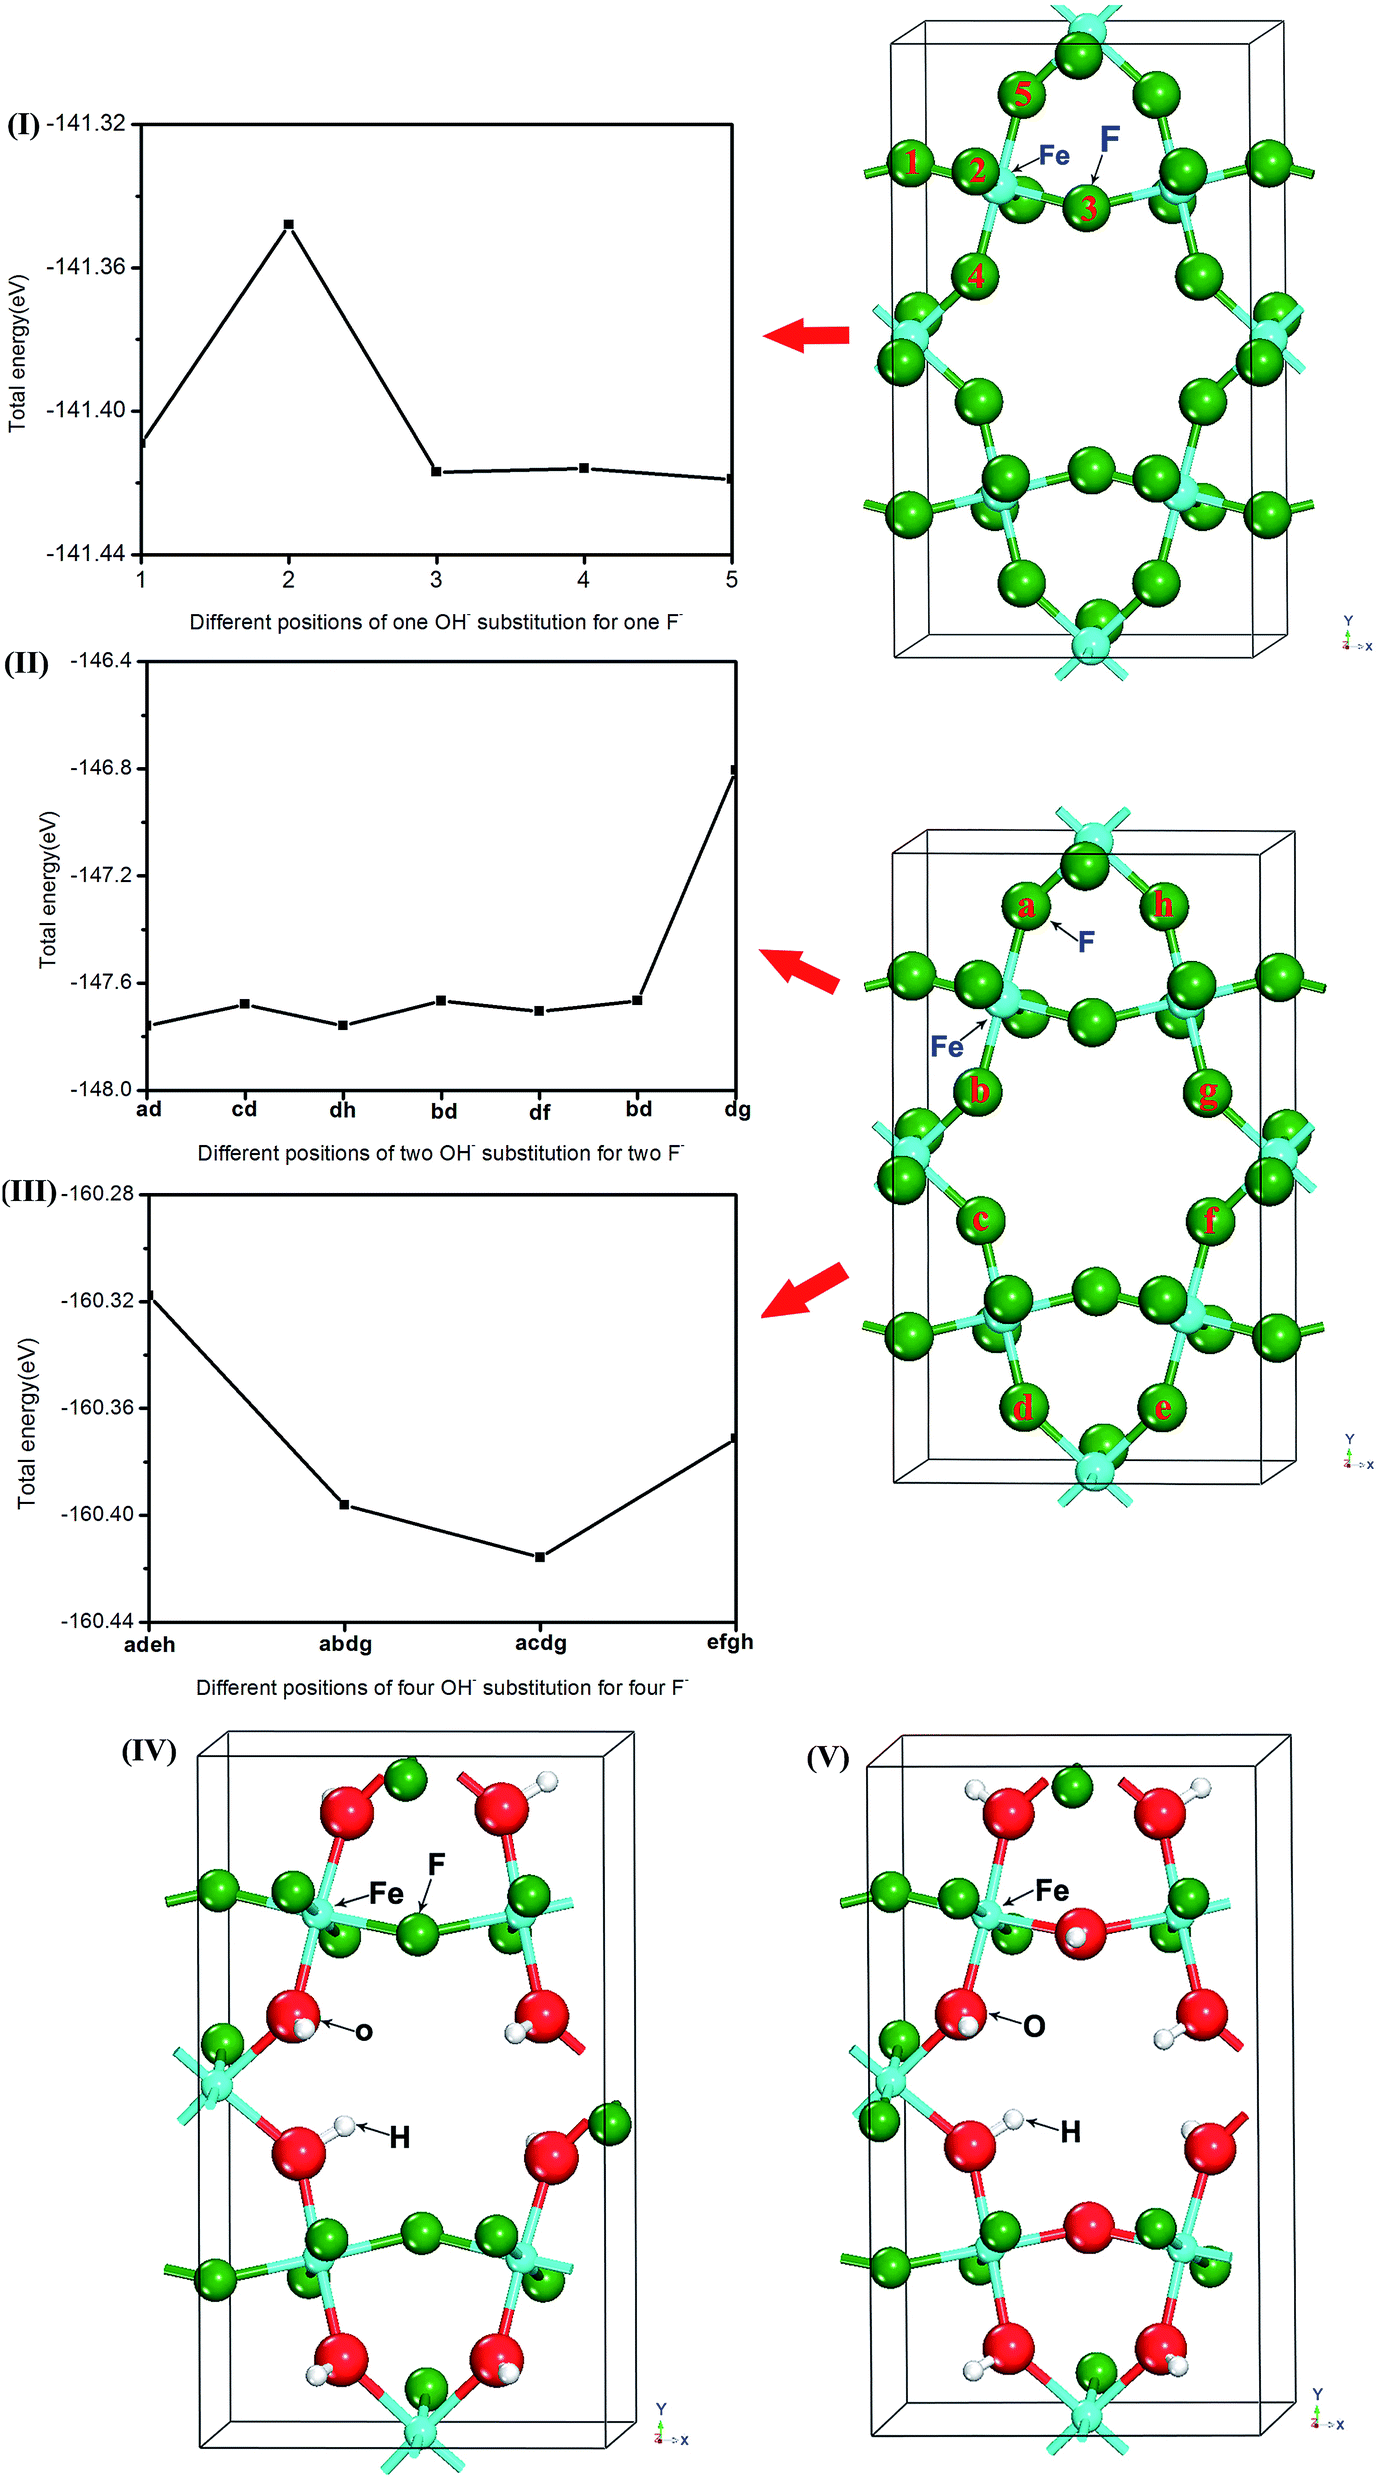
In order to investigate OH− doping concentration on the effect of HTB-FeF3, the different crystal models of OH−-doped HTB-FeF3, as shown in Fig. 1, were built by adopting the 48-atoms supercells with 1, 2, 4, 8 and 10 F− ions replaced by 1, 2, 4, 8 and 10 OH− groups, respectively. HTB-Fe12F35OH, HTB-Fe12F34(OH)2, HTB-Fe12F32(OH)4, HTB-Fe12F28(OH)8 and HTB-Fe12F26(OH)10 supercells were taken as the structural models for HTB-FeF2.917(OH)0.083, HTB-FeF2.833(OH)0.167, HTB-FeF2.667(OH)0.333, HTB-FeF2.333(OH)0.667 and HTB-FeF2.167(OH)0.833, respectively.
 |
| | Fig. 1 The structural model of HTB-FeF3−x(OH)x. The different Fe and F positions are labeled and only one layer of atoms along the z-axis is shown in order to facilitate visualization. | |
3. Results and discussion
3.1 Geometrical structures and formation enthalpies of OH−-doped HTB-FeF3
The structure of pure HTB-FeF3 was fully relaxed and the optimized lattice constants were a = 7.436 Å, b = 12.773 Å, c = 7.528 Å, respectively.
First, a single OH− group replacing the F sites in the crystal of HTB-FeF3 was investigated. As shown in Fig. 1(I), the five different anion positions in the HTB-FeF3 were considered and they were labeled as 1, 2, 3, 4 and 5, respectively, and the corresponding total energies were all calculated. It was found that OH− substitution for F− located at site 5 had the lowest energy, which indicates that this case is the most favorable in all different F sites of HTB-FeF2.917(OH)0.083.
Subsequently, replacing two F sites with two OH− groups (HTB-FeF2.833(OH)0.167) was investigated (Fig. 1(II)). The seven kinds of configurations of HTB-FeF2.833(OH)0.167 were taken into consideration and the corresponding structural models were labeled ab, cd, dh, bd, df, bd and dg, respectively. The calculated total energies revealed that the configuration of ab had the most stable structure.
For the four OH− groups-doped HTB-FeF3 system (HTB-FeF2.667(OH)0.333), four kinds of configurations, labelled adeh, abdg, acdg and efgh, were considered and the most stable structure of acdg was obtained in the same way (Fig. 1(III)).
Based on above discussion, the relaxed structures of both HTB-FeF2.333(OH)0.667 and HTB-FeF2.167(OH)0.833 were also obtained. They are depicted in Fig. 1(IV) and (V), respectively.
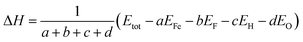
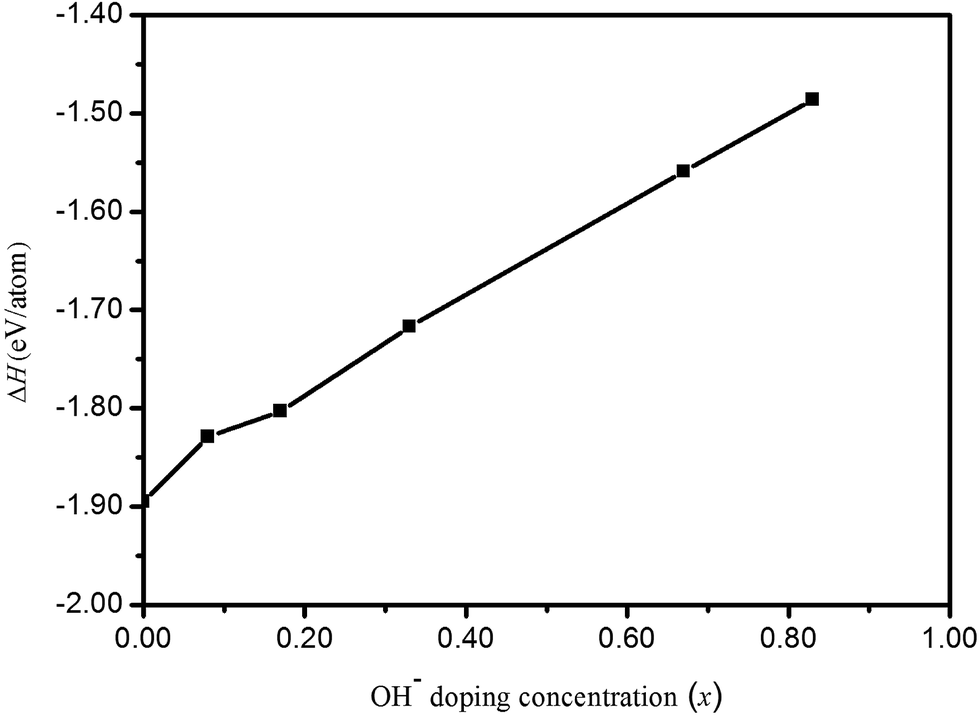
In order to investigate the effect of OH− doping on the relative phase stabilities of HTB-FeF3, the formation enthalpy per atom (ΔH) for HTB-FeF3−x(OH)x was calculated by the following equation:22,23
| |
 | (2) |
where
Etot is the total energy of HTB-FeF
3−x(OH)
x,
EFe is the total energy of one Fe atom in the bulk state,
EF,
EH and
EO are the total energy of one F atom, one H atom and one O atom in the gas state, respectively.
a,
b,
c and
d represent the number of Fe, F, H and O atoms, respectively. Negative formation enthalpy usually suggests an exothermic process. The lower the formation enthalpy, the more stable the phase structure. The calculated formation enthalpies of HTB-FeF
3−x(OH)
x as a function of the OH
− content are presented in
Fig. 2. From
Fig. 2, although formation enthalpies of HTB-FeF
3−x(OH)
x increase with increasing OH
− doping concentration, these values are all negative and correspond to exothermic processes. These phases can stably exist under usual growth conditions.
 |
| | Fig. 2 Formation enthalpies (ΔH) of HTB-FeF3−x(OH)x as a function of OH− doping concentration (x). | |
3.2 Elastic properties
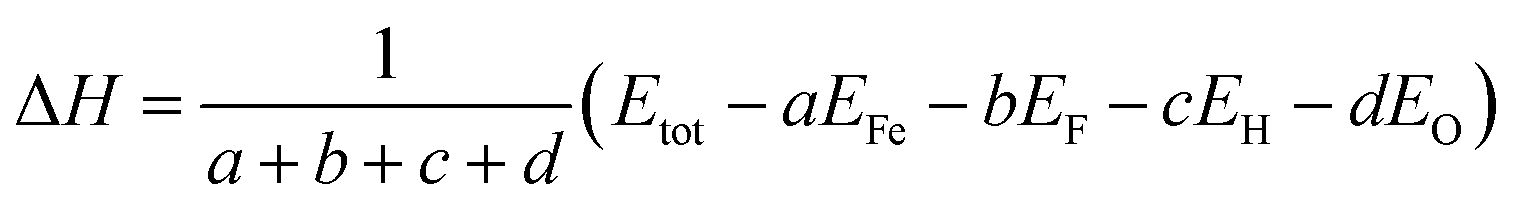
An efficient energy-strain approach at the optimized structure was used to calculate elastic stiffness to understand the mechanical properties of HTB-FeF3−x(OH)x. Firstly, stress δij, strain εkl and elastic constants cijkl have relationships as defined by the following equations:24| |
 | (3) |
| |
 | (4) |
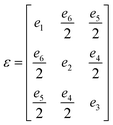
Voigt's notation is presented in eqn (4). The strain tensor in the matrix form can be written as:
| |
 | (5) |
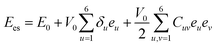
and the elastic strain energy (
Ees) can be given by
eqn (6):
24| |
 | (6) |
where
E0 is the total energy of the theoretical equilibrium structure when pressure is zero.
V0 is the crystal volume of the original cell. Next, Δ
E is the energy difference and is further calculated according to following equations:
25| |
 | (7) |
| | |
ΔE = Ees(V0,δ) − Ees(V0,0)
| (8) |
In this work, eleven different sets of  were calculated as a function of strains δ from −0.05 to 0.05 in steps of 0.01. Therefore, the elastic constant could be obtained by fitting these data points vs. a parabola. As we know, the orthorhombic system has nine independent elastic constants: C11, C12, C13, C22, C23, C33, C44, C55 and C66. The criterion for mechanical stability of orthorhombic crystal structures can be given by:
| | |
C11 > 0, C22 > 0, C33 > 0, C44 > 0, C55 > 0, C66 > 0
| (9) |
| | |
[C11 + C22 + C33 + 2(C12 + C13 + C23)] > 0
| (10) |
| | |
(C11 + C22 − 2C12) > 0, (C11 + C33 − 2C13)] > 0
| (11) |
| | |
(C22 + C33 − 2C23) > 0
| (12) |
Table 1 summarizes the calculated elastic constants Cij of these HTB-FeF3−x(OH)x. Obviously, the elastic constants of HTB-FeF3−x(OH)x were observed to satisfy the mechanical stability criteria, indicating that the structures were mechanically stable. For the orthorhombic system, the elastic constants C11, C11 and C33 are usually more important than the other independent elastic constants because they are related to the deformation behavior and atomic bonding characteristics of the materials.26 It is noted from Table 1 that the C11, C11 and C33 for all HTB-FeF3−x(OH)x are much larger than the other elastic constants, suggesting that all HTB-FeF3−x(OH)x are incompressible under uniaxial stress along x, y or z axes. Besides, C11 is greater than C33 when the OH− doping concentration (x) is located between 0 {100} and 0.167. C11 is smaller than C33 with the further increase of x instead. This indicates that the atomic bonds along the {001} planes between nearest neighbors are stronger than those along the plane when x is located between 0 and 0.167. On the contrary, atomic bonds along the {001} planes between the nearest neighbors are weaker than those along the {100} plane if x is located between 0.333 and 0.833.
Table 1 The calculated elastic constants Cij (GPa) of HTB-FeF3−x(OH)x
| x |
C11 |
C22 |
C33 |
C44 |
C55 |
C66 |
C12 |
C13 |
C23 |
| 0 |
130.24 |
106.64 |
117.65 |
21.46 |
20.23 |
47.96 |
35.98 |
−14.14 |
−34.16 |
| 0.083 |
132.32 |
108.75 |
126.06 |
21.13 |
19.97 |
48.01 |
37.67 |
−10.86 |
−29.46 |
| 0.167 |
131.86 |
110.76 |
129.29 |
21.39 |
19.91 |
47.79 |
37.65 |
−9.80 |
−25.39 |
| 0.333 |
130.28 |
112.04 |
131.14 |
20.64 |
19.13 |
47.43 |
36.85 |
1.84 |
−16.05 |
| 0.667 |
128.49 |
114.00 |
140.00 |
23.23 |
18.17 |
46.34 |
35.09 |
0.87 |
−5.45 |
| 0.833 |
136.87 |
109.19 |
145.78 |
22.47 |
19.56 |
46.45 |
37.05 |
20.66 |
−0.95 |
Furthermore, from the calculated elastic constants, we can further obtain important parameters such as Young's modulus (E), shear modulus (GH), Poisson's ratio (ν) by Voigt–Reuss–Hill (VRH) approximation. For the orthorhombic system, Voigt's modulus can be written as:27–29
| |
 | (13) |
| | |
BR = (S11 + S22 + S33 + 2S12 + 2S13 + 2S23)−1
| (14) |
| | |
GR = 15[4(S11 + S22 + S33) + 3(S44 + S55 + S66) − 4(S12 + S13 + S23)]−1
| (15) |
| |
 | (16) |
where
Sij is elastic compliance constant. The compliance constant matrix (
S) has a close relationship with the elastic constant matrix (
C); and they can be expressed as
S =
C−1.
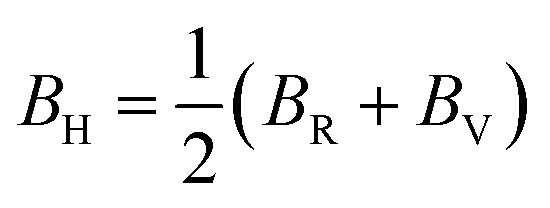
Hence, the Hill bulk modulus (BH) and shear modulus (GH) can be given as:
| |
 | (17) |
| |
 | (18) |
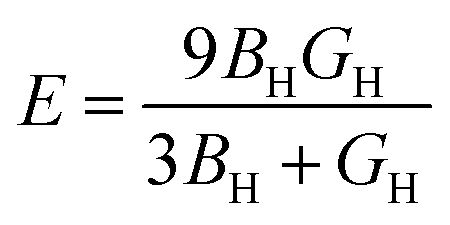
Furthermore, using BH and shear modulus GH, the Young's modulus (E) and Poisson's ratio (σ) of the polycrystalline aggregate can be calculated as follows:
| |
 | (19) |
| |
 | (20) |
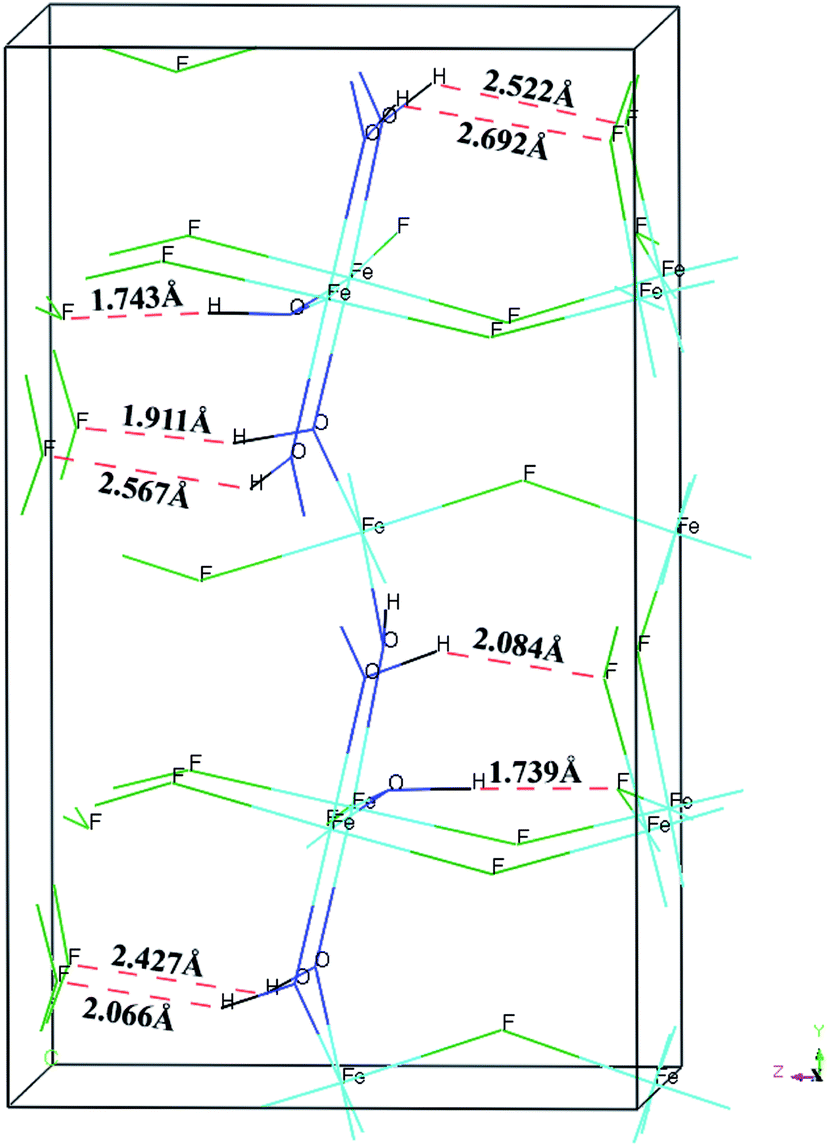
The calculated BH, Young's modulus (E) and Poisson's ratio (σ) as a function of OH− doping concentration are shown in Fig. 3. It can be noted thatBH, E and σ increase with increasing OH− doping concentration and HTB-FeF2.167(OH)0.833 has the best elastic properties, suggesting that the elastic properties of HTB-FeF3 can be improved significantly by OH− doping. In order to distinctly address the reason for the increased elastic properties by OH− doping, we carefully analyzed the crystal structure of HTB-FeF2.167(OH)0.833, and the optimal geometry is presented in Fig. 4. It is found that the H⋯F distance are in the range of 1.739–2.692 Å, which are all smaller than 3.330 Å (the sum of the van der Waals radii). On the other hand, H⋯F distances are all larger than the ionic radius between H+ and F− ions (1.342 Å). These indicate that OH−/F− interaction is a kind of hydrogen bond. In the structures, all FeF6 octahedrons are connected to each other by strong O–H⋯F hydrogen bonds and robust bond networks come into being. Therefore, the elastic properties can be improved with OH− substitution in F− positions.
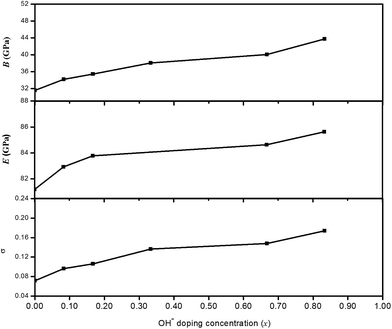 |
| | Fig. 3 B, E and σ as a function of the OH− doping concentration (x). | |
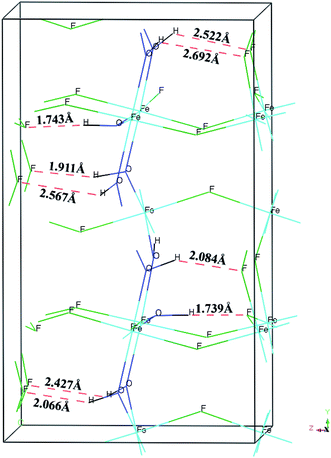 |
| | Fig. 4 Crystal model of FeF2.167(OH)0.833. Hydrogen bonds are shown as red dashed line as an aid to visualization of the hydrogen bonding network. | |
Usually, elastic anisotropy can be represented by the variation of the Young's modulus (E) of the crystals with the crystal direction. The expression for the reciprocal of E in the direction of the unit vector li in the orthorhombic system can be given as:
| | |
E = 1/(l14s11 + l24s22 + l34s33 + 2l12l22s12 + 2l12l32s13 + 2l22l32s23 + l12l22s66 + l12l32s55 + l22l32s44)
| (21) |
where
l1,
l2 and
l3 denote the direction cosines.
Based on the above relation, the directional Young's modulus and their projections along the ab, bc, and ac planes of the orthorhombic HTB-FeF3 and FeF2.167(OH)0.833 single crystal were further calculated to have a better understanding of the origin of the changes in Young's modulus along different directions. The results are shown in Fig. 5. As seen from the Fig. 5, the Young's moduli of HTB-FeF3 and FeF2.167(OH)0.833 along the a-axis direction are close to each other. While the Young's moduli of FeF2.167(OH)0.833 are larger than those of HTB-FeF3 along the b-axis and c-axis. Thus, the crystal structure of HTB-FeF3 can be noticeably strengthened with the partial substitution of OH− for F− ions, which contributes to good cyclic life of FeF2.167(OH)0.833 as a cathode material for Li-ion batteries. On the other hand, this surface would be a sphere for a perfectly isotropic system; but, this is not the case due to the different bonding characteristics between adjacent atomic planes. As can be seen in Fig. 5(a) and (b), it was found that FeF2.167(OH)0.833 shows more elastic anisotropy than HTB-FeF3.
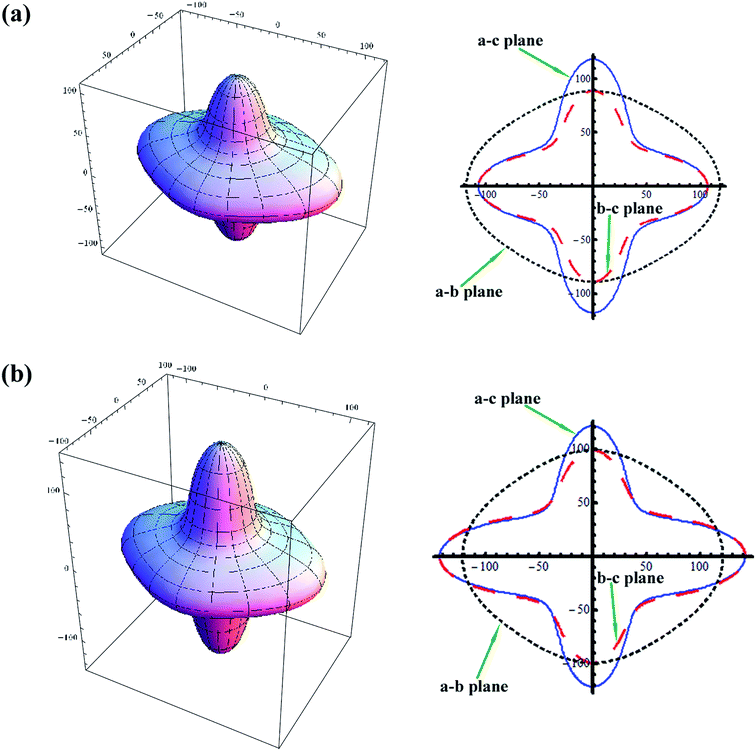 |
| | Fig. 5 Direction dependence of Young's modulus of HTB-FeF3 and HTB-FeF2.167(OH)0.833 and their projections onto the a–b, b–c and a–c planes. (a) HTB-FeF3; (b) FeF2.167(OH)0.833. | |
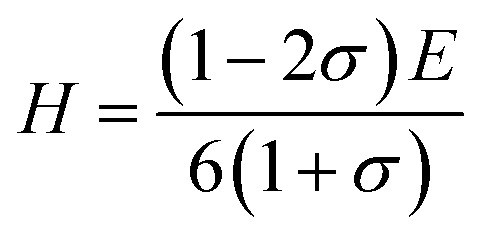
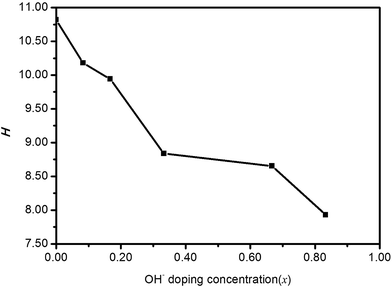
Pugh30 introduced the ratio of the bulk modulus to shear modulus (B/G) and it can be implemented as an empirical index to describe ductile-brittle characteristics of polycrystalline materials. The critical threshold value for dividing these two types of physical characteristics of materials is around 1.75. A high B/G value means better ductility, while a low B/G value implies bigger brittleness. The B/G ratio of polycrystalline HTB-FeF3−x(OH)x as a function of OH− doping concentration is illustrated in Fig. 6. It is found that the B/G values of HTB-FeF3−x(OH)x are all less than 1.75. Therefore, HTB-FeF3−x(OH)x can be classified as a ductile material. Furthermore, the ductility of polycrystalline HTB-FeF3−x(OH)x can be enhanced with the increase of the B/G ratio. In order to get further understanding of the stiffness for polycrystalline HTB-FeF3−x(OH)x, micro-hardness parameter (H) can be calculated according to following equations, as described below,31
| |
 | (22) |
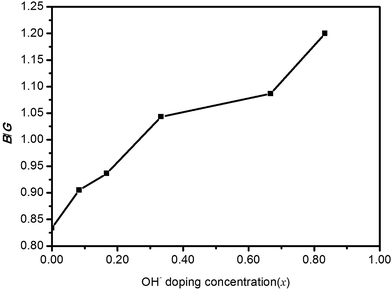 |
| | Fig. 6 B/G ratio of HTB-FeF3−x(OH)x as a function of OH− doping concentration (x). | |
The calculated H values are given in Fig. 7. It turns out that the micro-hardness would substantially decrease with the increase of OH− doping concentration. Moreover, HTB-FeF2.167(OH)0.833 can be regarded as a low-hardness material.
 |
| | Fig. 7 Micro-hardness parameter (H) for polycrystalline HTB-FeF3−x(OH)x. | |
3.3 Electronic structure
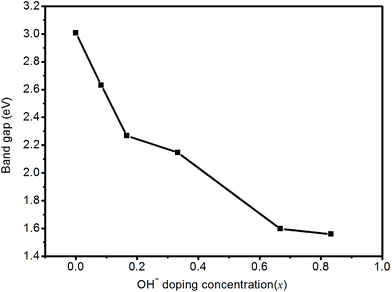
Fig. 8 shows the band gap of HTB-FeF3−x(OH)x as a function of OH− doping concentration (x). It is found that the band gap of HTB-FeF3−x(OH)x decreases with increasing OH− doping concentration and FeF2.167(OH)0.833 has the smallest the value of band gap, which suggests that OH− doping can improve the conductivity of HTB-FeF3.
 |
| | Fig. 8 The band gap of HTB-FeF3−x(OH)x as a function of OH− doping concentration (x). | |
To further relate the computed elastic properties to electronic structure, we explored the density of states (DOS), band gaps, charge density differences and Bader analysis of FeF2.167(OH)0.833 and HTB-FeF3. For comparison, the electronic band structures, along with the DOS of orthorhombic HTB-FeF2.167(OH)0.833 and HTB-FeF3, are shown in Fig. 9, respectively. The Fermi level was set to 0 eV. It was found that the band gap of HTB-FeF3 was 3.01 eV; and therefore, it belongs to materials with a wide band gap. Moreover, only slight hybridization of Fe 3d and F 2p characters occurs in the region of the valence band, which indicates that HTB-FeF3 belongs to a typical ionic crystal. On the other hand, the band gap of FeF2.167(OH)0.833 is reduced to 1.44 eV due to the introduction of an intermediate band with the main O 2p character. Hence, the electron transition from the valence band to the conduction band becomes easier and FeF2.167(OH)0.833 has better conductivity than HTB-FeF3.
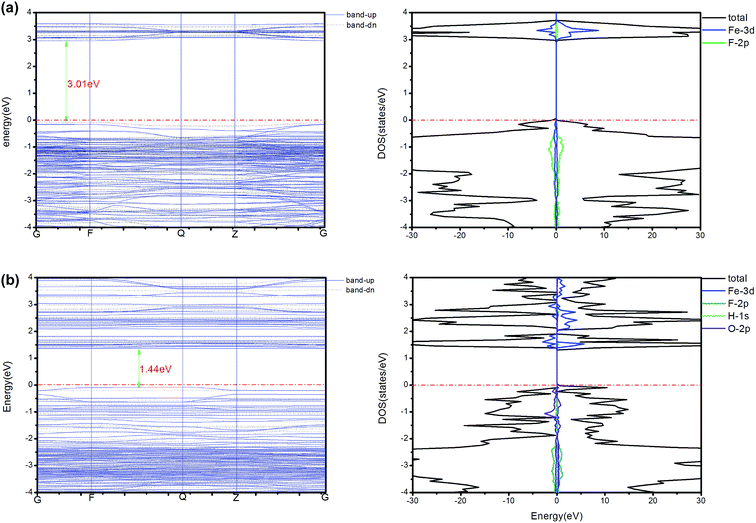 |
| | Fig. 9 The band structure and DOS (total and partial) of HTB-FeF3 and FeF2.167(OH)0.833. All energies are relative to the Fermi energies (red dashed and dotted line). | |
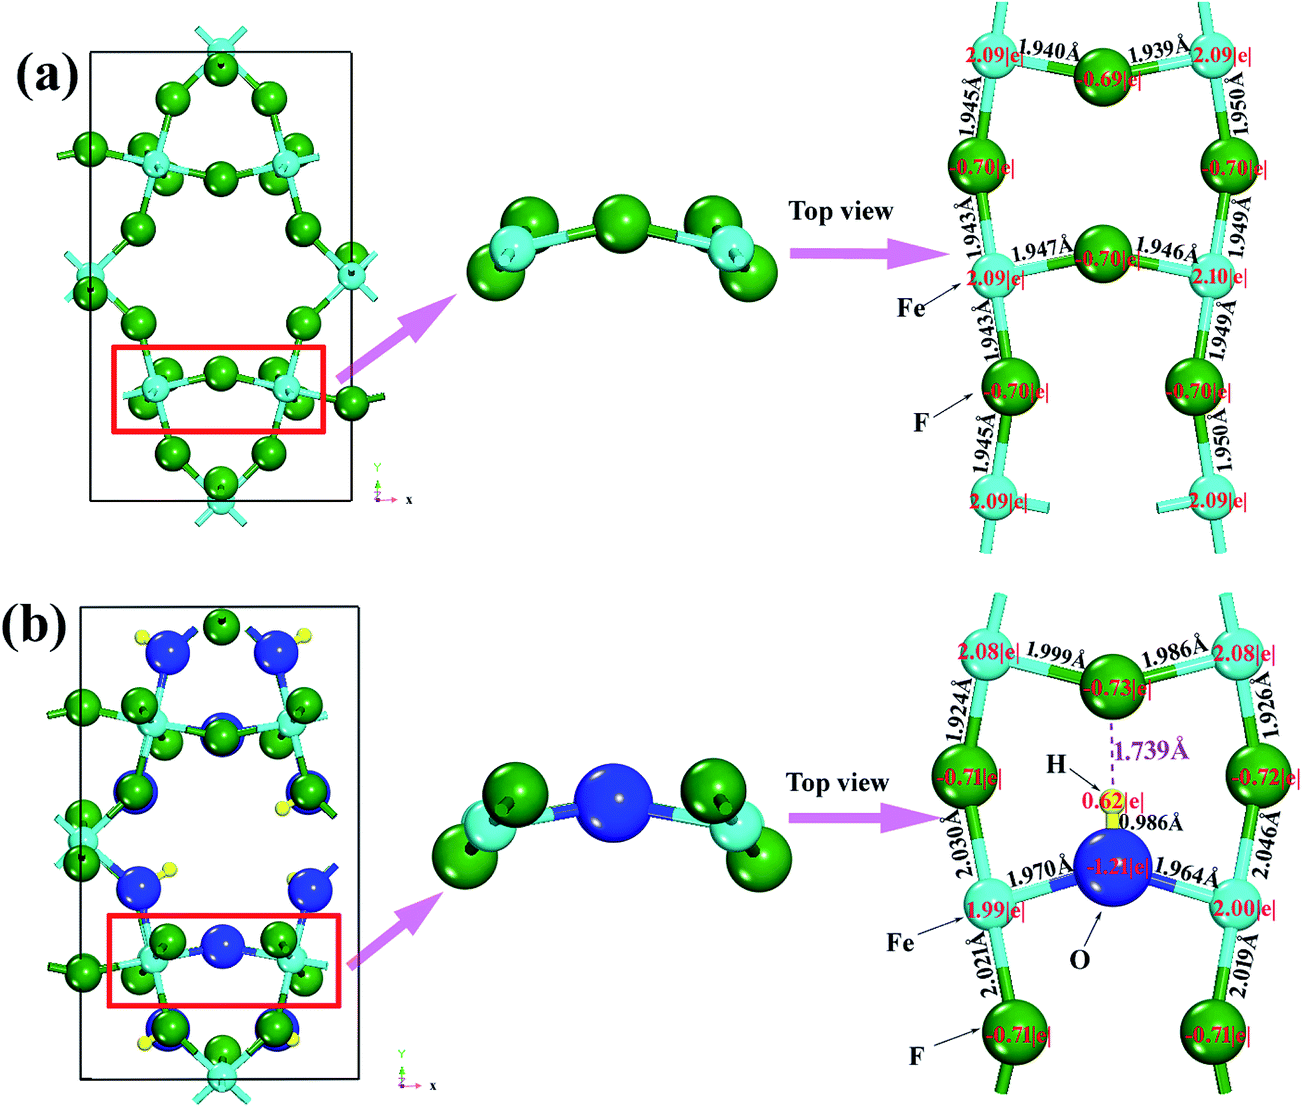
To further understand the effect of OH− doping on the nature of chemistry bonding of HTB-FeF3, we present the calculated charge density differences of HTB-FeF3 and HTB-FeF2.167(OH)0.833 in Fig. 10. As expected, for both HTB-FeF3 and HTB-FeF2.167(OH)0.833, Fe atoms almost lose their valence electrons. Valence charge density is strongly localized around F− or OH− ions and little overlaps between anion and cation are observed, which further confirm the character of the Fe–F and Fe–OH ionic bonds. Additionally, to gain more insight into the effect of the O–H⋯F hydrogen bond, in FeF2.167(OH)0.833, the 2D plane of charge density differences across the shortest O–H⋯F hydrogen bond were further investigated and plotted in Fig. 10(c). The O–H ionic bond length is 0.986 Å and H⋯F distance is 1.739 Å. Besides, the O–H⋯F bond angle is 178.922° and it is close to 180°, which indicates that very strong O–H⋯F hydrogen bonds exist. For comparison, the 2D plane of charge density differences across two F atoms at the same positions are also given in HTB-FeF3 (see Fig. 10(d)). The F⋯F distance is 3.010 Å and is very close to the F⋯F van der Waals contact distance (2.940 Å), suggesting that only F⋯F van der Waals interactions exist in HTB-FeF3 among F atoms.
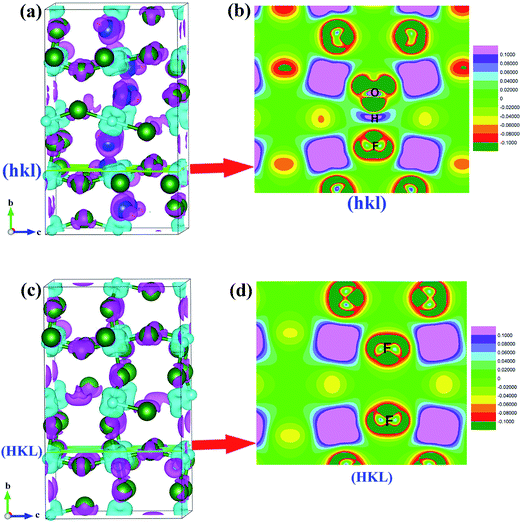 |
| | Fig. 10 Charge density differences of FeF2.167(OH)0.833 and HTB-FeF3. The isosurface level is 0.02 e Å−3. The pink and light blue isosurfaces represent gain and depletion charge density, respectively. The olive balls refers to F atoms, the dark blue balls refers to O atoms, the light blue balls refers to Fe atoms, and the smallest (yellow) balls refers to H atoms. (a) HTB-FeF2.167(OH)0.833; (b) 2D plane across O–H⋯F hydrogen bond; (c) HTB-FeF3; (d) 2D plane across F ions. | |
By inspecting O–H⋯F hydrogen bond interaction separately in HTB-FeF2.167(OH)0.833, it can be noticed that each of them induces clear accumulation of fluoride's deformation density in the direction of the hydrogen donor group. In order to quantitatively estimate the charge transfer during formation of the 3D hydrogen bond network, we performed Bader analysis based on the AIM theory; the results of the current theoretical study are summarized in Fig. 11. In general, the absolute values of atomic charges of F atoms obtained from around Fe and H in HTB-FeF2.167(OH)0.833 are higher than those in HTB-FeF3, which make strong interactions between H and F ions. Moreover, in HTB-FeF3, the Fe–F distances are in the range of 1.940–1.950 Å. While for the HTB-FeF2.167(OH)0.833 system, the Fe–F ionic bond length is located between 1.924 and 2.046 Å. This is ascribed to the effect of the O–H⋯F hydrogen bond. The formation of the charge-inverted hydrogen bond leads to the inflow of the electron charge onto the F atom. Compared with HTB-FeF3, Fe transfers less electrons to around F atoms in general, which weakens the interaction between Fe and F atoms. Therefore, generally speaking, the Fe–F ionic bond length in FeF2.167(OH)0.833 is larger than those in HTB-FeF3, which leads to HTB-FeF2.167(OH)0.833 having a larger lattice constant than HTB-FeF3 in the a-axis direction (7.486 Å vs. 7.436 Å). On the other hand, it is observed that HTB-FeF2.167(OH)0.833 has a smaller lattice constant than HTB-FeF3 in the b-axis and c-axis direction (b-axis: 12.706 Å vs. 12.773 Å; c-axis: 7.512 Å vs. 7.528 Å). This is because the interactions among [FeF6]n− octahedrons are strengthened by strong O–H⋯F hydrogen bonds in the b-axis and c-axis direction. Compared with orthorhombic HTB-FeF3 and HTB-FeF2.167(OH)0.833, HTB-FeF2.167(OH)0.833 exhibits larger bulk and Young's modulus. Combined with analysis of the electronic structure, the directional O–H⋯F hydrogen bond plays a decisive role in enhancing the strength of orthorhombic HTB-FeF2.167(OH)0.833. Therefore, partial substitution of OH− for F− ions is a good strategy to improve the conductivity and strength of HTB-FeF3, which contributes to the improvement of its electrochemical properties.
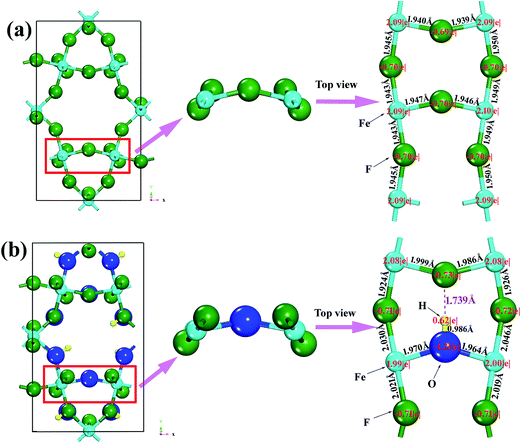 |
| | Fig. 11 The Bader analysis and local structure of FeF3 and HTB-FeF2.167(OH)0.833. (a) HTB-FeF3; (b) HTB-FeF2.167(OH)0.833. | |
4. Conclusions
We have performed first-principles computations on orthorhombic HTB-FeF3−x(OH)x, including structural parameters, formation energies, elastic, electronic and bonding properties. The calculated results reveal that the formation of HTB-FeF3−x(OH)x is an exothermic process, and therefore, HTB-FeF3−x(OH)x can be fabricated in usual growth conditions. Bulk moduli (BH), Young's moduli (E) as well as Poisson's ratio (σ) increase with increasing OH− doping concentration. HTB-FeF2.167(OH)0.833 has the best elastic properties, suggesting that the strength of HTB-FeF3 can be improved significantly by OH− doping. Moreover, HTB-FeF3−x(OH)x can be classified as a ductile material. Furthermore, ductility of polycrystalline FeF3−x(OH)x can be enhanced with increasing OH− doping concentration. FeF2.167(OH)0.833 has a more obvious elastic anisotropy than HTB-FeF3. These are all ascribed to the strong effect of the O–H⋯F hydrogen bond. In HTB-FeF2.167(OH)0.833, it can be noticed that each of them induces clear accumulation of fluoride's deformation density in the direction of the hydrogen donor group. Furthermore, the band gap of HTB-FeF3−x(OH)x decreases with increasing OH− doping concentration (x) and the band gap of HTB-FeF2.167(OH)0.833 is 1.44 eV, which indicates that the electron transition from the valence band to the conduction band becomes easier and easier with increasing OH− doping concentration. In a word, OH− doping is an effective method to improve the elastic constants and electronic structure of HTB-FeF3. Our calculated results can afford theoretical explanation for present experiment in the crystal structure.
Acknowledgements
This work is financially supported by the National Natural Science Foundation of China (Grant No. 21573187), A Project supported by Scientific Research Fund of Hunan Provincial Education Department (Grant No. 15B228), China Postdoctoral Science Foundation funded project (Grant No. 2016M592435), Start-up funds for doctor supported by Xiangtan University (Grant No. 12QDZ02), and Opening Foundation of Key Laboratory of Materials Design and Preparation Technology of Hunan Province (Grant No. KF20140701).
References
- L. S. Li, R. Jacobs, P. Gao, L. Y. Gan, F. Wang, D. Morgan and S. Jin, J. Am. Chem. Soc., 2016, 138, 2838–2848 CrossRef CAS PubMed.
- L. S. Li, F. Meng and S. Jin, Nano Lett., 2012, 12, 6030–6037 CrossRef CAS PubMed.
- J. L. Tan, L. Liu, H. Hu, Z. H. Yang, H. P. Guo, Q. L. Wei, X. Yi, Z. C. Yan, Q. Zhou, Z. F. Huang, H. B. Shu, X. K. Yang and X. Y. Wang, J. Power Sources, 2014, 251, 75–84 CrossRef CAS.
- Z. Long, W. Y. Hu, L. H. Liu, G. H. Qiu, W. C. Qiao, X. F. Guan and X. Q. Qiu, Electrochim. Acta, 2015, 151, 355–362 CrossRef CAS.
- C. L. Li, C. L. Yin, L. Gu, R. E. Dinnebier, X. K. Mu, P. A. van Aken and J. Maier, J. Am. Chem. Soc., 2013, 135, 11425–11428 CrossRef CAS PubMed.
- C. L. Li, C. L. Yin, X. K. Mu and J. Maier, Chem. Mater., 2013, 25, 962–969 CrossRef CAS.
- C. Chen, X. P. Xu, S. Chen, B. Zheng, M. Shui, L. X. Xu, W. D. Zheng, J. Shu, L. L. Cheng, L. Feng and Y. L. Ren, Mater. Res. Bull., 2015, 64, 187–193 CrossRef CAS.
- B. J. Li, Z. J. Cheng and N. Q. Zhang, Nano Energy, 2014, 4, 7–13 CrossRef CAS.
- C. L. Li, L. Gu, J. W. Tong and J. Maier, ACS Nano, 2011, 5(4), 2930–2938 CrossRef CAS PubMed.
- X. P. Xu, S. Chen, M. Shui, L. X. Xu, W. D. Zheng, J. Shu, L. L. Cheng, L. Feng and Y. L. Ren, Ceram. Int., 2014, 40, 3145–3148 CrossRef CAS.
- H. Jung, J. Shin, C. Chae, J. K. Lee and J. Kim, J. Phys. Chem. C, 2013, 117, 14939–14946 CAS.
- D. L. Ma, H. G. Wang, Y. Li, D. Xu, S. Yuan, X. L. Huang, X. B. Zhang and Y. Zhang, Nano Energy, 2014, 10, 295–304 CrossRef CAS.
- Z. S. Li, B. Z. Wang, C. L. Li, J. J. Liu and W. Q. Zhang, J. Mater. Chem. A, 2015, 3, 16222–16228 CAS.
- A. Pohl, M. Faraz, A. SchrÖder, M. Baunach, W. Schabel, A. Guda, V. Shapovalov, A. Soldatov, V. S. K. Chakravadhanula, C. Kübel, R. Witte, H. Hahn, T. Diemant, R. Jürgen Behm, H. Emerich and M. Fichtner, J. Power Sources, 2016, 313, 213–222 CrossRef CAS.
- M. Burbano, M. Duttine, O. Borkiewicz, A. Wattiaux, A. Demourgues, M. Salanne, H. Groult and D. Dambournet, Inorg. Chem., 2015, 54, 9619–9625 CrossRef CAS PubMed.
- M. Duttine, D. Dambournet, N. Penin, D. Carlier, L. Bourgeois, A. Wattiaux, K. W. Chapman, P. J. Chupas, H. Groult, E. Durand and A. Demourgues, Chem. Mater., 2014, 26, 4190–4199 CrossRef CAS.
- G. Kresse and J. Furthmüller, Phys. Rev. B: Condens. Matter Mater. Phys., 1996, 54, 11169 CrossRef CAS.
- G. Kresse and D. Joubert, Phys. Rev. B: Condens. Matter Mater. Phys., 1996, 59, 1758 CrossRef.
- R. F. Li, S. Q. Wu, Y. Yang and Z. Z. Zhu, J. Phys. Chem. C, 2010, 114, 16813–16817 CAS.
- J. Klimes, D. R. Bowler and A. Michelides, J. Phys.: Condens. Matter, 2010, 22, 022201 CrossRef PubMed.
- J. Klimes, D. R. Bowler and A. Michelides, Phys. Rev. B: Condens. Matter Mater. Phys., 2011, 83, 195131 CrossRef.
- J. X. Guo, H. Fu, G. D. Zou, B. Z. Liu and Q. M. Peng, J. Alloys Compd., 2015, 632, 68–72 CrossRef CAS.
- Y. Pan, H. W. Huang, X. Wang and Y. H. Lin, Comput. Mater. Sci., 2015, 109, 1–6 CrossRef CAS.
- M. K. Niranjan, Intermetallics, 2012, 26, 150–156 CrossRef CAS.
- Y. H. Duan, Z. Y. Wu, B. Huang and S. Chen, Comput. Mater. Sci., 2015, 110, 10–19 CrossRef CAS.
- P. Ravindran, L. Fast, P. A. Korzhavyi, B. Johansson, J. Wills and O. Eriksson, J. Appl. Phys., 1998, 84(9), 4891–4904 CrossRef CAS.
- M. K. Niranjan, Intermetallics, 2012, 26, 150–156 CrossRef CAS.
- W. H. Chen, C. F. Yu, K. N. Chiang and H. C. Cheng, Intermetallics, 2015, 62, 60–68 CrossRef CAS.
- S. N. Li, X. Ju and C. B. Wan, Comput. Mater. Sci., 2014, 81, 378–385 CrossRef CAS.
- S. F. Pugh, Philos. Mag., 1954, 45, 823 CrossRef CAS.
- L. Nie, W. B. Zhou and Y. Z. Zhan, Comput. Theor. Chem., 2013, 1020, 51–56 CrossRef CAS.
|
| This journal is © The Royal Society of Chemistry 2016 |
Click here to see how this site uses Cookies. View our privacy policy here. 


 were calculated as a function of strains δ from −0.05 to 0.05 in steps of 0.01. Therefore, the elastic constant could be obtained by fitting these data points vs. a parabola. As we know, the orthorhombic system has nine independent elastic constants: C11, C12, C13, C22, C23, C33, C44, C55 and C66. The criterion for mechanical stability of orthorhombic crystal structures can be given by: