J. Arturo Mendoza-Nieto* and
Heriberto Pfeiffer
Instituto de Investigaciones en Materiales, Universidad Nacional Autónoma de México, Ciudad Universitaria, Circuito exterior s/n, Del. Coyoacán, CP 04510, México DF, Mexico. E-mail: amendozan@comunidad.unam.mx; Fax: +52 55 5616 1371; Tel: +52 55 5622 4627
First published on 7th July 2016
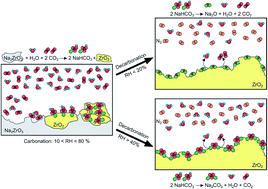
In the present work, Na2ZrO3 was synthetized via a solid-state reaction and characterized by powder X-ray diffraction and N2 physisorption techniques, where desired structural and microstructural characteristics were confirmed. Then, the ceramic material was tested dynamically and isothermally in a low temperature range (30–80 °C) for carbonation and decarbonation processes using relative humidity (RH) values between 0 and 80%. Thermogravimetric results indicate that humidity has a positive influence over the carbonation process, thus the amount of CO2 captured increases as a function of relative humidity. When high values of humidity (70 and 80%) were used, the increase in sample weight was higher than the theoretical amount of 57.2 wt% expected in wet conditions. This result was attributed to the formation of NaHCO3 with a mesoporous microstructure. Then, the relative humidity effect was studied during the decarbonation stage as a sequential step after the carbonation process, using a N2 flow. Infrared spectroscopy and thermogravimetric results showed that NaHCO3 decomposition took place in this process. At low RH values, 0 and 20%, NaHCO3 is decomposed in Na2O and Na2CO3; whereas, when RH was increased between 40 and 80%, only the presence of Na2CO3 was observed. This result indicates that at high humidity conditions the Na2O formation is avoided. Thermal curves show that Na2CO3 decomposition presented a maximum efficiency at 40% of RH, which seems to be the optimal condition for the decarbonation step. Finally, sequential carbonation–decarbonation tests were performed with sodium zirconate samples. Infrared and thermal analyses confirm that it is possible to accomplish successively at least eight cycles of carbonation and decarbonation steps and to obtain high NaHCO3 and Na2CO3 regenerations.
Among alkali ceramics, sodium zirconate (Na2ZrO3) is a ceramic material that has been synthetized, characterized and used as a catalytic material or chemical sorbent for different reactions due to good physicochemical properties, high surface basicity, mechanical strength, thermal stability until 900 °C and high regeneration ability, e.g. biodiesel production by soybean oil transesterification,18 hydrogen production through methane reforming,19 carbon monoxide (CO) oxidation20 and carbon dioxide capture and storage at T > 500 °C, showing high capacity in the last process.21–25
One goal in CCS is to increase the amount of CO2 captured during a carbonation process. In this line, it has been proposed the incorporation of water vapor into the reaction system as a promissory condition for enhancing the chemisorption of carbon dioxide. Thus, it has been already studied the chemisorption ability of Na2ZrO3 in absence24,26,27 and presence28,29 of water vapor. Results showed that in dry conditions sodium zirconate is able to capture between 10 and 24 wt% of CO2 in a high temperature range (500–850 °C), obtaining the highest capture at around 550 °C. On the other hand, when water vapor was added, the chemisorption process took place at much lower temperature, between 40 and 70 °C, obtaining higher amounts of CO2 captured (25–35 wt%) than in dry conditions at similar thermal conditions, as it was described above. The reaction mechanism for the Na2ZrO3–CO2–H2O system was presented by Santillán-Reyes G. et al.28 as follow: Na2ZrO3 ceramic reacts with water vapor to produce in the beginning of the process hydroxyl species at the particle surfaces and then absorbs 2 mol of CO2 and 1 mol of H2O to eventually form 2 mol of NaHCO3 and ZrO2. This mechanism clearly show the benefits of using wet atmosphere during CO2 chemisorption, allowing capture higher amount of carbon dioxide than in dry conditions, where only 1 mol of CO2 can be captured as a result of the chemisorption process. In this line, Na2ZrO3 can be proposed as a solid adsorbent at low temperatures in a post-combustion capture technologies,30 where wet environments are due to the water vapor presence as a combustion product.31
Also, Na2ZrO3 regeneration ability in sequential CO2 carbonation and decarbonation processes has been studied at high temperature range.22,32,33 Results showed clearly that sodium zirconate regeneration is feasible, after several sequential steps of CO2 chemisorption and desorption in a high temperature range between 500 and 800 °C, due to high thermal stability. However, up to now Na2ZrO3 regeneration ability for sequential CO2 carbonation and decarbonation processes have not been deeply studied when water vapor is added in the system at low temperatures. Therefore, the aim of this work was to test the carbon dioxide absorption and desorption ability of Na2ZrO3 and then elucidate if relative humidity (RH) has a significant influences over carbonation and decarbonation processes in a low temperature range (30–80 °C).
The ceramic obtained was characterized structurally and microstructurally by powder X-ray diffraction (XRD) and nitrogen adsorption-desorption analyses. XRD pattern was recorded in the 10° ≤ 2Θ ≤ 70° range, using a goniometer speed of 1°(2Θ) min−1, with a diffractometer Siemens D5000 coupled to a cobalt anode (λ = 1.789 Å) X-ray tube. Once the Na2ZrO3 crystalline structure was confirmed, nitrogen adsorption-desorption isotherms were measured with a Bel-Japan Minisorp II equipment at 77 K using a multipoint technique. Prior to the physisorption experiment, the ceramic sample was degassed (p < 10−1 Pa) at room temperature for 12 h in vacuum. Finally, specific surface area (SBET) was calculated according to the BET method.
Thermal analyses were performed in three sections. In the first part, a set of Na2ZrO3 samples were heat-treated dynamically in a CO2 gas flow, with a heating rate of 0.5 °C min−1 from 30 to 80 °C maintaining RH constant at 0, 10, 20, 40, 60 and 80%. In the second experimental section, Na2ZrO3 samples were isothermically carbonated at 80 °C and 80% of RH during 2 h using a CO2 flow, continuing with a decarbonation step under N2 as a carrier gas and setting RH at different values (0, 20, 40, 60 and 80%) during 4 h. Finally, in the third part of the experimentation, carbonation and decarbonation steps were undertaken successively at 80 °C using the best conditions of RH obtained for each step: 80% of RH for carbonation step and 40% of RH for decarbonation step.
Afterwards, the products obtained from dynamic and isothermal tests were characterized by attenuated total reflection infrared spectroscopy (ATR-FTIR) and thermogravimetric analysis (TGA). For ATR-FTIR spectroscopy an Alpha-Platinum spectrometer from Bruker was used, whereas TG measurements were performed using 10 mg of sample under nitrogen atmosphere in a Q500HR equipment from TA Instruments at a heating rate of 10 °C min−1 from 30 to 800 °C.
Na2ZrO3(s) + CO2(g) → Na2CO3(s) + ZrO2(s) | (1) |
![]() | ||
Fig. 2 TG (A) and ATR-FTIR spectra (B) of Na2ZrO3 samples tested dynamically in CO2 chemisorption with 0, 10, 20, 40, 60 and 80% of RH. (△) Na2CO3 and (○) NaHCO3 vibration bands. |
When a wet condition was employed, a higher weight increase was observed. This behavior may be due to the sodium bicarbonate (NaHCO3) formation, during the hydration–carbonation processes in presence of water vapor and CO2, as reaction (2) shows.
Na2ZrO3(s) + 2CO2(g) + H2O(v) → 2NaHCO3(s) + ZrO2(s) | (2) |
It has been described in the literature15,28,36–38 that the addition of water vapor significantly improves the amount of CO2 chemisorbed on different ceramic materials. Thus, in this case, if water molecules react with sodium zirconate, superficially, Na–OH species should be produced. Then, the activated surface must be more reactive for CO2 chemisorption. Therefore, Na2ZrO3 may have reacted with CO2 because of a hydroxylated surface, producing sodium bicarbonate.
In Fig. 2A it can be seen that the addition of water vapor into the reaction system significantly improves the total weight increment. In fact, using low values of relative humidity, e.g. 10%, it was possible to gain 32.5 wt%. This amount is 36.5% higher than the theoretical amount of CO2 chemisorbed in dry conditions, according to reaction (1). As the percentage of RH increases in Fig. 2A, the weight of the sample increases too. At this point, it must be pointed out that the theoretical maximum amount of CO2 that can be chemisorbed over sodium zirconate sample is 57.2 wt% in wet conditions, according to reaction (2). However, the dynamic profiles of the samples tested at 60 and 80% of RH importantly reached higher percentages: 62.8 and 69.0 wt%, respectively. According to Martínez-dlCruz et al.,27 the above result could be associated to a mesoporous NaHCO3 external shell formation as a consequence of the CO2 chemisorption over the ceramic surface. Therefore, the presence of this type of pores in the external shell allowed CO2 diffusion chemisorption. In addition, the exceeded weight increment (11.8 wt%), which could be associated to a water adsorption on the surface and porosity produced.
All the products of dynamic tests were characterized via ATR-FTIR in order to determinate the composition in the sample. The corresponding spectra are shown in Fig. 2B. In dry conditions, as expected, the sample is composed by Na2CO3, according to the vibration bands located at 420, 490, 697, 840, 880 and 1402 cm−1 in the FTIR spectrum. The spectra of samples treated with water vapor addition (10–80% RH) present vibration bands at 660, 692, 836, 998, 1037, 1050, 1300, 1454, 1623, 1662, 1910 and 2508 cm−1. All these bands fitted well with the NaHCO3 FTIR spectrum.28,39 Independently of RH used during the dynamic tests, the presence of sodium bicarbonate was established. Also, it can be observed other bands located at 420, 490, 840 and 1402 cm−1 in the samples spectra of the products treated at 10, 20 and 40% of RH. These vibration bands correspond to sodium carbonate FTIR spectrum.28 In Fig. 2B, an increase in the intensity of the NaHCO3 vibration bands and a decrease in the Na2CO3 bands were observed when the RH percentage employed increases from 10 to 80%. This result shows that the formation of NaHCO3 is benefited at high relative humidity values. Also, the above result indicates that a low RH values (≤40%), the reactions (1) and (2) proceed at the same time due to the low amount of water vapor into the reaction system, producing the formation of two carbonated compounds: Na2CO3 and NaHCO3; whereas at RH percentages higher than 40%, the bicarbonate sodium is the only carbonated compound present in the sample.
With the aim for determining if a NaHCO3 porous core shell was formed in the samples humidity-treated at high values of RH, the sample carbonated dynamically at 80% of RH was characterized via nitrogen adsorption–desorption (Fig. 3). For comparison purposes, the isotherm of the original sample was presented as well. Both isotherms present a type II isotherm with no hysteresis loop evident. The sample humidity-treated presented a SBET value equal to 11.7 m2 g−1, that is almost four times bigger than the superficial area obtained for the original sample (3.0 m2 g−1). This result confirms the idea of the porous or somehow texturized core shell formation due to the carbonation species chemisorbed over the sodium zirconate.
![]() | ||
Fig. 3 N2 adsorption–desorption isotherms of (a) original sodium zirconate and (b) sample treated dynamically at 80% of RH in a CO2 flow. |
Then, the products tested in the presences of water vapor at different RH values, were analyzed also by thermogravimetric analysis in order to determinate the decomposition temperature of carbonated compounds present in the samples. The thermogravimetric (TG) and derivate thermogravimetric (DTG) curves are shown in Fig. 4. The decomposition profiles, as expected, presented a decrease in the sample weight at different temperatures. The first weight lost, near to 100 °C in all samples, is the most important weight decrease. The process that takes place at this temperature is the decomposition of NaHCO3 in Na2CO3, as reaction (3) shows. As it can be seen in Fig. 4A, the lost weight increases when the relative humidity increases from 10 to 80%.
2NaHCO3(s) → Na2CO3(s) + H2O(v) + CO2(g) | (3) |
The theoretical percentage that the sample can lose is 21.3 wt% according to reaction (3). The sample tested at 40% of RH shows almost the theoretical amount (20.6 wt%); however, the samples humidity-treated at 60 and 80% of RH, presented higher weight lost: 23.5 and 24.0 wt% respectively, at temperatures ≤200 °C. The above result indicates that in the samples tested at 60 and 80% of RH presented a partial hydration process. This result is in agreement with the observation made it at dynamic tests, where it was propose that a carbonated core shell with mesopores was formed during the capture of CO2 in wet conditions (RH ≥ 60%), allowing the capture of CO2, forming sodium bicarbonate, and the H2O adsorption.
Additionally, between 230 and 350 °C, the profiles of the samples treated at low RH values (10 and 20%) presented a decrease of 6.0 and 4.0 wt%, respectively. The weight lost in these samples can be attributed to the superficial dehydroxylation process,28 indicating a non-complete carbonation process. The rest of the samples do not present any weight decrease in this range of temperature. Finally, at temperatures higher than 600 °C all the samples began to lose weight due to decarbonation process in the Na2ZrO3 particles.
DTG curves obtained from TGA profiles are presented in Fig. 4B. These analyses allow us to determinate the temperature that the processes described above occur. All samples present an endothermic peak located between 85 and 145 °C with maximum in 117 °C, which is related to the NaHCO3 decomposition under nitrogen flow. This result shows that the presence of sodium bicarbonate increases as function of RH percentage. Thus, the highest amount of NaHCO3 was formed when 80% of RH was employed and as expected this sample presented the larger endothermic peak at low temperature (≤150 °C) among all samples decomposed.40 Only the curves of samples treated at 10 and 20% of RH, presented a second distribution with maximum at 318 °C that was ascribed to the superficial dehydroxylation and Na2CO3 decomposition.
![]() | ||
Fig. 5 Carbonation isotherm (A) and thermogravimetric analyses (B) of Na2ZrO3 sample tested under CO2 flow at 80 °C and 80% of RH. |
After, the isothermal product was characterized by TG and DTG analyses (Fig. 5B), the decomposition profile presented a similar behavior than that previously observed in the sample treated dynamically at 80% of RH (Fig. 4). The decomposition curve shows a main decrease between 100 and 135 °C, related with the decomposition of NaHCO3 to Na2CO3. According to DTG result this process took place at 127 °C. The temperature obtained in this case is higher than those obtained in the DTG curve of the sample treated dynamically at 80% RH (117 °C, Fig. 4B). This can be due to the differences in the experiments conditions. In dynamic test, the temperature increases from 30 to 80 °C during the experiment, whereas in the isothermal test, the experimental conditions were maintained at 80 °C during 2 h. Finally, the second weight decrease in TGA profile began at 730 °C according to DTG curve. This weight loss was attributed to decarbonation process.
In order to deeply understand the phenomena occurring during the decomposition stage, a serial of experiments at 80 °C with values of RH equal to 0, 20, 40, 60 and 80% were undertaken during 4 h, maintaining constant the conditions of 80 °C and 80% of RH in the previous carbonation stage. After these tests, the products were collected and then analyzed via ATR-FTIR technique (Fig. 7), where some differences in the spectra were observed. As it can be seen, at low RH values (0 and 20%), the presence of sodium oxide and some traces of sodium carbonate were detected. The vibration bands located at 704, 762, 880, 990, 1465 and 1621 cm−1 were fitted with the Na2O FTIR spectrum, whereas the bands observed at 430, 500, 840, 1360 and 1410 cm−1 were associated to Na2CO3 spectrum.28 The Na2CO3 and Na2O formation were due to the sequential NaHCO3 and Na2CO3 decompositions under nitrogen flow, according to reactions (3) and (4). However, when CO2 was desorbed during the decarbonation step, sodium atoms as Na2O remain over the Na2ZrO3 particle surfaces. As the temperature and relative humidity are low, sodium atoms seems not to be kinetically able to be reincorporated in the sodium zirconate crystalline structure.43
Na2CO3(s) → Na2O(s) + CO2(g) | (4) |
![]() | ||
Fig. 7 ATR-FTIR spectra of Na2ZrO3 samples carbonated at 80 °C and 80% of RH and then decarbonated at 0, 20, 40, 60 and 80% of RH. (⋄) OH, (*) Na2O and (△) Na2CO3 vibration bands. |
On the other case, when RH percentage was between 40 and 80%, only the presence of sodium carbonate was observed and additional vibration bands for sodium carbonate compound were observed at 618, 671, 697, 1049, 1647 and 1732 cm−1. The Na2O vibration bands were not detected anymore. This result indicates that NaHCO3 was only decomposed in Na2CO3 in humid conditions. It seems that water vapor presence inhibits the sodium carbonate decomposition in sodium oxide. The spectra of humidity-treated samples at high RH percentage show a decrease of sodium carbonate in the sample when the RH value increases. Also in those spectra, an additional vibration band was observed at 3300 cm−1, related to adsorbed water.
Carbonation–decarbonation products were characterized by TG and DTG analyses (Fig. 8). All the decomposition profiles presented two weight loss temperature ranges; T < 200 °C and T > 650 °C (Fig. 8A). Sample weight decrease as function of RH percentage was observed, thus the sample humidity-treated at 80% presented the highest weight lost among all the samples tested. Also, this sample was the only sample that presented a different behavior at low temperature range where a weight lost was observed around 90 °C, whereas the rest of the samples presented the weight lost at 115 °C, according to DTG curves (Fig. 8B). This variation is associated to the decomposition of Na2O at low values of RH (10 and 20%), whereas at higher relative humidity percentages is related to the Na2CO3 decomposition. As it can be seen in DTG curves, the best sodium carbonate decomposition was presented at 40% of RH, which seems to be the optimal condition for decarbonation. When higher RH values than 40% of RH were used, a decrease in the amount of Na2CO3 decomposed was observed. In fact, sample humidity-treated at 80% of RH is the unique that presented two signals in DTG curve, that can be associated the first one to sodium carbonate decomposition at 115 °C and the second signal at 90 °C can be ascribed to water evaporation process. Finally, the second weight decrease in TGA profile (Fig. 8A) took place at around 720 °C. This weight loss was attributed to decarbonation process in the Na2ZrO3 particles.
In the TG profiles for the samples treated in the different stages can be seen that in all carbonation end-stages (0.5, 1.5 and 2.5), high amount of CO2 and water were captured (between 65 and 69 wt%, data not shown) at 80% of RH, whereas in decarbonation end-stages (1.0 and 2.0), in all cases a decrease in weight between 15 and 20 wt% was observed as consequence of NaHCO3 decomposition in sodium carbonate at 40% of RH. These results show that it was possible to capture high amounts of CO2 and then desorb it in sequential carbonation–decarbonation stages at 80 °C. After that, all products obtained were collected and then characterized via ATR-FTIR and thermogravimetric analyses.
Fig. 9 shows the ATR-FTIR results for different carbonation–decarbonation stages. As expected, the sample tested only in carbonation step (stage 0.5), present vibration bands related to the presence of NaHCO3 (vibration bands assigned in Fig. 2B). When the sample was tested successively in carbonation–decarbonation processes (stage 1.0), a different spectrum was observed. In this case, the vibration bands of Na2CO3 and –OH groups were detected in the sample. The above results confirm that after a carbonation process at 80% of RH, it is possible that a decarbonation step takes place when the sample is exposed in a nitrogen flow with the optimal RH of 40%. Then, when sample was exposed to the successively carbonation–decarbonation–carbonation steps (stage 1.5), in the spectrum were detected only vibration bands of NaHCO3, confirming that high regeneration of sodium bicarbonate was accomplished. It seems that the presence of Na2CO3 on surface after a decarbonation step was beneficial for a second carbonation step, due that CO2 capture can continue over this core shell of sodium carbonate and form again a core shell of NaHCO3.
Finally, sample spectrum treated in the stage 2.0 shows the presences of Na2CO3, as the only carbonated compound formed during the decomposition step under N2 flow (stage 2.0); whereas a regeneration of NaHCO3 was registered in the sample treated with CO2 flow in the stage 2.5. This result confirms that it is possible to perform sequential carbonation–decarbonation processes over sodium zirconate and obtain a good regeneration of sodium bicarbonate and sodium carbonate after several decarbonation and carbonation steps at relatively low temperature.
In order to determinate the thermal behavior; products were characterized by thermogravimetric analyses (Fig. 10). Decomposition curves in Fig. 10A present two different behaviors. The profiles of samples treated in carbonated end-stages (0.5, 1.5 and 2.5) show higher weight decrease than samples treated in decarbonation end-stages (1.0 and 2.0). These results are in agreement with previous TG profiles presented in Fig. 5B and 8A. In samples treated in decarbonation end-stages, the weight lost is due to NaHCO3 decomposition; whereas samples treated in decarbonation end-stages, exhibit a weight lost due to Na2CO3 dehydration. According to DTG profiles (Fig. 10B), decomposition processes take place at 127 and 115 °C, respectively. Also DTG profiles in Fig. 10B show that samples treated in carbonation end-stages, present the same decomposition temperature (127 °C) regardless the stage, however a decrease in the DTG curves was observed for the stages 1.5 and 2.5. A similar behavior was observed in the profiles of samples treated in decarbonation end-stages, where the same temperature was observed (115 °C) for this kind of stages.
Finally, a cyclability study was performed on this ceramic material in order to assess the regeneration properties after several cycles of carbonation and decarbonation. Fig. 11 shows the profiles obtained during eight carbonation and decarbonation processes. The maximum amount of CO2 captured in the cycles 1–4 was higher than 64 wt% that is near to the amount chemisorbed in Fig. 5; whereas in the last four cycles, the amount of CO2 captured decreases until 57.0 wt%. A decrease in the amount of CO2 captured after eight cycles can be related to a decrement in the core shell formation due to the carbonation species chemisorbed. With the aim to determinate if the porous core shell was affected after cyclic tests, the product obtained was characterized by N2 physisorption. As expected, the SBET of the product was lower (6.9 m2 g−1) than that reported for the sample treated dynamically (Fig. 3), but 2.3 times higher than the pristine material (3.0 m2 g−1), indicating that after 8 cycles, the NaHCO3 porous core shell still remains over the ceramic surface. The above results confirm that it is possible to accomplish successively carbonation–decarbonation steps at 80 °C, obtaining high regeneration of NaHCO3 and Na2CO3 at the optimal values of relative humidity during carbonation (80% of RH) and decarbonation (40% of RH) processes.
In carbonation process, the addition of water vapor into the reaction system significantly improves the CO2 chemisorption. In fact, using low values of relative humidity, e.g. 10%, it was possible to capture 32.5 wt% of CO2. This result is higher than the theoretical value calculated in dry conditions (23.8 wt%), and it was attributed to the NaHCO3 formation. Also, in dynamic tests it was observed that when RH percentage increases, the CO2 capture is significantly improved. Thus, at 80% of RH was the best condition for NaHCO3 formation during carbonation step at 80 °C. At these physicochemical conditions, it was possible to capture the highest amount of CO2, 13.0 mmol per gram of ceramic material. This amount is a high amount of CO2 captured, considering the low temperature range employed.
Regarding to decarbonation process, it was observed a different behavior which depends strongly of the value of RH used. In this step three different cases were observed: (1) at RH < 20% it was observed the presence of Na2O, which is a low stable compound, (2) at RH between 40 and 60%, only was detected the presence of sodium carbonate and (3) at RH = 80%, it was noticed the presence of small amounts Na2CO3 and also the presence of a high amounts of water condensed over the ceramic surface. Thus, the amount of Na2CO3 presented a maximum point at 40% of RH (DTG), which corresponds to the optimal condition for decarbonation step.
Finally, according to characterization results it can be established that using 80% of RH during carbonation step and 40% of RH in decarbonation step at 80 °C, it is possible to accomplish successively at least eight carbonation–decarbonation processes, obtaining high regeneration of sodium carbonates over the ceramic surface.
This journal is © The Royal Society of Chemistry 2016 |