Optimizing milling energy for enhancement of solid-state magnesium sulfate (MgSO4) thermal extraction for permanent CO2 storage

S. Atashin, J. Z. Wen* and R. A. Varin
Department of Mechanical and Mechatronics Engineering, University of Waterloo, 200 University Avenue West, Waterloo, Ontario N2L3G1, Canada. E-mail: john.wen@uwaterloo.ca

Received 13th May 2016 , Accepted 28th June 2016

First published on 30th June 2016


Abstract

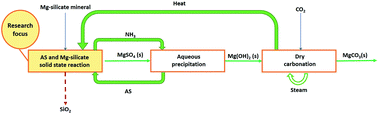
Mineral carbonation of Mg-silicates via the indirect-dry route is among the most appealing technical approaches for permanent CO2 storage. It brings about the possibility of recycling heat released during exothermic carbonation and it offers a higher rate of conversion through two separate stages: producing of reactive compounds, mainly Mg(OH)2, through solid reactions between Mg-silicates and ammonium sulfates and subsequent carbonation of reactive compounds. Milling is essential to enhance the solid-state reaction rate and increase the conversion percentage. The milling energy, being the major energy consumption of the entire carbonation process, needs to be minimized without sacrifice of its activation purpose. This study focuses on enhancing the kinetics of solid-state magnesium sulfate (MgSO4) thermal extraction from the solid–solid reaction of olivine ((Fe,Mg)2SiO4) and ammonium sulfate ((NH4)2SO4), with optimized milling energy input. This process constitutes the first stage of Mg(OH)2 production for indirect CO2 storage purposes. The mechanical activation of reactants via a high-energy magneto ball milling with a controlled energy input is achieved. The variation of structural parameters such as the particle size, specific surface area (SSA), pore volume, and crystallite size and strain are characterized as a function of milling energy input and the correlation between structural factors and activation energy of extraction is investigated. In addition, the variation in the apparent activation energy of solid-state extraction is examined as a function of milling energy. The optimal amount of milling energy input for increasing the reaction kinetics of MgSO4 extraction is estimated to be about 27.6 kJ g−1 which causes around 34% reduction in the activation energy of MgSO4 solid-state extraction.


1. Introduction

Global CO2 emission is a clear indicator of the world's fossil energy consumption and is known to have a great contribution to global warming.1–7 Mineral carbonation (MC) based carbon capture and sequestration (CCS) is viewed as the safest approach in order to reduce the level of atmospheric CO2 emission as an alternative to capture and store CO2 in geological formations. MC CCS offers the advantage of permanent CO2 storage in the form of thermodynamically stable and environmentally friendly carbonates,2–5 along with the exothermic nature and raw materials availability.6 This process could be considered as multipurpose carbonation approach, with the capability of both storing and utilizing CO2, where the carbonated materials could be utilized in latter applications such as construction building materials or as filler materials in paper and plastic products.8,9 However, MC demands a high level of costly energy consumption and suffers from a slow conversion rate.7,10

Much effort has been made in order to address the challenges in regard with the energy consumption and kinetics of the MC process. Enhancing the kinetics of MC has been investigated through mechanical activation.11–13 Haug et al.14,15 performed a comprehensive study on the effect of mechanical activation via wet/dry high energy ball milling in a planetary mill, in order to improve the Mg-extraction potential of olivine samples in an HCl solution and addressed the optimal amount of mechanical activation energy for the most enhanced rate of olivine dissolution. Chemical activation16 and thermal activation17,18 are of the other types of activation processes which have been shown to enhance the conversion rate of carbonation through the structural modification of raw materials. As an example, thermal activation of serpentine feedstock has been extensively investigated through the method called “Shell thermal activation”19,20 which includes heating up the serpentine feedstock for one hour at 650 °C, for the latter purpose of direct flue gas CO2 mineralization. The effect of thermal activation on the dissolution of serpentine in acidic medium has been evaluated by Hariharan et al.18

However, the activation process consumes extra energy and affects the energy balance of the entire carbonation process. The level of activation energy must be carefully considered and an optimized activation energy level should be sought.

The indirect dry carbonation approach has been comprehensively studied which brings the advantage of storing the energy released during exothermic process to compensate a portion of total energy of carbonation, including the activation stage and utilizing the enhanced kinetics of indirect carbonation process.7,21–23 Mg-silicate mineral carbonation proposed by Nduagu et al.24 is one of the most interesting and well referred indirect processes that is perceived as a closed loop, suitable for developing practical approaches of dry carbonation. The proposed carbonation approach, known as the ÅAU (Åbo Akademi University) process, includes extraction of magnesium hydroxide (Mg(OH)2) for the later carbonation process, through the reaction of ammonium sulfate ((NH4)2SO4) and Mg-silicate feedstock.10,25–27 Fig. 1 shows a schematic representation of the ÅAU carbonation process, including the dry solid-state magnesium sulfate (MgSO4) extraction, Mg(OH)2 precipitation and subsequent Mg(OH)2 dry carbonation.10,25–29


image file: c6ra12526c-f1.tif
Fig. 1 The ÅAU indirect carbonation approach, adapted from ref. 29. AS-ammonium sulfate ((NH4)2SO4); (s)-solid.

Eqn (1) presents the extraction reaction of MgSO4 from the mixture of solid (s) ammonium sulfate ((NH4)2SO4(s)) and solid olivine (Mg2SiO4(s)) powders. This reaction usually occurs at elevated temperatures.

 
Mg2SiO4(s) + 2(NH4)2SO4(s) → 2MgSO4(s) + SiO2(s) + 2H2O(g) + 4NH3(g) (1)

Solid-state (s) extraction of MgSO4 in eqn (1) is the rate limiting step in the process of Mg(OH)2 formation. In order to accelerate this process, the mixture of ammonium sulfate and olivine can be mechanically activated. The energy input for this activation, which should be minimized, corresponds to the optimal composition and microstructure of the ammonium sulfate and olivine mixture that results in the highest kinetics of MgSO4 extraction and, subsequently, the largest production rate of Mg(OH)2. This research is complementary to our previous study on mechanical activation of olivine powders for CO2 sequestration.30 As indicated in Fig. 1 the focus of this study is on optimizing the extraction of MgSO4 as expressed by eqn (1). The main objectives of this study are as follows:

(1) To find the effect of milling energy input on structural parameters of the milled powders and to estimate the optimal milling energy input that results in the most suitable crystal microstructure, which improves the kinetics of desired solid-state extraction process.

(2) To establish the optimal amount of milling energy for the enhancement of the kinetics of MgSO4 solid-state extraction as a part of the ÅAU carbonation process.

2. Experimental methods

Ammonium sulfate ((NH4)2SO4) powders (AX 1385-1; 99.0% assay), supplied by EMD Millipore, and olivine ((Fe,Mg)2SiO4) powders, supplied by READE Advanced Materials, China, were used in this research. The chemical composition of olivine mineral was investigated prior to mechanical activation using energy dispersive X-ray spectroscopy (EDS) with a Zeiss ULTRA Plus Scanning Electron Microscope equipped with a calibrated Pegasus 1200 EDS analyzer. The exact chemical formula olivine is (Mg1.842,Fe0.158)SiO4, showing an approximate combination of 92 mol% forsterite (Mg2SiO4) and 8 mol% fayalite (Fe2SiO4). Particle size distribution of olivine powders was obtained through the analysis of SEM images, using image processing software. SEM image containing about 100 particles has been considered in particle size calculation, which resulted in the a d50 size of 82 μm (average particle size of 92 ± 41 μm) as was also reported in ref. 30. The particle size value of ammonium sulfate sample powder was calculated with the same method, which comes to d50 of 111 μm (average particle size of 117 ± 22 μm).

Mechanical activation was performed using a high-energy magneto ball mill Uni-BallMill 5 (ref. 31–33) (manufactured by A.O.C. Scientific Engineering Pty Ltd., Australia). In this particular type of milling device, the milling modes with varying amount of milling energy are achieved using either one or two NdFeB magnets, as well as changing angular position and number of steel balls in the vial. All the experiments in this study were performed at the IMP68-4B setup representing impact mode using two magnets at 6 and 8 o'clock position. The working distance of six and eight o'clock magnets were 10 and 2 mm, respectively. All the milling runs were performed at approximately 200 rpm, by using four 25 mm steel balls of 65 g each and ball-to-powder mass ratio (BPR) of 50. The diameter and mass of vial was 75 mm and 4030 g respectively. The total amount of milling energy that is transferred to powders during ball milling process was calculated via Parviz and Varin model.34 In this model, the value of injected milling energy is formulated as a function of BPR, milling time, milling mode, working distance (WD), number of balls and position of magnets. The readers can be referred to the ref. 34 for more details. Varying milling times of 0, 30, 60, 90 and 120 min were applied with corresponding milling energy inputs of 0, 13.8, 27.6, 41.4 and 55.2 kJ g−1, respectively.

The SEM micrographs were obtained via the secondary electron detector of LEO 1550 Zeiss SEM at 10 kV. All the samples were coated with a thin gold layer via a UHV spotter system with current of 20 mA for 139 seconds, to provide a sufficient connectivity. SEM images were analyzed using Image J, version 1.47 V, developed at the National Institutes of Health, USA,35 for the particle size analysis.

X-ray diffraction was performed using INEL XRG 3000 Powder Diffractometer XRD device. X-ray patterns were collected using monochromic Cu Kα1 radiation with the wavelength of 0.15406 nm, generated by accelerating voltage of 30 kV and current of 30 mA. Specific surface area (SSA) and total pore volume of the powders were measured using a Micromeritics ASAP 2020 Accelerated Surface Area and Porositometry Analyzer through nitrogen adsorption at 77 K. XRD patterns were utilized to calculate both crystallite/grain size and structural strain parameters using Williamson–Hall method (eqn (2)),36 which considers both strain-induced and size-induced broadening.

 
B(2θ)cos(θ0) = (0.94λ/L) + 4e[thin space (1/6-em)]sin(θ0) (2)
where L is an average crystallite/nanograin size, e is crystal strain, θ is Bragg angle of (hkl) diffraction plane, B(2θ) is pure peak breadth obtained by full width at half-maximum intensity (FWHM) of a diffraction peak and λ is the wavelength of X-ray radiation.

Based on eqn (2) crystallite/nanograin size (L) and crystal strain (e) could be estimated from the intercept and slope of B(2θ)cos(θ0) vs. sin(θ0) graph, respectively. The 2θ peaks at 23.1, 36.1, 39.2 and 62.6° were used for calculation of crystallite size and crystallinity. For the sake of comparison, crystallite size was also calculated via Scherrer method using eqn (3) 36,37 for all 2θ peaks as shown above.

 
L = 0.98λ/(B(2θ) × cos(θ0)) (3)

Both SSA and pore volume parameters were measured via Brunauer–Emmett–Teller (BET) method.38 The total pore volume was estimated using single point adsorption model and it represents the total volume of pores with a width size below 1855.565 Å at P/P0 = 0.987323569 (P: partial vapor pressure of adsorbate gas; P0: standard pressure of adsorbate gas in equilibrium with the surface at boiling point of liquid nitrogen).

The process of solid-state extraction of MgSO4 from the mixture of olivine and ammonium sulfate was performed in a combined DSC/TGA thermal analyzer device (NETZSCH STA 449F3A-0918-M Jupiter), under argon atmosphere. An alumina crucible was used as a sample container. The molar ratio of olivine to ammonium sulfate in the mixture was adjusted based on the stoichiometric molar ratio of olivine to ammonium sulfate in eqn (1) i.e. 1 mol olivine to 2 moles ammonium sulfate (1 mol Mg[thin space (1/6-em)]:[thin space (1/6-em)]1 mol S), resulting in the olivine to ammonium sulfate mass ratio of about 0.55.

Isothermal conditions of 400, 425 and 450 °C were applied for the duration of 120 min, for calculation of apparent activation energy of solid-state extraction process (eqn (1)). The specimens were heated from room temperature to the desired extraction temperature with the heating rate of 10 deg min−1. Then, the samples were heated under constant temperatures of 400, 425 and 450 °C, for 120 min. The temperature values were selected based on the reported applicable temperature range for solid-state extraction of MgSO4 from the reaction of Mg-silicate and ammonium sulfate by Nduagu et al.25

In order to investigate the kinetics of solid-state MgSO4 extraction, the order of reaction (n) was evaluated using Johnson–Mehl–Avrami (JMAK) approach (eqn (4))32,39,40 which is reported to be able of characterizing the kinetics of solid-state reactions.39–41

 
ln(−ln(1 − α)) = n[thin space (1/6-em)]ln(t) + ln(k) (4)

The Arrhenius equation41,42 is applied (eqn (5)) to calculate the amount of activation energy of extraction process, based on the variation of kinetic constant (k) vs. temperature, during isothermal extraction reactions.

 
k = A[thin space (1/6-em)]exp(−EA/RT) (5)
where, k is the kinetic constant (s−1, for the first order reactions), EA is the apparent activation energy (J mol−1), A is the frequency factor (s−1, for first order reactions), R is the universal gas constant (J mol−1 K−1) and T is absolute temperature (K).

3. Results and discussion

3.1. Optimization of structural parameters via mechanical activation

The rate of solid-state extraction of MgSO4 from olivine ((Fe,Mg)2SiO4) and ammonium sulfate ((NH4)2SO4) expressed by eqn (1), is reported to be controlled by solid-state diffusion mechanism.27,28 Hence, the optimization of the most important diffusion controlling structural parameters, such as the particle, pore and crystallite size, specific surface area (SSA) and crystal strain, is implemented for the ultimate purpose of enhancing the rate of solid-state extraction process given by eqn (1). Issues related to the effect of mechanical activation on the structural parameters and the minimum amount of milling energy input for structural optimization are also addressed in this section.
3.1.1. The effect of milling energy input on particle size. Fig. 2a presents the SEM micrographs of the non-activated mechanically/unmilled ammonium sulfate ((NH4)2SO4) and olivine ((Fe,Mg)2SiO4) mixture. Fig. 2b shows the EDS elemental distribution of sulfur (S) and magnesium (Mg), as the indicators of the presence of ammonium sulfate and olivine, respectively. The elemental map in Fig. 2b corresponds to the SEM micrograph in Fig. 2a.
image file: c6ra12526c-f2.tif
Fig. 2 SEM micrographs of ammonia sulfate ((NH4)2SO4) and olivine mixtures. (a) Non activated/unmilled mixture and (b) EDS elemental distribution map of S and Mg as the indicators of the presence of (NH4)2SO4 and olivine, respectively. Mixtures after (c) 30 min of BM (13.8 kJ g−1), (d) 60 min of BM (27.6 kJ g−1), (e) 90 min of BM (41.4 kJ g−1) and (f) 120 min of BM (55.1 kJ g−1).

For particle size measurements three repeated runs were performed using an image processing software for SEM images. The average particle sizes along with the related error bar were estimated. The trend of average particle size variation vs. milling energy is presented as Fig. 3. The average particle size initially decreases to about 19 μm as a result of particle fracturing by injecting the milling energy of 27.6 kJ g−1 and then starts increasing, most likely, due to particle agglomeration. Considering the trend in Fig. 3, the milling energy of about 27.6 kJ g−1 (1 h) results in the minimum particle size, which is expected to enhance the kinetics of intra particle diffusion, for a solid-state extraction purpose.


image file: c6ra12526c-f3.tif
Fig. 3 Particle size variation as a function of milling energy input.
3.1.2. The effect of milling energy input on the specific surface area and pore volume. The trends of SSA and total pore volume vs. milling energy input are illustrated in Fig. 4. Both SSA and total pore volume increase as a function of milling energy input until they reach 27.6 kJ g−1. Comparing Fig. 3 and 4 it is apparent that injecting milling energy input up to 27.6 kJ g−1 results in the particle size reduction and an increase in SSA. The particle shape irregularities that are created during milling process, due to fracture, result in increased value of both SSA and the total pore volume. Above the milling energy input of 27.6 kJ g−1, particles get more compacted and consequently pore volume is reduced. No measurable change in SSA is observable for a milling energy input higher than 27.6 kJ g−1.
image file: c6ra12526c-f4.tif
Fig. 4 SSA and total pore volume variations as a function of milling energy input.
3.1.3. The effect of milling energy input on the crystallite/nanograin size and crystal strain. Fig. 5 shows the XRD patterns for the non-activated/unmilled and ball milled powder mixtures. The trends of crystallite size, calculated from both Williamson–Hall and Scherrer methods (eqn (2) and (3)), and crystal strain vs. milling energy input are plotted in Fig. 6. Both methods show the reduction in crystallite/nanograin size with increasing milling energy input until the value of energy input reaches 27.6 kJ g−1. In contrast, the crystal strain shows an opposite trend with increasing the milling energy. This general trend is related to the common influence of milling process on the crystallite/nanograin size refinement due to localized deformation phenomena. The detailed mechanism of this process is thoroughly discussed by Fecht et al.43,44 through a comprehensive TEM study of atomic structure variations during milling process. Based on his model, localized deformation in shear bands results in the formation of high density of dislocations in those bands. Based on the results on the stability of dislocations in olivine structure reported in ref. 45–47, under the applied conditions in this work, the dislocations are expected to be very stable. In addition, consequent annihilation and recombination of dislocations that are formed at the site of shear bands, result in the formation of sub-grain structure and crystallite size reduction.43,44,48–50 This mechanism is in a good agreement with the behavior of crystallite/nanograin size and crystal strain in Fig. 6 as a function of increasing milling energy input up to 27.6 kJ g−1.
image file: c6ra12526c-f5.tif
Fig. 5 XRD patterns of olivine and (NH4)2SO4 mixtures, ball milled with varying milling energy inputs.

image file: c6ra12526c-f6.tif
Fig. 6 Crystallite size (Scherrer and Williamson–Hall) and crystal strain variations as a function of milling energy input.

The slight increase of crystallite/nanograin size and decrease of crystal strain for milling energy inputs larger than 27.6 kJ g−1 in Fig. 6 could be attributed to the strain induced grain boundary (SIGB) migration phenomena, which usually results in the grain growth where the applied mechanical energy makes the dislocations aligned in a unique direction. The grain boundary migration leaves a low dislocation region behind the migrating boundaries, with a similar orientation to the old grain. At the same time, cancelation of opposite strain fields of annihilated dislocations during grain boundary alignment could be the reason of crystal strain reduction.51–53

3.2. The effect of mechanical activation on the apparent activation energy of extraction

The apparent activation energy of extraction process was estimated via the Arrhenius method, which gives the activation energy according to the temperature dependency of reaction rate. To calculate the amount of the apparent activation energy, the amount of mass variation vs. extraction time was recorded via TGA analysis, under three different pre-defined constant temperatures (400, 425 and 450 °C). Fig. 7 presents the TGA graphs for the non-activated/unmilled and activated ammonium sulfate/olivine mixtures under the applied isothermal extraction processes. With increasing temperature, the total mass of the sample decreases due to release of steam H2O, as shown in eqn (1).
image file: c6ra12526c-f7.tif
Fig. 7 TGA mass change vs. time graphs of extraction process. (a) Non activated/unmilled mixture; (b) mixtures after (b) 30 min of BM (13.8 kJ g−1); (c) 60 min of BM (27.6 kJ g−1); (d) 90 min of BM (41.4 kJ g−1) and (e) 120 min of BM (55.1 kJ g−1).

The trend of conversion factor of reaction vs. extraction time was calculated at each applied condition. For this purpose, TGA plots presented in Fig. 7 are converted to fraction transformed graphs by measuring the ratio of the actual mass loss at each time to the maximum mass loss, reached by the end of extraction reaction41,42 as shown in eqn (6).

 
α = (m0mt)/(m0mf) (6)
where m0 is the initial mass of tested specimen in TGA device, mt is the actual mass of specimen at time t and mf is the final mass of specimen.

The total mass loss, achieved at the end of each isothermal extraction process was assumed as 100% transformation (α = 1). Fig. 8 shows the JMAK plots of ln(−ln(1 − α)) vs. ln(t) at each temperature for the non-activated/unmilled and mechanically activated mixtures of ammonium sulfate and olivine through isokinetic region, which was used for calculation of reaction order (n), based on eqn (4). The rate determining kinetic mechanism and reaction rate function were estimated using the rate models which were chosen in accordance with the n values for the applied specific extraction conditions.39–41,54 All the values of n, recorded in Fig. 8, are close to unity which corresponds to the first order reaction. So, the mathematical model of reaction rate can be written as eqn (7)

 
ln(1 − α) = ktn (7)
where k is the kinetic constant and n is the reaction order.


image file: c6ra12526c-f8.tif
Fig. 8 JMAK graph of ln(−ln(1 − α)) vs. ln(t). (a) Non activated/unmilled mixture. Mixtures after (b) 30 min of BM (13.8 kJ g−1); (c) 60 min of BM (27.6 kJ g−1); (d) 90 min of BM (41.4 kJ g−1) and (e) 120 min of BM (55.1 kJ g−1).

Considering eqn (7), the value of the kinetic constant (k) at each temperature, was estimated from the intercept of ln(−ln(1 − α)) vs. ln(t) plots that are presented as Fig. 8.

The apparent activation energy of reaction was calculated from the slope of the ln(k) vs. 1000/RT plot,55 based on eqn (7). Fig. 9 presents the graphs of ln(k) vs. 1000/RT for extraction processes via non-activated/unmilled and mechanically activated mixtures. The mathematical equation of the best-fit line is also included in Fig. 9.


image file: c6ra12526c-f9.tif
Fig. 9 ln(k) vs. 1000/RT graph for the extraction process with the reactants that are activated with different levels of milling energy input, along with the equations of the best fit passing lines.

The trend of apparent activation energy of solid-state MgSO4 extraction as a function of applied milling energy is presented in Fig. 10. As can be clearly seen, the activation energy of extraction process decreases (about 34%) as the milling energy input increases until the energy level reaches 27.6 kJ g−1 and afterwards the apparent activation energy increases.


image file: c6ra12526c-f10.tif
Fig. 10 The apparent activation energy variation as a function of milling energy input.

In the same way, as discussed previously in Section 3.1, this amount of milling energy input (27.6 kJ g−1) creates the optimal structural parameters for diffusion kinetics enhancement. Thus, this value of milling energy input is the optimal level of milling energy, which can optimize the structural parameters with the purpose of enhancing of rate of solid-state diffusion process and the overall rate of solid-state extraction. For example, in regard with the particle size parameter, the milling energy input of around 27.6 kJ g−1 results in the minimum size of particles on the order of 19 μm. As the particle size decreases the diffusion length also decreases and consequently, it results in a higher rate of diffusion. With regard to the SSA and pore volume parameters, the minimum amount of milling energy input (27.6 kJ g−1) that corresponds to a minimum quantity of activation energy of extraction, results in the maximum SSA and total pore volume. The increment of both total pore volume and SSA is related to the particle shape irregularity, which can be varied during ball milling.

The irregular particles have both a larger SSA and a total volume of surface pores compared to the spherical particles, which provide the shorter diffusion length for enhancing the diffusion process. Finally, when it comes to the crystallite/nanograin size, the milling energy of 27.6 kJ g−1 results in the smallest crystallite/nanograin size for the investigated range of energy. The smaller crystallite/nanograin size provides the higher density of grain boundaries in the structure. Grain boundaries have a more open structure compared to the grain interior and facilitate the diffusion process by acting as short-circuit diffusion paths.56

In addition, because of the higher concentrations of structural defects at the grain boundaries, atomic migration occurs faster and the surface diffusivity (D) is higher, compared to the bulk of the grains. Therefore, the diffusion rate accelerates. The higher density of dislocations near the grain boundaries is the other reason of diffusion kinetics enhancement by decreasing the crystallite/nanograin size. Dislocation cores have a more open structure and the number of atomic bonds is lower at those sites. So, the vacancies can move more easily at the dislocation cores and enhance the kinetics of diffusion (concept of dislocation pipe diffusion).56,57

Considering all the factors that enhance the kinetics of diffusion in grain boundaries as compared to the grain interior, the effect of crystallite/nanograin size reduction on the optimization of diffusion controlled reaction rate is evident. So, the milling energy input of 27.6 kJ g−1 produces the minimum crystallite size and results in the most favorable microstructure for overall extraction rate improvement. Therefore, the milling energy input of 27.6 kJ g−1 is the optimal quantity of milling energy, which provides the optimal crystal microstructure for diffusion controlled extraction processes and the minimum apparent activation energy for the solid-state extraction in the ÅAU process.

Regarding the feasibility of mechanical activation process, it is important to be mentioned that, the reported milling energy in this study is mainly generated through the impact and shear energies between the balls and powders as is modelled and explained in ref. 34. Electrical energy is just utilized to provide the required rotational energy of milling device, which is about 0.09 kW h for the magneto-mill used in this research, based on the mill configurations and applied milling parameters, such as a rotational speed. Implementation of fossil fuel as an electricity generator, would produce about 0.045–0.09 kg CO2 in one-hour suggested milling time of this study (0.5–1 kg CO2 emission per kW h electricity generation by fossil fuel), depending upon the type of applied fossil fuel. This estimated amount of CO2 emission is insignificant and can not violate the feasibility of the process. Furthermore, the required electrical energy could be also supplied by other clean alternative sources such as hydro, hydrogen, solar and nuclear energy, rather than fossil fuel, to eliminate the extra CO2 emission during the electricity production.

To address the cost wise feasibility of the process, the price of electricity in Ontario, Canada (the geographical location where the research is performed) is taken into consideration, which is about 18 cents per kW h at peak rate. In this sense, the total cost of electricity production for 1 h milling in this research, would be about 1.6 cents, which seems to be both feasible and practical.

And finally, although, the consumed energy during pre-activation process, increases the overall amount of energy consumption in the mineral carbonation process, as is also addressed by Haug et al.,15 the latter enhancement in the rate of carbon sequestration would still remain as a great motivation for effective pre-activation researches.

4. Conclusions

In this study, we investigated the milling enhancement of the kinetics of MgSO4 extraction through the solid-state reaction of ammonium sulfate and olivine, based on the ÅAU carbonation route. The ultimate objective was to evaluate an optimal amount of required milling energy input to produce the most suitable crystal structure, in order to achieve the most enhanced reaction rate in extraction process. The following outcomes are summarized to address the objectives:

(1) The trend of structural parameters, including particle size, SSA, total pore volume, crystallite size and crystal strain, vs. milling energy input was investigated and the amount of optimal energy input to achieve the best combination of structural parameters for enhancing the rate of diffusion process as a rate limiting factor during the MgSO4 solid state extraction was evaluated.

(2) Activation energy of extraction process was evaluated via the Arrhenius method for all extraction processes, using non-activated/unmilled and activated batches of reactants. The activation of reactants (the ammonium sulfate and olivine mixture) with the milling energy input of about 27.6 kJ g−1 results in the lowest amount of activation energy for solid-state MgSO4 extraction. We have shown earlier30 that the controlling effect of milling energy on structural variations seem to be independent of the type of milling device. Considering this fact, the optimal quantity of milling energy input of 27.6 kJ g−1 is suggested to be applied for achieving the best kinetics of MgSO4 extraction from solid-state olivine and ammonium sulfate reaction. This optimal amount of milling energy input causes around 34% reduction in the activation energy of MgSO4 solid-state extraction.

Acknowledgements

The authors thank Carbon Management Canada and the Natural Sciences and Engineering Research Council of Canada for the research funding.

References

  1. J. G. J. Olivier, G. Janssens-Maenhout, M. Muntean and J. A. H. W. Peters, Trends in global CO2 emissions-2015 report, PBL Netherlands Environmental Assessment Agency, No:JRC98184, Netherland, 2015 Search PubMed.
  2. A. A. Olajire, A review of mineral carbonation technology in sequestration of CO2, J. Pet. Sci. Eng., 2013, 109, 364–392 CrossRef CAS.
  3. M. J. McKelvy, A. V. G. Chizmeshya, J. Diefenbacher, H. Béarat and G. Wolf, Exploration of the role of heat activation in enhancing serpentine carbon sequestration reactions, Environ. Sci. Technol., 2004, 38, 6897–6903 CrossRef CAS PubMed.
  4. S. A. Bea, S. A. Wilson, K. U. Mayer, G. M. Dipple, I. M. Power and P. Gamazo, Reactive transport modeling of natural carbon sequestration in ultramafic mine tailings, Vadose Zone J., 2011, 11, 29–45 Search PubMed.
  5. S. R. Gislason, D. Wolff-Boenisch, A. Stefansson, E. H. Oelkers, E. Gunnlaugsson, H. Sigurdardottir, B. Sigfusson, W. S. Broecker, J. M. Matter, M. Stute and G. Axelsson, Mineral sequestration of carbon dioxide in basalt: A pre-injection overview of the CarbFix project, Int. J. Greenhouse Gas Control, 2010, 4, 537–545 CrossRef CAS.
  6. M. Werner, M. Verduyn, G. van Mossel and M. Mazzotti, Direct flue gas CO2 mineralization using activated serpentine: Exploring the reaction kinetics by experiments and population balance modelling, Energy Procedia, 2011, 4, 2043–2049 CrossRef CAS.
  7. D. C. Carnevale, Carbon sequestration potential of the coast range ophliolite in California, in Environmental and Earth Sciences, University of Rhodeisland, USA, 2013 Search PubMed.
  8. CO2 utilization focus area, US Department of Energy, http://www.netl.doe.gov/research/coal/carbon-storage/research-and-development/co2-utilization, accessed May 8, 2016.
  9. R. M. Cuéllar-Franca and A. Azapagic, Carbon capture, storage and utilisation technologies: A critical analysis and comparison of their life cycle environmental impacts, J. CO2 Util., 2015, 9, 85–102 Search PubMed.
  10. E. Nduagu, J. Bergerson and R. Zevenhoven, Life cycle assessment of CO2 sequestration in magnesium silicate rock-A comparative study, Energy Convers. Manage., 2012, 55, 116–126 CrossRef CAS.
  11. H. Geerlings and R. Zevenhoven, CO2 mineralization-bridge between storage and utilization of CO2, Annu. Rev. Chem. Biomol. Eng., 2013, 103, 103–117 CrossRef PubMed.
  12. R. Zevenhoven, J. Fagerlund and J. K. Songok, CO2 mineral sequestration: developments toward large-scale 2 application, Greenhouse Gases: Sci. Technol., 2011, 1, 48–57 CrossRef CAS.
  13. D. Daval, O. Sissmann, N. Menguy, G. D. Saldi, F. Guyot, I. Martinez, J. Corvisier, B. Garcia, I. Machouk, K. G. Knauss and R. Hellmann, Influence of amorphous silica layer formation on the dissolution rate of olivine at 90 °C and elevated pCO2, Chem. Geol., 2011, 284, 193–209 CrossRef CAS.
  14. T. A. Haug, Dissolution and carbonation of mechanically activated olivine- Investigating CO2 sequestration possibilities, Ph.D. Dissertation, Faculty of Engineering Science and Technology, Department of Geology and Mineral Resources Engineering, Norwegian University of Science and Technology, Trondheim, Norway, 2010.
  15. T. A. Haug, R. A. Kleiv and I. A. Munz, Investigating dissolution of mechanically activated olivine for carbonation purposes, Appl. Geochem., 2010, 25, 1547–1563 CrossRef CAS.
  16. J. D. Rimstidt, S. L. Brantley and A. A. Olsen, Systematic review of forsterite dissolution rate data, Geochim. Cosmochim. Acta, 2012, 99, 159–178 CrossRef CAS.
  17. W. J. J. Huijgen and R. N. J. Comans, Carbon dioxide sequestration by mineral carbonation, Literature review, ECN-Clean Fossil Fuels Environmental Risk Assessment, 2003 Search PubMed.
  18. S. B. Hariharan, M. Werner, D. Zingaretti, R. Baciocchi and M. Mazzotti, Dissolution of activated serpentine for direct flue-gas mineralization, Energy Procedia, 2013, 37, 5938–5944 CrossRef CAS.
  19. M. Verduyn, H. Geerlings, G. v. Mossel and S. Vijayakumari, Review of various CO2 mineralization product forms, Energy Procedia, 2011, 4, 2885–2892 CrossRef.
  20. A. Sanna, M. Uibu, G. Caramanna, R. Kuusik and M. M. Maroto-Valer, A review of mineral carbonation technologies to sequester CO2, Chem. Soc. Rev., 2014, 43, 8049–8080 RSC.
  21. S. M. Al-Fattah, M. F. Barghouty, G. Bureau, B. O. Dabbousi, S. Fillacier, P. L. Thiez, C. McQuale, G. Munier and J. R. Andot, Carbon capture and storage, Technologies, policies, economics and implementation strategies, CRC Press, Netherlands, 2012 Search PubMed.
  22. A. P. Gysi and A. Stefánsson, Mineralogical aspects of CO2 sequestration during hydrothermal basalt alteration—An experimental study at 75 to 250 °C and elevated pCO2, Chem. Geol., 2012, 306–307, 146–159 CrossRef CAS.
  23. R. Van Noort, C. J. Spiers, M. R. Drury and M. T. Kandianis, Peridotite dissolution and carbonation rates at fracture surfaces under conditions relevant for in situ mineralization of CO2, Geochim. Cosmochim. Acta, 2013, 106, 1–24 CrossRef CAS.
  24. E. Nduagu, in Mineral carbonation: preparation of magnesium hydroxide (Mg(OH)2) from serpentinite rock, Åbo Akademi University, Finland, 2008 Search PubMed.
  25. E. I. Nduagu, J. Highfield, J. Chen and R. Zevenhoven, Mechanisms of serpentine – ammonium sulfate reactions: Toward higher efficiencies in flux recovery and Mg extraction for CO2 mineral sequestration, RSC Adv., 2014, 4, 64494–64505 RSC.
  26. E. Nduagu, I. Romao, J. Fagerlund and R. Zevenhoven, Performance assessment of producing Mg(OH)2 for CO2 mineral sequestration, Appl. Energy, 2013, 106, 116–126 CrossRef CAS.
  27. E. Nduagu, T. Bjorklof, J. Fagerlund, E. Makila, J. Salonen, H. Geerlings and R. Zevenhoven, Production of Magnesium hydroxide from magnesium silicate for the purpose of CO2 mineralization-Part 2: Mg extraction modeling and application to different Mg silicate rocks, Miner. Eng., 2012, 30, 87–94 CrossRef CAS.
  28. E. Nduagu, Production of Mg(OH)2 from Mg-silicate rock for CO2 mineral sequestration, Ph.D. Dissertation, Thermal and Flow Engineering Laboratory, Department of Chemical Engineering, Division for Natural Sciences and Technology, Åbo Akademi University, Turku, Finland 2012.
  29. J. Highfield, H. Lim, J. Fagerlund and R. Zevenhoven, Activation of serpentine for CO2 mineralization by flux extraction of soluble magnesium salts using ammonium sulfate, RSC Adv., 2012, 2, 6535–6541 RSC.
  30. S. Atashin, J. Z. Wen and R. A. Varin, Investigation of milling energy input on structural variations of processed olivine powders for CO2 sequestration, J. Alloys Compd., 2015, 618, 555–561 CrossRef CAS.
  31. A. Calka and A. P. Radlinski, Universal high performance ball-milling device and its application for mechanical alloying, Mater. Sci. Eng., A, 1991, 134, 1350–1353 CrossRef.
  32. A. R. Varin, T. Czujko and Z. S. Wronski, Nanomaterials for solid state hydrogen storage, Springer Science and Business Media, New York, USA, 2009 Search PubMed.
  33. B. W. Ninham and A. Calka, Patent: U.W0910, CA2066740, EP0494899, AU643949, 1991.
  34. R. Parviz and R. A. Varin, Combined effects of molar ratio and ball milling energy on the phase transformations and mechanical dehydrogenation in the lithium amide–magnesium hydride (LiNH2 + nMgH2)(n = 0.5–2.0) nanocomposites, Int. J. Hydrogen Energy, 2013, 38, 8313–8327 CrossRef CAS.
  35. Materials Data Inc, http://www.materialsdata.com/, Accessed October 31, 2014.
  36. R. A. Varin, J. Bystrzycki and A. Calka, Effect of annealing on the microstructure, ordering and microhardness of ball milled cubic (L12) titanium trialuminide intermetallic powder, Intermetallics, 1999, 7, 785–796 CrossRef CAS.
  37. H. P. Klug and L. Alexander, X-Ray diffraction procedures for polycrystalline and amorphous materials, John Wiley & Sons, New York, 1974 Search PubMed.
  38. S. Lowell, J. E. Shields, M. Thomas and F. Thommes, Characterization of porous solids and powders: Surface area, pore size and density, Kluwer Academic Publishers, USA, 2004 Search PubMed.
  39. J. M. Criado, A. Ortega, C. Real and E. Torres De Torres, Re-examination of the kinetics of the thermal dehydroxilation of kaolinite, Clay Miner., 1984, 19, 653–661 CAS.
  40. J. D. Hancock and J. H. Sharp, Method of comparing solid-state kinetic data and its application to the decomposition of kaolinite, J. Am. Ceram. Soc., 1972, 55, 74–77 CrossRef CAS.
  41. S. A. T. Redfern, The kinetics of dehydroxilation of kaolinite, Clay Miner., 1987, 22, 447–456 CAS.
  42. J. M. Saniger and H. Hu, Kinetic studies of the dehydration process for polyacrylic acid–metal oxide compounds, Mater. Lett., 1992, 15, 113–117 CrossRef CAS.
  43. H. J. Fecht, E. Hellstern, Z. Fu and W. L. Johnson, Nanocrystalline Metals Prepared by High-Energy Ball Milling, Metall. Trans. A, 1990, 21, 2333–2337 CrossRef.
  44. L. O. k. Carl Koch, M. Seal and S. Veprek, Structural nanocrystalline materials: Fundamentals and applications, Cambridge University Press, UK, 2007 Search PubMed.
  45. Q. Bai and D. L. Kohlstedt, High-temperature dislocation creep of olivine single crystals, 2. Dislocation structures, Tectonophysics, 1992, 206, 1–29 CrossRef CAS.
  46. S. Karato and M. Ogawa, High-pressure recovery of olivine: implications for creep mechanisms and creep activation volume, Phys. Earth Planet. Inter., 1982, 28, 102–117 CrossRef CAS.
  47. R. J. M. Farla, H. Kokkonen, J. D. Fitz Gerald, A. Barnhoorn, U. H. Faul and I. Jackson, Dislocation recovery in fine-grained polycrystalline olivine, Phys. Chem. Miner., 2010, 38, 363–377 CrossRef.
  48. M. R. Drury and J. L. Urai, Deformation-related recrystallization processes, Tectonophysics, 1990, 112, 235–253 CrossRef.
  49. B. K. Vainshtein, V. M. Friedkin and V. L. Indenbom, Structure of crystals, Springer, Russia, 1995 Search PubMed.
  50. J. R. Groza and J. F. Shackelford, Materials processing handbook, CRC Press, USA, 2007 Search PubMed.
  51. G. A. A. Paggi and R. Donnini, Strain induced grain boundary migration effects on grain growth of an austenitic stainless steel during static and metadynamic recrystallization, Mater. Charact., 2015, 107, 174–181 CrossRef.
  52. N. Bozzolo, A. Agnoli, N. Souai, M. Bernacki and R. E. Loge, Strain induced abnormal grain growth in nickel base superalloys, in 5th International Conference on Recrystallization and Grain Growth, Sydney, Australia, 2013, pp. 321–324 Search PubMed.
  53. R. Abbaschian, L. Abbaschian and R. E. Reed-Hill, Physical metallurgy principles, CENGAGE, Stanford, USA, 4th edn, 2009 Search PubMed.
  54. A. Khawam and D. R. Flanagan, Solid-State Kinetic Models: Basics and Mathematical Fundamentals, J. Phys. Chem. B, 2006, 110, 17315–17328 CrossRef CAS PubMed.
  55. R. R. Chromik, W. K. Neils and E. J. Cotts, Thermodynamic and kinetic study of solid state reaction in the Cu–Si system, J. Appl. Phys., 1999, 86, 4273–4281 CrossRef CAS.
  56. I. A. Ovid'ko and A. B. ReÏzis, Grain-boundary dislocation climb and diffusion in nanocrystalline solids, Phys. Solid State, 2001, 43, 35–38 CrossRef.
  57. M. Hirscher, Handbook of hydrogen storage: New materials for future energy storage, Wiley-VCH, Stuttgart, Germany, 2010 Search PubMed.

This journal is © The Royal Society of Chemistry 2016
Click here to see how this site uses Cookies. View our privacy policy here.