A ZnO–CNT nanocomposite based electrochemical DNA biosensor for meningitis detection
Manvi Taka,
Vinay Guptaa and
Monika Tomar*b
aDepartment of Physics and Astrophysics, University of Delhi, Delhi 110007, India
bDepartment of Physics, Miranda House, University of Delhi, Delhi 110007, India. E-mail: monikatomar@gmail.com; Tel: +91 9871346452
First published on 8th August 2016
Abstract
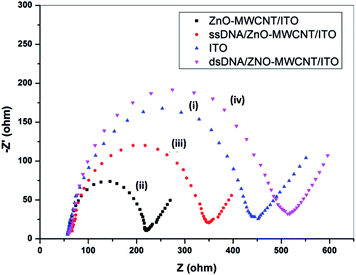
A zinc oxide (ZnO) and multiwalled carbon nanotube (CNT) based nanocomposite matrix has been fabricated onto indium tin oxide (ITO) coated glass (ITO/glass) platform via. A chemical route. The thiolated oligonucleotides probe sequence consisting of 23 bases (single-stranded DNA) has been immobilized onto the ZnO–CNT/ITO electrode using a physical adsorption technique. The fabricated bioelectrode (ssDNA/ZnO–CNT/ITO) is used to specifically detect N. meningitidis with a high sensitivity of 20.20 μA per decade and 45 s of hybridization time by differential pulse voltammetry (DPV) using methylene blue as an electroactive indicator. The prepared DNA biosensor exhibits linearity in a wide range (5–180 ng μl−1). The electrochemical impedance response behaviour of the ssDNA/ZnO–CNT/ITO bioelectrode with an increase in the target DNA concentration has also been studied using [Fe(CN)6]3−/4− as the hybridization indicator. The results indicate the possibility of fabricating a handheld device for meningitis detection at an early stage.
1. Introduction
Meningitis is an inflammation of the membranes covering the brain and spinal cord, called the meninges. It is caused when germs infect the cerebral spinal fluid (CSF) that circulates around the brain and spinal cord. The infection can be caused by three kinds of germs namely virus, bacteria and fungus. Viral meningitis is the most common and the least severe type. Almost all patients suffering from viral meningitis, recover without any permanent damage, although full recovery might sometimes take many weeks. Bacterial meningitis is more aggressive and can lead to permanent damage or death in extreme cases. It is fatal in around 50% of cases if untreated, and accounts for several deaths globally each year.1 The other causes is Fungal meningitis, which causes severe infections but occurs less frequently than viral or bacterial meningitis.Meningitis can develop quickly, over a matter of hours. Until the cause of meningitis has been established, it should be regarded as a medical emergency requiring prompt diagnosis and urgent treatment. Meningitis diagnosis is carried out using a very popular technique called lumbar puncture (spinal tap). It involves inserting a needle into the middle of the lower back and collecting some drops of spinal fluid. The spinal fluid is then subjected to biochemical analysis to find out if there is any change in white blood cells count, sugar level or proteins. The fluid is stained using Gram staining2,3 and also, bacteria obtained from these cerebral spinal fluid (CSF) samples can be grown on suitable culture medium which will confirm if the meninges are infected.4 Blood cultures are also used for carrying out diagnosis of this life-threatening disease. These tests are time consuming as well as very expensive. Certain imaging tests such as X-rays, CT scan, MRI and ultrasound are also employed to reveal any swelling or inflammation in different areas of body such as brain, chest or spinal cord but does not provide any confirmatory results that the infection is associated with meningitis.5 Latex agglutination test, immunological test, biochemical test and PCR are some other tests which are also used.6–17 It can be seen that these tests involve utilization of costly machines, well trained manpower and are time consuming and they sometimes give non-confirmatory results.
Recently, nucleic acid biosensors based on electrochemical technique have emerged as a promising alternative as they offer fast, cost-effective, and simple detection.18–20 Hence, an electrochemical DNA hybridization biosensor with low detection limit and high sensitivity is desired for specific DNA sequence detection.21–23 In the recent past there have been few reports on detection of Neisseria meningitidis (N. meningitidis) using electrochemical DNA sensor.1 Patel et al. have utilized gold surface to immobilize thiolated probe DNA. Though chemical bonding of the thiol group of DNA probe with gold was utilized to the immobilize DNA probe onto a gold surface by self-assembly but for further improving its sensitivity and selectivity, an immobilization platform which offers high adsorption ability, fast electron communication feature along with biocompatibility for higher stability of the biosensor is required.
Metal oxide thin films and nanostructures are known to have unique ability to promote faster electron transfer kinetics and offer excellent biosensing response characteristics towards a number of biomolecules. Among the metal oxides, nanostructured zinc oxide (ZnO) attained technological importance for biosensors because of its biocompatible properties including high catalytic efficiency, electron transfer characteristics, high chemical stability, high isoelectric point (∼9.5) and strong adsorption ability etc.24 The high isoelectric point (IEP) of ZnO provides a platform to immobilize DNA having low isoelectric point (∼) through electrostatic interaction. Several reports are available in literature using ZnO for biosensing purposes like, Satriano et al. has reported utilization of ultrathin and nanostructured ZnO-based films for fluorescence biosensing; Khun et al. has utilized ZnO nanorods and thin films for biosensing applications and ZnO/chitosan hybrid nanostructure based biosensor was developed by Zhao et al.25–27 All the above mentioned reports showed good biosensing results but in order to further improve the performance of a biosensor we need to incorporate some modifications into the matrix which helps in enhancing the biosensing characteristics. Recently, multiwalled carbon nanotubes (CNT), have attracted much attention for biosensors due to their unique structure, mechanical, electrical and thermal properties.28–35 A number of reports are available on incorporating MWCNT for biosensing exhibiting excellent properties though stability and shelf-life are some of the issues.36–38 The amalgamation of MWCNT with metal oxide (ZnO in the present case) can be an attractive route to obtain electronic properties based on morphological modification and electronic interactions between the two components which has not yet been much explored. Hence, ZnO–CNT based matrix has been fabricated in the present work using chemical route. The DNA probes for meningitis detection have been immobilized on the fabricated matrix by physical technique and the bioelectrode has been utilized for efficient detection of complementary N. meningitis DNA.
2. Experimental
2.1. Chemicals and reagents
N. meningitidis oligonucleotides probes, zinc acetate dihydrate (C6H6O4Zn·2H2O, 99.0%) and Triton X-100 are procured from Sigma-Aldrich (USA). Ammonia solution (min 25% GR) was obtained from Merck India Pvt. Ltd., India. Multiwalled carbon nanotubes (MWCNT, diameter 20–40 nm) are procured from Shenzhen Nanotech port Co., Ltd. Sodium phosphate monobasic anhydrous and sodium phosphate dibasic dihydrate, Tris buffer, ethylene diamine tetra acetic acid (EDTA) are obtained from Sisco chemical, India. All chemicals were used without further purification. 50 mM phosphate buffer saline (PBS), pH 7.0 (0.9% NaCl) solution is prepared by adjusting the proportion of monobasic sodium phosphate and dibasic sodium phosphate solution and then adding 0.9% NaCl to the solution. Deionized water (resistance ∼ 18.2 MΩ cm) is used for the preparation of aqueous solutions. All oligonucleotides solutions of varying concentrations are prepared in Tris–EDTA (TE) buffer (10 mM Tris, pH 8.0, 1 mM EDTA). All the oligonucleotide sequences used in the present work procured from Sigma-Aldrich and have been used as it is, without any further purifications or chemical treatment.The various sequences of DNA oligomers used for carrying out electrochemical studies for DNA hybridization detection are tabulated below (Table 1):
| Probe DNA | 5′-HS-GATACGAATGTGCAGCTGACACG-3′ |
| Complementary target | 3′-CTATGCTTACACGTCGACTGTGC-5′ |
| Non-complementary target | 3′-CTTAGCAAACTGGTGCACACACG-5′ |
2.2. Preparation of ZnO–CNT (ZnO–CNT/ITO) electrode
The multiwalled carbon nanotubes (CNT) were functionalized by refluxing them in 1![[thin space (1/6-em)]](https://www.rsc.org/images/entities/char_2009.gif) :
:![[thin space (1/6-em)]](https://www.rsc.org/images/entities/char_2009.gif) 3 v/v mixture of sulphuric acid (10 ml, 95–97%) and nitric acid (30 ml, 65%) followed by washing with deionized water until the pH of the solution became approximately 7.0 and then finally dried in oven at 60 °C.
3 v/v mixture of sulphuric acid (10 ml, 95–97%) and nitric acid (30 ml, 65%) followed by washing with deionized water until the pH of the solution became approximately 7.0 and then finally dried in oven at 60 °C.
0.455 M zinc acetate solution is prepared in distilled de-ionized water (D.I.) at room temperature. Ammonia solution (25%) was added dropwise to the above solution while constant stirring leading to the formation of milky white precipitate (pH = 9–10). After continuous stirring for 4–5 hours at room temperature, wash the precipitates well with D.I. water until neutral pH = 7.0 was obtained. Subsequently, 1 M dilute HNO3 was added yielding a transparent solution (pH = 1). Functionalized CNTs (0.1 wt%) were added to the transparent sol and then ultrasonicated for 3 hours. The concentration of CNTs was decided based on our earlier work where 0.1 wt% CNTs in ZnO are found to be exhibiting efficient redox properties without being leached out. Ultrasonication of the ZnO–CNT composite solution for 1 hour and 2 hours was also done, however, after some time, the CNTs settled down at the bottom of the beaker containing composite solution resulting in the non-homogeneous solution which could not be used for film preparation. But, ultrasonication of the solution for 3 hours or higher resulted in formation of homogeneous solution of ZnO–CNT in which CNTs were uniformly dispersed. The solution thus obtained was spin coated on the ITO coated glass (ITO/glass) platform. Prior to spin coating, ITO coated glass was precleaned. In order to achieve uniform coating a surfactant Triton X-100 was also added to the prepared composite solution. The film so formed was pyrolysed for 10 minutes at 300 °C. The process was repeated several times for getting desired thickness. Finally, the prepared films were annealed at 300 °C for 3 hours in atmospheric air.
2.3. Fabrication of DNA biosensor
Prior to immobilization of single stranded DNA probe (ssDNA), the ZnO–CNT/ITO electrode was washed with D.I. water followed by drying at room temperature. 10 μl of DNA probe solution (ssDNA, 5 ng/10 μl) prepared in TE buffer solution (10 mM Tris, pH 8.0, 1 mM EDTA) was immobilized onto ZnO–CNT/ITO electrode and kept in a humid chamber for about 3 h at 25 °C. The unbound probe was removed by several washings with TE buffer and dried. These ssDNA/ZnO–CNT/ITO bioelectrodes were incubated with complementary and non-complementary target solutions in particular concentrations for 45 s at 25 °C for DNA hybridization reaction to occur. After hybridization the double stranded DNA (dsDNA) containing bioelectrode was again washed several times with buffer to remove the unbound ssDNA. The schematic of immobilization of probe and hybridization with target DNA has been shown in Scheme 1. | ||
| Scheme 1 Schematic representation of SH labeled probe immobilized on ZnO–CNT/ITO electrode and hybridization of complementary DNA with immobilized probe. | ||
2.4. Experimental characterizations
The structural properties of ZnO–CNT films were studied using X-ray diffraction (XRD) [Bruker D8 Discover]. The Surface morphology of the ZnO–CNT/ITO electrode and ssDNA/ZnO–CNT/ITO bioelectrode was studied using scanning electron microscopy (SEM) [Quanta FEI 200]. Transmission electron microscope (TEM) [TECHNAI G2 T30, u-TWIN] was employed to characterize the prepared ZnO–CNT nanocomposite solution. Cyclic voltammetric (CV) measurements were carried out on a potentiostat/galvanostat [Gamry Inc. reference 600] using a three-electrode system in PBS solution (50 mM, pH 7.0, 0.9% NaCl) containing 5 mM [Fe(CN)6]3−/4− with Ag/AgCl as the reference electrode. The hybridization studies of ssDNA/ZnO–CNT/ITO bioelectrode were carried out using Differential Pulse Voltammetry (DPV) studies in phosphate buffer saline (PBS, 0.05 M, pH 7.0, 0.9% NaCl) solution containing methylene blue as hybridization indicator (20 μM) for given concentration of target DNA.3. Results and discussion
3.1. Transmission electron microscopy (TEM) studies
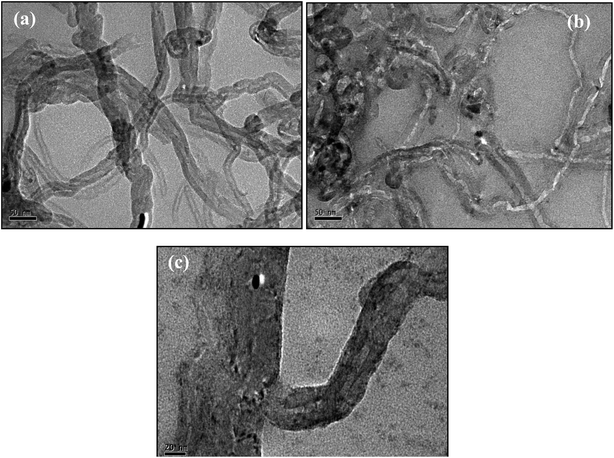
The transmission electron microscopy (TEM) has been adopted to characterize non-functionalized CNTs and a nanocomposite of functionalized CNTs co-existing with ZnO solution. TEM images of non-functionalized CNTs as shown in Fig. 1(a) indicates nanotubes of about 20 to 40 nm average diameter. In the nanocomposite of ZnO–CNT (Fig. 1(b)), it can be clearly seen that the inner walls are present in CNTs of 10 nm diameter. After functionalization decreased weight (loss of carbon content) of the CNTs is visible form TEM image indicating better hydrophilicity.39 From TEM images of the ZnO–CNT nanocomposite (Fig. 1(b)), it appears that ZnO is attached non-uniformly onto the surface of the nanotubes at different places along its length. Furthermore, ZnO particles inside the tubes can also be seen in the TEM image of higher magnification (Fig. 1(c)). It can be clearly seen from this image that some black colour material (ZnO) is deposited onto the walls of the CNTs along its length. The mechanism for the formation of ZnO which is deposited on the CNTs is as follows:40| NH3 + H2O ↔ NH4+ + OH− | (1) |
| Zn2+ + NH3 → Zn(NH3)42+ | (2) |
| Zn(NH3)42+ + OH− → ZnO | (3) |
| Zn2+ + OH− → Zn(OH)42+ | (4) |
| Zn(OH)42+ → ZnO | (5) |
3.2. XRD studies
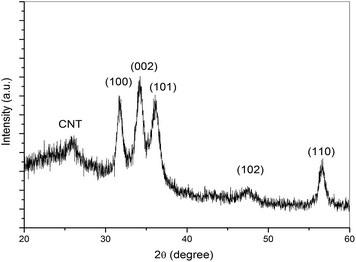
Fig. 2 shows the XRD spectra of ZnO–CNT nanocomposite thin film. The reflections from (100), (002), (101), (102) and (110) crystal planes of ZnO (Fig. 2) have been indexed under JCPDS card no. 36-1451 and corresponds to the formation of hexagonal wurtzite structure of ZnO and shows the polycrystalline nature of the deposited films. A small diffraction peak at 2θ ∼ 26° is also observed which corresponds to the (002) reflection from the graphitic planes of CNTs. The intensity of the diffraction peak is weak due to the very small concentration of multiwalled carbon nanotubes into ZnO. Similar XRD curves have been reported by Chen et al., also for the ZnO–CNT thin films grown by chemical route.41 The average crystallite size of ZnO in ZnO–CNT nanocomposite corresponding to (002) crystallite planes has been estimated to be 7 nm using Scherrer formula.423.3. Scanning electron microscopy (SEM) studies
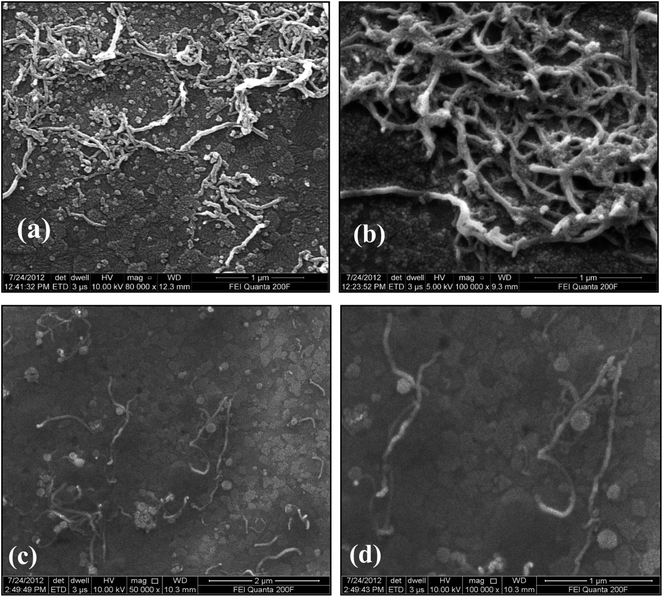
Surface morphology of the ZnO–CNT/ITO and ssDNA/ZnO–CNT/ITO electrodes was studied using scanning electron microscope (SEM) and the results are shown in Fig. 3. The SEM images of ZnO–CNT/ITO electrode clearly indicate the clusters of CNTs and ZnO particles having nanostructured and highly porous surface (Fig. 3(a) and (b)). However, after immobilization of ssDNA on ZnO–CNT/ITO electrode, the surface morphology changes and becomes denser (Fig. 3(c) and (d)). This is attributed to the immobilization of thiolated DNA molecules present onto ZnO–CNT/ITO electrode.3.4. Electrochemical studies
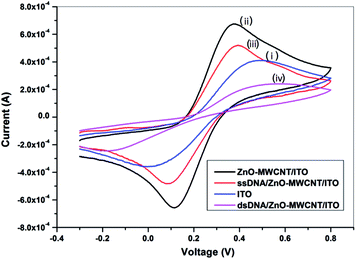
3.5. Biosensor response studies
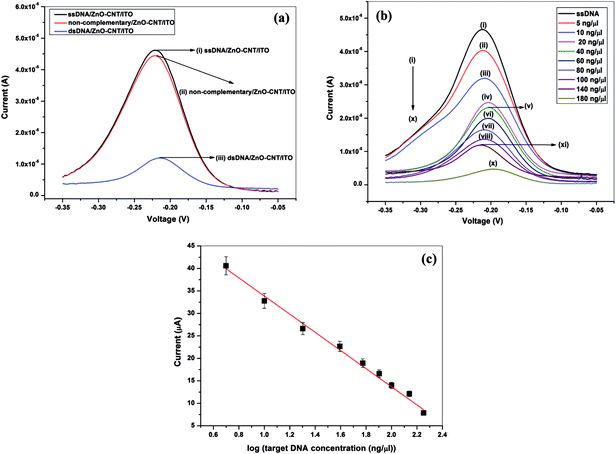
On the contrary, when complementary DNA comes in contact with the ssDNA, duplex formation takes place, reducing the free guanine bases and hence drastically reduce the peak current to 120 μA (Fig. 6(a)). The results indicate the specificity of the prepared bioelectrode (ssDNA/ZnO–CNT/ITO) towards complementary DNA only.
Fig. 6(b) shows the DPV response studies of ssDNA/ZnO–CNT/ITO bioelectrode after hybridization with different concentrations of target DNA of N. meningitidis varying from 5 ng μl−1 to 180 ng μl−1. It can be seen that the DPV peak current obtained for ssDNA/ZnO–CNT/ITO bioelectrode decreases with an increase in the target DNA concentration. As the concentration of target DNA increases, the number of the duplexes formed at the surface of the bioelectrode also increases leading to continuously decreasing free guanine bases and as a result peak current in DPV decreases. The magnitude of the peak DPV current obtained is plotted against the corresponding logarithmic concentration value of the complementary target sequence hybridized with the DNA bioelectrode (ssDNA/ZnO–CNT/ITO) in the range 5 ng μl−1 to 180 ng μl−1 and is found to exhibit good linearity.
Detection limit of the ssDNA/ZnO–CNT/ITO bioelectrode is found to be 5 ng μl−1 as for concentrations lower than this no decrease in DPV current has been observed indicating that no significant hybridization takes place. It is found that 45 s is the minimum required hybridization time for the given reaction to take place. Sensitivity of the ssDNA/ZnO–CNT/ITO bioelectrode towards target DNA is calculated from the linearity curve and is found to be 20.20 μA per decade along with wide linear range (5–180 ng μl−1), indicating that the ZnO–CNT nanocomposite based matrix has significantly enhanced the performance of nucleic acid biosensor the sensitivity of the biosensor is found to be much superior to already reported value for meningitis detection using metal/metal oxide based matrices.1 This is attributed to the high surface provided by the nanocomposite matrix to the probe DNA loading and efficient electron communication feature of the prepared matrix. The ss DNA/ZnO–CNT/ITO electrode is found to be giving similar results within ±5% for about 20 weeks when stored at 4 °C indicating high stability of the prepared bioelectrode. Reusability of the ssDNA/ZnO–CNT/ITO bioelectrode has been estimated by dipping dsDNA/ZnO–CNT/ITO electrode in hot water (80 °C) for 5 minutes followed by cooling in an ice bath and then washing with double deionized water (DDI) prior to reuse. The DPV response obtained for the regenerated bioelectrode showed almost similar magnitude of the peak current as that obtained for the ssDNA/ZnO–CNT/ITO prepared bioelectrode prior to hybridization thus ensuring good reusability of the ZnO–CNT nanocomposite based bioelectrode. The ZnO–CNT nanocomposite based provides desirable platform for single stranded probe DNA to immobilize with better orientation thus, giving good stability and improved electron transfer kinetics between the electrolyte and electrode. Table 3 compares the presently fabricated ZnO–CNT based DNA biosensor with earlier reported meningitis detection based DNA biosensors which highlights the importance of the present work.
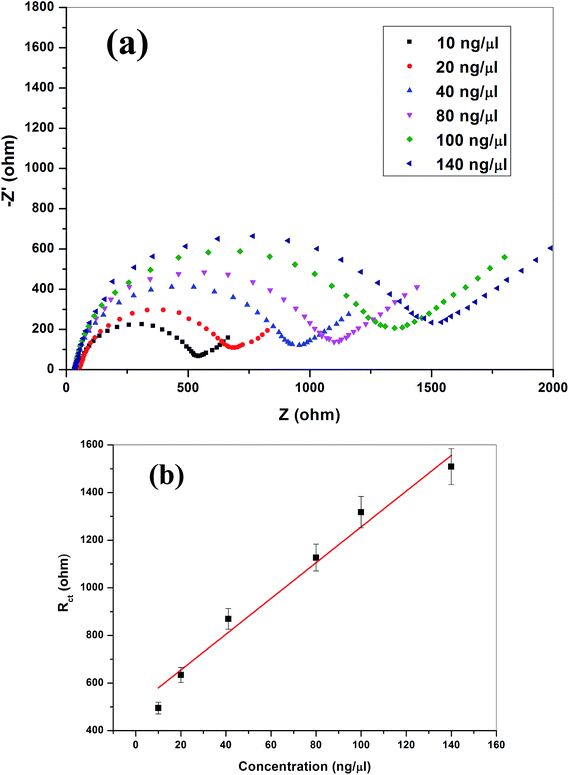
| Target DNA concentration (ng μl−1) | 10 | 20 | 40 | 80 | 100 | 140 |
| Surface concentration θ | 0.42 | 0.54 | 0.68 | 0.73 | 0.78 | 0.80 |
The EIS spectra can be used calculated the fraction of the target DNA molecules efficiently hybridized onto the ssDNA/ZnO–CNT/ITO bioelectrode surface known as the surface coverage (θ). The value of ‘θ’ can be calculated using the following eqn:47
 | (6) |
4. Conclusion
The ZnO–CNT nanocomposite matrix offers an efficient platform for the fabrication of highly sensitive nucleic acid biosensor for detection of N. meningitidis. The fabricated DNA biosensor exhibits low detection limit of target DNA concentration (5 ng μl−1), wide detection range from 5 ng μl−1 to 180 ng μl−1 with a very fast hybridization time of 45 s and a high shelf-life of 20 weeks. The bioelectrode exhibits high sensitivity of 7.51 Ω ng−1 μl−1 and 20.20 μA per decade as measured from the DPV and EIS measurements. EIS measurements highlights the fact that the prepared matrix provides a high surface coverage of 80% towards 140 ng μl−1 concentration of target DNA. The results are much superior to the earlier reports on meningitis nucleic acid biosensors because of the fabricated nanocomposite ZnO–CNT nanocomposite matrix. The results obtained for both amperometric as well as impedimetric DNA sensing points to the fact that, in future, this useful nanocomposite can be utilized for detection of other important bacterial infectious diseases.Acknowledgements
Authors are thankful to DST and DBT for financial support to carry out this work. One of the authors (MT) is thankful to UGC for granting research fellowship.References
- M. K. Patel, P. R. Solanki, A. Kumar, S. Khare, S. Gupta and B. D. Malhotra, Biosens. Bioelectron., 2010, 25, 2586 CrossRef CAS PubMed.
- L. D. Gray and D. P. Fedorko, Clin. Microbiol. Rev., 1992, 5, 130 CrossRef CAS PubMed.
- S. A. Dunbar, R. A. Eason, D. M. Musher and J. E. Clarridge, J. Clin. Microbiol., 1998, 36, 1617–1620 CAS.
- N. Deivanayagam, T. P. Ashok, K. Nedunchelian, S. S. Ahamed and N. Mala, J. Trop. Pediatr., 1993, 39, 284 CrossRef CAS PubMed.
- C. T. Tan and B. B. Kuan, Neuroradiology, 1987, 29, 43 CrossRef CAS PubMed.
- F. O. Finlay, H. Witherow and P. T. Rudd, Arch. Dis. Child., 1995, 73, 160–161 CrossRef CAS PubMed.
- J. E. Sippel, P. A. Hider, G. Controni, K. D. Eisenach, H. R. Hill, M. W. Rytel and B. L. Wasilauskas, J. Clin. Microbiol., 1984, 20, 884–886 CAS.
- K. Surinder, K. Bineet and M. Megha, Indian J. Med. Microbiol., 2007, 25, 395–397 CrossRef CAS PubMed.
- R. Bortolussi, A. J. Wort and S. Casey, Can. Med. Assoc. J., 1982, 127, 489 CAS.
- M. Kilian, I. Sorensen and W. Frederiksen, J. Clin. Microbiol., 1979, 9, 409 CAS.
- P. Radstrom, A. Backman, N. Qian, P. Kragsbjerg, C. Pahlson and P. Olcen, J. Clin. Microbiol., 1994, 32, 2738–2744 CAS.
- J. Neewcombe, K. Cartwright, W. H. Palmer and J. Mcfadden, J. Clin. Microbiol., 1996, 34, 1637–1640 Search PubMed.
- P. Kotilinen, J. Jalava, O. Meurman, O. P. Lehtonen, E. Rintala, O. Pekka, S. La, E. Eerola and S. Nikkari, J. Clin. Microbiol., 1998, 36, 2205 Search PubMed.
- L. F. Baethegan, C. Moraes, L. Weidlich, S. Rios, C. I. Kmetzsh, M. S. N. Silva, M. L. R. Rossetti and A. Zaha, J. Med. Microbiol., 2003, 52, 793 CrossRef PubMed.
- D. C. Richardson, L. Louie, M. Louie and A. E. Simor, J. Clin. Microbiol., 2003, 41, 3851 CrossRef CAS PubMed.
- D. E. Bennett, R. M. Mulhall and M. T. Cafferkey, J. Clin. Microbiol., 2004, 42, 1764 CrossRef CAS PubMed.
- E. D. Carrol, A. P. J. Thomson, P. Shears, S. J. Gray, E. B. Kaczmarski and C. A. Hart, Arch. Dis. Child., 2003, 83, 271 CrossRef.
- S. R. Mikkelsen, Electroanalysis, 1996, 8, 15–19 CrossRef CAS.
- E. Palecek and M. Fojta, Anal. Chem., 2001, 73, 74–83 Search PubMed.
- J. Wang, Chemistry, 1999, 5, 1681–1685 CrossRef CAS.
- T. G. Drummond, M. G. Hill and J. K. Barton, Nature Biotechnology, 2003, 21, 1192–1199 CrossRef CAS PubMed.
- P. Kavanagh and D. Leech, Anal. Chem., 2006, 78, 2710–2716 CrossRef CAS PubMed.
- C. Liu, Y. Hsieh, C. Huang, Z. Lin and H. Chang, Chem. Commun., 2008, 2242–2244 RSC.
- S. Saha, V. Gupta, K. Sreenivas, H. H. Tan and C. Jagadish, Appl. Phys. Lett., 2010, 97, 133704 CrossRef.
- C. Satriano, M. E. Fragalà and Y. Aleeva, Sens. Actuators, B, 2012, 161, 191–197 CrossRef.
- K. Khun, Z. H. Ibupoto, C. O. Chey, J. Lu, O. Nur and M. Willander, Appl. Surf. Sci., 2013, 268, 37–43 CrossRef CAS.
- M. Zhao, J. Huang, Y. Zhou, Q. Chen, X. Pan, H. He and Z. Ye, Biosens. Bioelectron., 2013, 43, 226–230 CrossRef CAS PubMed.
- M. Gao, L. Dai and G. G. Wallace, Electroanalysis, 2003, 15, 1089–1094 CrossRef CAS.
- J. Wang, Electroanalysis, 2005, 17, 7–14 CrossRef CAS.
- M. J. O'Connell, S. M. Bachilo, C. B. Huffman, V. C. Moore, M. S. Strano, E. H. Haroz, K. L. Rialon, P. J. Boul, W. H. Noon, C. Kittrell, J. Ma, R. H. Hauge, R. B. Weisman and R. E. Smalley, Science, 2002, 297, 593–596 CrossRef PubMed.
- K. Balasubramanian and M. Burghard, Anal. Bioanal. Chem., 2006, 385, 452–468 CrossRef CAS PubMed.
- M. Zhang, A. Smith and W. Gorski, Anal. Chem., 2004, 76, 5045–5050 CrossRef CAS PubMed.
- S. G. Wang, Q. Zhang, R. Wang and S. F. Yoon, Biochem. Biophys. Res. Commun., 2003, 311, 572–576 CrossRef CAS PubMed.
- Y. Lin, F. Lu, Y. Tu and Z. Ren, Nano Lett., 2004, 4, 191–195 CrossRef CAS.
- B. Kim and W. M. Sigmund, Langmuir, 2004, 20, 8239–8242 CrossRef CAS PubMed.
- F. Gutierrez, M. D. Rubianes and G. A. Rivas, Sens. Actuators, B, 2012, 161, 191–197 CrossRef CAS.
- H. Teymourian, A. Salimi and R. Hallaj, Talanta, 2012, 90, 91–98 CrossRef CAS PubMed.
- A. Wong, M. Del Pilar and T. Sotomayor, Sens. Actuators, B, 2013, 181, 332–339 CrossRef CAS.
- R. Yudianti, H. Onggo, Y. S. Sudirman, Y. Saito, T. Iwata and J. Azuma, Open Mater. Sci. J., 2011, 5, 242–247 CrossRef CAS.
- S. Baruah and J. Dutta, Sci. Technol. Adv. Mater., 2009, 10, 013001 CrossRef.
- H. Chen, S. Lin and K. Huang, Appl. Opt., 2014, 53, 242–247 CrossRef PubMed.
- V. Gupta and A. Mansingh, J. Appl. Phys., 1996, 80, 1063 CrossRef CAS.
- R. Singh, G. Sumana, R. Verma, S. Sood, M. K. Pandey, R. K. Gupta and B. D. Malhotra, J. Biotechnol., 2010, 150, 357–365 CrossRef CAS PubMed.
- W. Yang, M. Ozsoz, D. B. Hibbert and J. J. Gooding, Electroanalysis, 2002, 14, 1299 CrossRef CAS.
- A. Erdem, K. Kerman, B. Meric, U. S. Akarca and M. Ozsoz, Anal. Chim. Acta, 2000, 422, 139 CrossRef CAS.
- I. Szymańska, H. Radecka, J. Radecki and R. Kalisza, Electrochem. Commun., 2009, 11, 969–973 CrossRef.
- I. Szymańska, H. Radecka, J. Radecki and R. Kalisza, Biosens. Bioelectron., 2007, 22, 1955–1960 CrossRef PubMed.
- M. K. Patel, P. R. Solanki, S. Seth, S. Gupta, S. Khare, A. Kumar and B. D. Malhotra, Electrochem. Commun., 2009, 11, 969–973 CrossRef CAS.
| This journal is © The Royal Society of Chemistry 2016 |

