Can single graphene nanodisks be used as Raman enhancement platforms?

Diego López-Carballeira, Nicolás Ramos-Berdullas, Ignacio Pérez-Juste and Marcos Mandado*
Department of Physical Chemistry, University of Vigo, Lagoas-Marcosende s/n, 36310 Vigo, Spain. E-mail: mandado@uvigo.es

Received 12th May 2016 , Accepted 19th July 2016

First published on 19th July 2016


Abstract

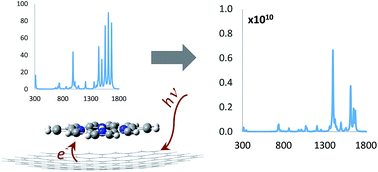
Recent works on plasmonic properties of graphene molecules have pointed out the possibility of building optical devices and Raman sensors using individual molecules. Here, the Raman spectra of different biomolecular units adsorbed on a zig-zag graphene nanodisk of ninety six carbon atoms (C96) are investigated using time-dependent perturbation methods. Static and pre-resonance conditions have been simulated to elucidate the Raman enhancement mechanism via ground state and excited state interactions with the nanodisk. Stacking and H-π complexes formed by the pyronine cation, porphine, tetrabenzoporphine and phthalocyanine with C96 have been considered. Static polarizability changes, charge transfer transitions, surface resonance, molecule-surface vibrational couplings and symmetry factors may all influence the Raman spectra of the molecules. We have explored the role played by each factor in the different conformational dispositions. Our results point out the use of small nanographene structures as promising for the development of SERS platforms at the frontier of nanometer and subnanometer scales.


Introduction

The development of new SERS-active substrates has made it possible to consider surface enhanced Raman spectroscopy (SERS) as a promising tool for bioanalytical studies using ultrasensitive biosensing techniques in vivo.1–7 One of the recent candidates to play a significant role as a substrate is graphene,9,10 either as graphene oxide or in combination with nanoparticles, forming graphene–nanoparticle hybrid structures.4,5,7,8 These forms provide a significant enhancement of the Raman spectra of organic molecules, being comparable with enhancements obtained using noble metals substrates, where the signals' amplification is related to electromagnetic factors arising from localized surface plasmon resonances (LSPR).11–14

The fact that surface plasmon resonances in pristine graphene occurs in the range of terahertz may be considered a drawback for its use as “pure” substrate in SERS.10 Thus, there is no evidence of electromagnetic enhancement and therefore, it is unlikely to reach enhancement factors similar to those obtained by silver and gold nanoparticles.15–18 However, even though the enhancement factors are smaller, the detection limit found for rhodamine (R6G), protoporphyrin IX (PPP) and phthalocyanine (H2Pc) is similar to that of noble metal substrates,9 associated to a significant molecular enrichment derived from the strong π–π interactions of the aromatic structures with the surface.19

On the other hand, recent theoretical works have demonstrated that graphene nanostructures of small and medium size, in particular graphene nanoribbons and nanodisks also known as graphene molecules (GMs),20,21 display plasmonic activity in the UV range.22–24 These theoretical predictions open up a new horizon for the application of small and medium size GMs as substrate in SERS. In addition, they may contribute significantly to the elucidation of the intricate mechanism involved in this phenomenon since these SERS platforms can be accurately treated using quantum mechanical approaches.

The role played by surface resonance factors in graphene nanostructures was recently investigated by us in a preliminary study using the pyridine molecule as Raman probe.25 This preliminary study also revealed the existence of non-negligible vibrational couplings between the adsorbed molecule and the graphene substrate. In some cases these small vibrational couplings gave rise to important enhancements of the Raman activity of particular molecular modes both at static and pre-resonance conditions. On the contrary, when adsorbed on noble metal clusters the Raman spectra of pyridine is not conditioned by vibrational coupling factors due to the large atomic weight of the metallic nuclei, which shift the surface vibrational modes to significantly smaller frequencies.26 The partition of the Raman tensor into molecule and surface contributions led to these conclusions since it allowed quantifying the effect of the surface-molecule vibrational couplings.25 It must be noticed that the possibility of this factor playing a significant role in the Raman spectra of organic molecules adsorbed on graphene was already glimpsed by Ling et al. in their pioneering experimental work.9

The aim of this work is to perform a throughout study of the ability of graphene nanostructures as Raman enhancers, exploring all the possible factors that may influence the Raman spectra of a molecule interacting with its surface. To reach this aim molecular systems of biological interest have been considered. These were selected according to their interest for experimental detection and characterization in more complex biosystems using SERS techniques.

Methodology

Raman intensities are given as differential Raman scattering cross sections, which are calculated from the Raman activities. Using the harmonic approximation the differential Raman scattering is given by,
 
image file: c6ra12349j-t1.tif(1)
where h, c, kB are the Planck constant, light speed in vacuum and Boltzmann constants, respectively. T is the temperature in Kelvin and [small upsilon, Greek, macron]0 and [small upsilon, Greek, macron]k are the frequencies of the incident light and the vibrational mode, k, respectively. The Raman activity for the k vibrational mode, Rk, can be expressed as:
 
Rk = 45[small alpha, Greek, macron]k2 + 7[small gamma, Greek, macron]k2 (2)
where [small alpha, Greek, macron]k and [small gamma, Greek, macron]k are isotropic and anisotropic invariants of the Raman tensor, [R with combining circumflex]k, which contains the polarizability derivatives with respect to the atomic displacements associated to the mode and is given by,
 
image file: c6ra12349j-t2.tif(3)
where image file: c6ra12349j-t3.tif represents the normalized atomic displacement in the cartesian coordinate q for the atom I, ξIq the corresponding unnormalized atomic displacement and μk the reduced mass for the vibrational mode k. The sum in eqn (3) runs over the total number of atoms, which is represented by N.

In this work we have compared the static polarizability tensors obtained for the molecules isolated and adsorbed on the graphene nanodisk. The calculation of the molecular polarizability in the complex has been done using fragment polarizabilities obtained from a partition of the Hilbert space of the basis functions. Thus, the fragment is defined by their nuclei, and the electron density of the fragment by the corresponding basis functions associated to these nuclei, leading to a partition of the static polarizability tensor into molecule (M) and surface (S) contributions,

 
image file: c6ra12349j-t4.tif(4)
 
image file: c6ra12349j-t5.tif(5)
where Eq represents the external electric field, DEq and D the first order reduced density matrices for the perturbed and unperturbed systems, respectively, and φμ and φν the basis functions. To avoid coordinates' origin and basis set dependence, we have employed the coordinates' origin and the basis set of the complex in the calculation of the static polarizability of the molecule even for the calculation in the isolated molecule. Extended derivation of eqn (4) and (5) can be found in ref. 25.

On the other hand, using the fragments' definition mentioned above, the Raman tensor of eqn (3) may be split into molecule and surface parts.

 
image file: c6ra12349j-t6.tif(6)

Using this fragmentation of the Raman tensor, the Raman activity of k gets also partitioned into a sum of molecule (M), surface (S) and intermolecular (MS) contributions, the latter arising from crossed products of the components [R with combining circumflex]Mk and [R with combining circumflex]Sk in eqn (6).

 
Rk = RMk + RSk + RMSk = [45([small alpha, Greek, macron]Mk)2 + 7([small gamma, Greek, macron]Mk)2] + [45([small alpha, Greek, macron]Sk)2 + 7([small gamma, Greek, macron]Sk)2] + [45([small alpha, Greek, macron]MSk)2 + 7([small gamma, Greek, macron]MSk)2] (7)

For further details about derivation of eqn (7) the reader is referred to ref. 25.

This partitioning of the Raman activity allows quantifying the weight of the vibrational coupling between an adsorbed molecule and the surface in the Raman activity of k. Thus, once the vibrational modes corresponding to the molecule are identified in the complex (with the help of the spectrum obtained for the isolated molecule), the Raman activity for a given molecular mode can be decomposed into a ‘pure’ molecular contribution and surface terms using eqn (7). Thus, one can represent spectra using data of molecular contribution or surface contribution separately. The superposition of both is equivalent to the Raman spectrum (see Results and discussion section for more details and examples).

All quantum chemical calculations presented in this work, including geometry optimizations and vibrational analysis, were carried out using the Gaussian09 software package.27 The M06-2X DFT functional in combination with the 6-31G(d,p) basis set was employed for the calculations. The selection of this functional was done on the basis of the results obtained in a previous study.28

To simulate Raman pre-resonance conditions, it is necessary to perform an analysis of the electronic excited states of the complexes using time dependent density functional theory (TDDFT). Those transitions from the ground state with larger oscillator strength are then chosen as reference for the excitation wavelengths in the calculation of Raman activities. The frequency-dependent polarizabilities and subsequently the Raman activities were calculated using the coupled perturbed Kohn–Sham theory (CPDFT). Own FORTRAN codes were employed for the calculation of the fragment static polarizabilities (eqn (4) and (5)) and for splitting the Raman tensor into molecule and surface parts (eqn (6) and (7)). To represent the Raman spectra we have employed Lorentzian lineshapes with a half-height width of 5 cm−1. All the Raman spectra represented for the complexes correspond to the part of the spectra associated to molecular vibrations. The peaks were identified by comparison with the Raman spectra of the isolated molecules and visualization of the corresponding vibrational modes.

Results and discussion

The complexes analyzed are shown in Fig. 1. They correspond to the stable conformations of pyronine cation (Pyr), porphine (PP), tetrabenzoporphine (TBPP) and phthalocyanine (H2Pc) molecules adsorbed on the surface of a graphene nanodisk of ninety six carbon atoms (C96). This nanodisk size was chosen based on the convergence between the binding and adsorption energies of nanodisks of increasing size and the comparison with an infinite graphene sheet.28 Thus, even though their optical and electromagnetic properties are different to those of an infinite sheet or a larger nanodisk, the chemical interaction with the adsorbed molecule is expected to be very similar. Moreover, analysis of the deformation electron densities showed that they also converge for C96 and larger nanodisks like C150, so that non-resonant effects in SERS are expected to be similar. It must be mentioned that the C96 structure was fully relaxed during the calculations of the adsorption complexes, giving rise to a small bending of its structure as was previously found in ref. 28.
image file: c6ra12349j-f1.tif
Fig. 1 Optimized structures of the adsorption complexes investigated.

A detailed description of the structure and stability of the complexes formed can be found in ref. 19. The more stable adsorption complexes, denoted by A, correspond to the stacking disposition of the π clouds of the molecules and the graphene nanodisk, with a pronounced origin in dispersion interactions.19 Complexes B and C correspond to perpendicular dispositions of the molecules with respect to the C96 surface and stem mainly from H–π interactions with a significant electrostatic character.19 It must be remarked that the energy separation between stacking and H–pi complexes is too large for a change of conformation at room temperature, being the stacking conformation much more stable than the rest at unimolecular level. Nevertheless, the extra stabilization that near adsorbed molecules may add in the case of H–pi complexes makes possible the adsorption in this conformation at high concentrations. It is then interesting to investigate also the changes produces by the surface adsorption in the Raman spectra of H–pi complexes.

The first simulations were done using static conditions, i.e., with laser excitations far from resonance. The static spectra obtained for the complexes investigated are shown in Fig. 2. These spectra are confronted with the spectra obtained for the isolated molecules. The main observation is the important decrease of the Raman activity for all the stacking complexes with respect to the isolated molecules. It was previously found for pyridine adsorbed on different carbon structures that the stacking interaction provokes a general decrease of the Raman activity of molecular vibrations and then a general attenuation of the Raman cross section at static conditions, some exceptions were found in molecular vibrations slightly coupled with surface vibrations with small increase of the Raman activity due to contributions associated to surface atoms.25 On the contrary, the spectra for H–π complexes almost overlap those obtained for the isolated molecules with the exception of PyrB and PyrC. In PyrB, an important decrease of the Raman activity for the most intense peaks is also found, whereas in PyrC there are some modes that show an important increase of the Raman activity.


image file: c6ra12349j-f2.tif
Fig. 2 Static spectra of the different complexes (solid lines) confronted with the spectra of the corresponding isolated molecules (dashed lines).

It is interesting to analyze in detail the most intense peak in PyrC, which is found around 1396 cm−1. This frequency coincides with the second most intense peak in the spectrum of the isolated pyronine, nevertheless, the Raman activity in the complex is twice that in the isolated molecule. In static conditions, this is generally associated to the increase of the static polarizability of the molecule due to ground state electronic interactions with the surface. However, the isotropic static polarizability of the adsorbed molecule is not significantly different to that of the isolated molecule (see data of Table 1).

Table 1 Parallel and perpendicular components of the polarizability tensor and isotropic polarizabilities calculated for the molecules adsorbed on C96 (Fig. 1). Values are given relative to those calculated for the isolated molecules
  Conformation α α αiso
Pyr A 0.64 2.20 0.84
B 0.92 0.67 0.89
C 1.12 0.76 1.08
PP A 0.64 1.75 0.77
B 0.97 0.79 0.94
C 0.97 0.79 0.94
H2Pc A 0.68 1.12 0.76
C 0.91 0.63 0.88
TBPP A 0.71 1.54 0.80
C 0.97 0.85 0.95


Since the peak at 1396 cm−1 in the isolated molecule corresponds to a vibrational mode parallel to the pyronine plane, we have also analyzed the parallel contributions to the polarizability (α), finding that the increase of α in the complex is only around 12%, a value that cannot explain the large change in the Raman activity.

A deeper vibrational analysis of PyrC shows that the peak at 1396 cm−1 is actually a superposition of three different signals, one associated to the parallel mode mentioned above (shifted to 1394 cm−1) and other two modes at 1397 and 1398 cm−1. These modes emerge from the strong and balanced vibrational coupling of a Raman inactive mode from the isolated pyronine and a Raman inactive mode from C96. Thus, the parallel mode is not the only responsible of the large intensity at 1396 cm−1 (896 A4 per amu) because its Raman activity in PyrC is similar to that in the isolated molecule (431 Å4 per amu) and there is only a small contribution from the surface atoms (36 Å4 per amu). The Raman activity of the coupled modes together reaches 531 Å4 per amu, most of it coming from the pyronine atoms (497 Å4 per amu).

Symmetry arguments can explain why this effect is only found in PyrC and not in PyrA or PyrB. The coupled vibrational mode from pyronine belongs to the B2 representation of the C2v symmetry group, resulting in a Raman inactive mode. However, the rather strong asymmetric interaction with C96 in PyrC provokes the symmetry breaking of the pyronine vibrations. The coupling with the graphene mode then results in two modes with “unbalanced” atomic displacements at each side of the pyronine molecule. This situation makes the summation of the polarizability derivatives of eqn (6) to be not zero anymore for the pyronine fragment and then the resulting vibrational modes become Raman active. This scenario, where Raman inactive modes in the isolated molecule become highly active in the adsorbed molecule, is quite interesting for discerning among different thermodynamically stable conformations.

On the other hand, the important decrease of the Raman activity in the stacking conformations can be mainly associated with a decrease in the parallel component of the polarizability. The contribution from the surface atoms to the static spectra has been found to be non-negligible in PyrA and PPA (see Fig. 3) and negligible in H2PcA (Fig. 3) and TBPPA (Fig. S1). This cannot explain the changes in the spectra with respect to the isolated molecules. On the contrary, the polarizabilities collected in Table 1 contribute to understand the differences between the static spectra of stacking and H–π conformations. Thus, the parallel component of the polarizability, the most relevant due to the planar structure of the molecules, decreases substantially with the stacking interaction whereas it does not display significant changes with the H–π interaction. The same can be observed for the isotropic polarizability, with the exception of PyrB, which could explain the important decrease of the Raman activity of the most active modes in this H–π complex. As shown in ref. 19, the interaction is stronger in the stacking complexes, with interaction energies much larger than those displayed by H–π complexes. The only exception is found in the H–π complexes formed by the pyronine cation, which due to the increased electrostatic character of the pyronine–graphene interaction show interaction energies more than four times larger than the rest.19


image file: c6ra12349j-f3.tif
Fig. 3 Static Raman spectra (left) obtained for some of the molecules adsorbed on C96 (Fig. 1). Molecule (central) and surface (right) contributions are included.

In a following step, pre-resonance effects were introduced by working with excitation wavelengths close to electronic resonances. To localize the electronic resonances, the theoretical electronic absorption spectra of the complexes were initially obtained.

In Fig. 4, the spectra obtained for PP and H2Pc complexes are displayed and confronted with that of C96 (the full set of spectra is shown in Fig. S2 of the ESI). In these spectra only the main electronic band is shown, that is, the one with the largest oscillator strength. This gives us the reference wavelength for the simulations of pre-resonance Raman spectra. In all the adsorption complexes, this band is located close to the strongest electronic band of the isolated nanographene disk.


image file: c6ra12349j-f4.tif
Fig. 4 Main electronic adsorption band obtained for the porphine and phthalocyanine complexes of Fig. 1 and compared to that obtained for the graphene nanodisk isolated (C96). Transition electron densities are shown for complexes (brown and magenta colors represent negative and positive densities, respectively).

In the absorption spectra of Fig. 4, the transition electron densities, calculated as difference between excited and ground state electron densities, are also included. These transition electron densities reflect clearly the nature of the electronic transition. In stacking complexes, the main band corresponds to a charge transfer transition, showing important changes in intensity and, in the case of PPA, also in position with respect to the C96 band. On the other hand, the bands for H–π complexes correspond to an intramolecular electronic transition in C96 and almost no changes with respect to the isolated C96 band are appreciated. This situation allows us analyzing both charge transfer resonance and surface resonance effects.

Selected pre-resonance Raman spectra are shown in Fig. 5 (the full set of spectra is shown in Fig. S3 of the ESI). These were obtained using an excitation wavelength red-shifted 2 nm with respect to the exact resonance wavelength. The spectra obtained for the stacking complexes show in general a larger enhancement factor than H–π complexes (note the scale indicated on the “y” axis). This reflects that Raman activities are more sensible to electron charge reorganizations in the molecule, as occurs in a charge transfer transition. This is also noticeable in the molecule and surface contributions to the Raman activity. The contribution from the molecule is always larger than that of the surface atoms and the spectrum is then ruled by this term in stacking complexes. An exception is found for H2PcA, where both contributions are in the same scale. This is in line with the amount of electron charge transferred in the electronic transition. Although the charge transfer between H2Pc and C96 is noticeable in H2PcA, here the reorganization of electrons is more located on the surface atoms when compared to PPA (see Fig. 5), PyrA and TBPPA (see Fig. S3).


image file: c6ra12349j-f5.tif
Fig. 5 Pre-resonance Raman spectra (left) obtained for some of the molecules adsorbed on C96 (Fig. 1). Molecule (central) and surface (right) contributions are included.

The surface contribution, in contrast, is the most important in H–π complexes due to the localization of the electronic transition in the surface atoms, dominating the shape of the spectrum. The exception is the TBPPC complex (see Fig. S3). In this case both the molecule and the surface contributions are in the same scale and depending on the vibrational mode the enhancement is mainly due to one or the other. This exception can also be explained by the transition electron density. As can be observed in Fig. S2, there is a non-negligible electron transfer from TBPP to C96 during the electronic transition, which enhance the contribution of the TBPP atoms to the Raman activity.

Conclusions

Summarizing, graphene nanodisks provide good platforms for Raman enhancement of molecules interacting with their surfaces. As an important difference with respect to extended graphene, graphene nanodisks display intramolecular resonance processes within the UV region that provoke huge enhancement factors. Excitations close to charge-transfer resonances provoke even larger enhancement factors; the prevalence of each mechanism depends on the conformational disposition of the molecule on the surface and the interaction strength. Quite interesting is the fact that carbon platforms may display strong molecule-surface vibrational couplings, which accompanied by a symmetry break provoke the strong activation of specific Raman modes, providing a way to distinguish between different conformational dispositions.

Acknowledgements

The authors thank ‘Ministerio de Economía y Competitividad’ for funding their research through project CTQ2010-20229 and Centro de Supercomputacion de Galicia (CESGA) for providing access to its computational facilities.

Notes and references

  1. R. A. Tripp, R. A. Dluhy and Y. Zhao, Nano Today, 2008, 3, 31 CrossRef CAS.
  2. S. D. Hudson and G. Chumanov, Anal. Bioanal. Chem., 2009, 394, 679 CrossRef CAS PubMed.
  3. A. El-Ansary and L. M. Faddah, Nanotechnol., Sci. Appl., 2010, 3, 65 CrossRef CAS PubMed.
  4. Y. Shao, J. Wang, H. Wu, J. Liu, I. A. Aksay and Y. Lin, Electroanalysis, 2010, 22, 1027 CrossRef CAS.
  5. T. Kuila, S. Bose, P. Khanra, A. K. Mishr, N. H. Ki and J. H. Lee, Biosens. Bioelectron., 2011, 26, 4637 CrossRef CAS PubMed.
  6. B. Sharma, R. R. Frontiera, A.-I. Henry, E. Ringe and R. P. Van Duyne, Mater. Today, 2012, 15, 16 CrossRef CAS.
  7. P. T. Yin, S. Shah, M. Chhowalla and K.-B. Lee, Chem. Rev., 2015, 115, 2483 CrossRef CAS PubMed.
  8. J. Chao, W. Cao, S. Su, L. Weng, S. Song, C. Fan and L. Wang, J. Mater. Chem. B, 2016, 4, 1757 RSC.
  9. X. Ling, L. Xie, Y. Fang, H. Xu, H. Zhang, J. Kong, M. S. Dresselhaus, J. Zhang and Z. Liu, Nano Lett., 2010, 10, 553 CrossRef CAS PubMed.
  10. W. Xu, N. Mao and J. Zhang, Small, 2013, 9, 1206 CrossRef CAS PubMed.
  11. L. J. Sherry, S. H. Chang, G. C. Schatz, R. P. Van Duyne, B. J. Wiley and Y. Xia, Nano Lett., 2005, 5, 2034 CrossRef CAS PubMed.
  12. L. J. Sherry, R. Jin, C. A. Mirkin, G. C. Schatz and R. P. Van Duyne, Nano Lett., 2006, 6, 2060 CrossRef CAS PubMed.
  13. G. H. Chan, J. Zhao, G. C. Schatz and R. P. Van Duyne, J. Phys. Chem. C, 2008, 112, 13958 CAS.
  14. A. Fihey, B. Le Guennic and D. Jacquemin, J. Phys. Chem. Lett., 2015, 6, 3067 CrossRef CAS PubMed.
  15. L. Zhao, L. Jensen and G. C. Schatz, J. Am. Chem. Soc., 2006, 128, 2911 CrossRef CAS PubMed.
  16. C. Aikern and G. C. Schatz, J. Phys. Chem. A, 2006, 110, 13317 CrossRef PubMed.
  17. L. Jensen, C. M. Aikern and G. C. Schatz, Chem. Soc. Rev., 2008, 37, 1061 RSC.
  18. D. V. Chulhai, X. Chen and L. Jensen, J. Phys. Chem. C, 2016 DOI:10.1021/acs.jpcc.6b02159.
  19. D. López-Carballeira, N. Rámos-Berdullas, I. Pérez-Juste, J. L. Cagide-Fajín, M. N. D. S. Cordeiro and M. Mandado, Phys. Chem. Chem. Phys., 2016, 18, 15312 RSC.
  20. L. Chen, Y. Hernandez, X. Feng and K. Müllen, Angew. Chem., Int. Ed., 2012, 51, 7640 CrossRef CAS PubMed.
  21. K. Müllen, ACS Nano, 2014, 8, 6531 CrossRef PubMed.
  22. A. N. Grigorenko, M. Polini and K. S. Novoselov, Nat. Photonics, 2012, 6, 749 CrossRef CAS.
  23. S. Thongrattanasiri, A. Manjavacas and F. J. García de Abajo, ACS Nano, 2012, 6, 1766 CrossRef CAS PubMed.
  24. A. Manjavacas, F. Marchesin, S. Thongrattanasiri, P. Koval, P. Nordlander, D. Sánchez- Portal and F. J. García de Abajo, ACS Nano, 2013, 7, 3635 CrossRef CAS PubMed.
  25. N. Ramos-Berdullas, D. López-Carballeira, I. Pérez-Juste and M. Mandado, J. Raman Spectrosc., 2015, 46, 1205 CrossRef CAS.
  26. N. Ramos-Berdullas, D. López-Carballeira, M. Mandado and I. Pérez-Juste, Theor. Chem. Acc., 2015, 134, 60 CrossRef.
  27. M. J. Frisch, G. W. Trucks, H. B. Schlegel, G. E. Scuseria, M. A. Robb, J. R. Cheeseman, G. Scalmani, V. Barone, B. Mennucci, G. A. Petersson, H. Nakatsuji, M. Caricato, X. Li, H. P. Hratchian, A. F. Izmaylov, J. Bloino, G. Zheng, J. L. Sonnenberg, M. Hada, M. Ehara, K. Toyota, R. Fukuda, J. Hasegawa, M. Ishida, T. Nakajima, Y. Honda, O. Kitao, H. Nakai, T. Vreven, J. A. Montgomery Jr, J. E. Peralta, F. Ogliaro, M. Bearpark, J. J. Heyd, E. Brothers, K. N. Kudin, V. N. Staroverov, R. Kobayashi, J. Normand, K. Raghavachari, A. Rendell, J. C. Burant, S. S. Iyengar, J. Tomasi, M. Cossi, N. Rega, J. M. Millam, M. Klene, J. E. Knox, J. B. Cross, V. Bakken, C. Adamo, J. Jaramillo, R. Gomperts, R. E. Stratmann, O. Yazyev, A. J. Austin, R. Cammi, C. Pomelli, J. W. Ochterski, R. L. Martin, K. Morokuma, V. G. Zakrzewski, G. A. Voth, P. Salvador, J. J. Dannenberg, S. Dapprich, A. D. Daniels, Ö. Farkas, J. B. Foresman, J. V. Ortiz, J. Cioslowski and D. J. Fox, Gaussian 09, Revision E.01, Gaussian, Inc., Wallingford CT, 2009 Search PubMed.
  28. N. Ramos-Berdullas, I. Pérez-Juste, C. Van Alsenoy and M. Mandado, Phys. Chem. Chem. Phys., 2015, 17, 575 RSC.

Footnote

Electronic supplementary information (ESI) available: Figures containing the full set of static and pre-resonance Raman spectra and electronic absorption spectra. See DOI: 10.1039/c6ra12349j

This journal is © The Royal Society of Chemistry 2016