Structural transitions and electronic properties of sodium superoxide at high pressures

Naihang Denga, Guochun Yang*ab, Wenyong Wanga and Yongqing Qiu*a
aFaculty of Chemistry, Northeast Normal University, Changchun 130024, China. E-mail: yanggc468@nenu.edu.cn; qiuyq466@nenu.edu.cn
bCentre for Advanced Optoelectronic Functional Materials Research, Key Laboratory for UV Light-Emitting Materials, Technology of Ministry of Education, Northeast Normal University, Changchun 130024, China

Received 12th May 2016 , Accepted 4th July 2016

First published on 5th July 2016


Abstract

Sodium superoxide (NaO2) has attracted considerable attention as the main discharge product in Na–air batteries due to its specific energy, which exceeds that of the Li-ion battery. Pressure has become an irreplaceable tool to improve or alter the physical properties of a given material. By utilizing first-principles swarm structure-searching predictions, herein, we for the first time investigate the structures and electronic properties of NaO2 in the pressure range of 0–20 GPa. It is found that the orthorhombic Pnnm structure at ambient pressure transforms to another orthorhombic Immm structure at approximately 4.6 GPa, and subsequently to the tetragonal P4/mbm structure at 6.7 GPa. The pressure-induced structural transitions are mainly derived from the denser polyhedral packing and higher coordination number. It is interesting to find that the superoxide group (O2) is maintained over the entire pressure range considered. Analysis of the electronic band structure and density of states shows that the structures found exhibit intriguing half-metallic magnetism. This study enables an opportunity to understand the structures and electronic properties of NaO2 at high pressures.

1 Introduction

The typical oxide formed by sodium is sodium oxide, Na2O, which has Na and O in the +1 and −2 oxidation states, respectively. Sodium and oxygen can also combine to form sodium peroxide (Na2O2) and sodium superoxide (NaO2) in which the peroxide group (O22−) or superoxide group (O2) acts as anions. Each oxygen atom in O22− has an oxidation state of −1, whereas each oxygen atom in O2 possesses a −0.5 oxidation state. Thus, O2 has a single unpaired electron and exhibits paramagnetism. Because NaO2 is the main discharge product in Na–air batteries, much attention has been paid to investigate its structures and physical properties.1,2 Moreover, the performance improvement of Na–air batteries strongly depends on the knowledge and understanding of its discharge products.

Templeton and Daubel first reported NaO2 in 1950.3 NaO2 has an FeS2-type structure (space group Pnnm, 2 formula unit per cell) at ambient pressure and a temperature of 4.2 K.4 With an increase in temperature, the Pnnm structure transforms to the Pa3 and Fm[3 with combining macron]m structures at 230 and 300 K, respectively. Fm[3 with combining macron]m-structured NaO2 is a disordered pyrite structure.5 The main differences among the three phases are the ordering of the superoxide ion O2. NaO2 has a rich variety of applications.6 For example, NaO2 can be utilized as a component of oxygen regeneration devices.5,7–9 NaO2 is an intriguing magnetic material because its magnetism originates from the superoxide group, O2, which is in sharp contrast to the magnetic origin of compounds containing transition metals or rare-earth elements.8 Further studies show that the relative alignment of O2 has a great effect on its magnetic properties.10,11 Unlike Li–air batteries, where Li2O2 is the main discharge product, NaO2 has been identified as the dominant discharge product in Na–air batteries because of the faster one electron transfers compared with those in Na2O2.12–15

Pressure has multiple effects, such as overcoming reaction barriers,16 altering atomic orbital energy levels,17 inducing structural transitions,18 and modifying electronic properties.19 As a consequence, pressure has become an irreplaceable tool to discover new materials with exciting physical and chemical properties.20–22 In this study, we for the first time explore the structural evolution of NaO2 up to 20 GPa using an unbiased structure searching method in combination with first-principles calculations. The other two stable structures for NaO2 with Immm and P4/mbm symmetries emerge at 4.6 and 6.7 GPa, respectively. In contrast to the ground structure at 0 GPa, the higher coordination number and denser polyhedral packing make the two structures energetically favorable at high pressures. The paramagnetism originating from O2 is maintained under the considered pressure ranges. Our results are also important for understanding the behaviors of O2 under high pressure.

2 Computational details

The underlying ab initio structural relaxations and electronic calculations were performed using density functional theory within the Perdew–Burke–Ernzerhof (PBE) of parameterization of the generalized gradient approximation (GGA),23,24 as implemented in the Vienna Ab Initio Simulation Package (VASP) code.25–27 The all-electron projector-augmented-wave (PAW)28 pseudopotentials were adopted with 3s1 and 2s22p4 treated as valence electrons for the Na and O atoms, respectively. PAW potentials have shown good predictive capability in battery materials.29–34 Monkhorst–Pack sampling35 with the grid spacing of 2π × 0.015 Å−1 and cutoff energy of 600 eV were used to ensure that the total enthalpy calculations are converged to less than 1 meV per atom. The force converge was set to 1 × 10⁻³ eV Å−1 and the energy convergence threshold was 1 × 10⁻⁶ eV per cell. Phonon calculations, as implemented in the Phonopy code,36 were performed to determine the dynamical stability of the predicted structures.

Our structural prediction was performed as implemented in the CALYPSO (Crystal structure Analysis by Particle Swarm Optimization) structure prediction code, which is based on the global minimization of free energy surfaces and merges ab initio total-energy calculations.37,38 This method is unbiased by any prior known structural information, and only depends only on chemical composition. Its success has been demonstrated with various systems, ranging from elements to binary and ternary compounds.39–46 In this study, structure prediction with simulation cell sizes of 1–4 formula units was performed at pressures of 0, 5, 10, 15 and 20 GPa. The structure search for NaO2 at different pressures converged (evidenced by no structure with a lower enthalpy emerging) after 1000–1200 structures were investigated (i.e. in about 20–30 generations). Detailed description of the structural predictions is given in the ESI. Crystal structures and polyhedrons were visualized using the VESTA tool.47

3 Results and discussion

Structure searches were performed for the NaO2 stoichiometry with up to 4 formula units (f.u.) per simulation cell at 0, 5, 10, 15 and 20 GPa. The ambient pressure phase (space group Pnnm, 2 f.u. per cell) was successfully reproduced in our structural search.

Moreover, the lattice parameters of the Pnnm structure were optimized to be a = 4.17, b = 5.61, and c = 3.43 Å, which are in good agreement with the experimental values of 4.26, 5.54, and 3.44 Å, respectively.4 These results indicate the validity of both the structural prediction method and pseudopotentials adopted. The enthalpy difference (ΔH) of the predicted structures and experimental Pa[3 with combining macron] phase relative to the ambient pressure phase (space group Pnnm, 2 f.u. per cell) was calculated as a function of pressure and is shown in Fig. 1. In general, a lower enthalpy corresponds to a more stable phase. As observed from Fig. 1, the ground state Pnnm structure of NaO2 at ambient pressure transforms to the Immm structure (3 f.u. per cell) at 4.6 GPa. Then, NaO2 undergoes another transition from the Immm to P4/mbm structure at 6.7 GPa. Moreover, the two predicted phases are dynamically stable because of no imaginary phonon modes in the Brillion zone (Fig. S1). According to the partial phonon density of states analysis, the vibration of the Na–O bond mainly contributes to the low frequency regimes, whereas the high frequency regimes mainly originate from the O–O stretching mode, which is also similar to those observed in LiO2,48 thus indicating that the superoxide group (O2) in our considered two phases is maintained over the whole considered pressure range. Complex structural changes can be observed upon these phase transitions, as will be discussed below.


image file: c6ra12328g-f1.tif
Fig. 1 The relative enthalpy per formula unit with respect to the Pnnm structure as a function of pressure within the PBE calculation at T = 0 K for the considered NaO2 structures.

At a certain pressure, P, the structure with the lowest enthalpy (H = U + PV) is the most stable, where U and V are the energy and volume per formula unit, respectively.49 In general, the structure with a smaller volume is favorable at high pressure because it can effectively decrease the enthalpy value. The corresponding volume variations as a function of pressure of the considered structures were calculated and shown in Fig. 2. It can be observed that the volume collapses with 11.11% (5.99%) from the Pnnm to Immm (from Immm to P4/mbm) phase transition, which suggests that the characters of the two considered phase transitions are similar to the cases of Li2O2 and CaO2.50,51 At the same time, it amounts to a lowering of the PV term with the enthalpy of ∼0.06 eV per formula unit for Immm relative to the Pnnm structure, which can be found in Fig. 3a. In addition, the U of Immm is larger than that of Pnnm, as shown in Fig. 3b. Combining the U and PV terms, Immm phase becomes energetically favorable from 4.6 to 6.7 GPa (Fig. 1). Similar results can be found for the Immm to P4/mbm phase transition (Fig. 3(c) and (d)). Therefore, the volume decrease induced by pressure is the main factor in determining the phase transition process.


image file: c6ra12328g-f2.tif
Fig. 2 Calculated volume variations as a function of pressure for the Pnnm, Immm and P4/mbm phases.

image file: c6ra12328g-f3.tif
Fig. 3 (a) PV and (b) U curves for Immm relative to the Pnnm structures of NaO2; (c) PV and (d) U curves for P4/mbm relative to the Immm structures.

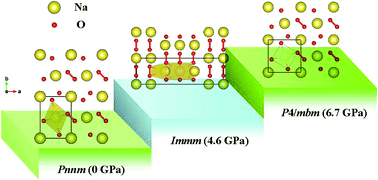
As mentioned above, NaO2 adopts the Pnnm structure. Then, it transforms to Immm, followed by the P4/mbm phase. The crystal structures of these phases and Na-centered polyhedrons are shown in Fig. 4. The calculated lattice parameters and atomic positions for the three considered structures at their phase transition pressures are listed in Table S1. For the orthorhombic structure Pnnm, each Na atom forms a six-fold coordination with O atoms, having two different Na–O distances of 2.39 Å and 2.38 Å, respectively. The O–O distance is calculated to be 1.35 Å, which is in good agreement with the experimental value (1.33 Å).4 The Immm structure contains two inequivalent Na occupying the 2a (0.0, 0.0, 0.0) and 4f (0.832, 0.0, 0.5) positions. The former Na atom is surrounded by the six nearest O atoms, whereas the latter Na atom is coordinated by eight O atoms. The increased coordinated number results in a reduction of the volume, which makes the Immm structure energetically stable. Moreover, the average Na–O distance of 2.36 Å in the Immm structure at 4.6 GPa is slightly shorter than that in the Pnnm structure. It is noted that the distance between the two nearest oxygen atoms is 1.34 Å, indicating that the superoxide group is maintained upon this pressure-induced phase transition. In P4/mbm, the Na–O coordination number is 8, which is the highest coordination number among all the known NaO2 phases. The Na–O distance is further reduced to 2.34 Å. The O–O bond length is 1.33 Å, which is slightly shorter than the distances (1.35 Å and 1.34 Å) at ambient pressure and 4.6 GPa, respectively. Based on the abovementioned analysis, the Na–O and O–O distances in the three considered phases become shorter and shorter with an increase in the pressure. As a consequence, their phase transition mechanisms can be attributed to the higher coordination number and denser polyhedral packing.


image file: c6ra12328g-f4.tif
Fig. 4 Crystal structures: (a) NaO2 with Pnnm symmetry at ambient pressure, (b) NaO2 with Immm symmetry at 4.6 GPa, and (c) NaO2 with P4/mbm symmetry at 6.7 GPa.

To test the anisotropic stress response, the normalized lattice constants of the three considered structures were calculated and illustrated in Fig. 5, where a0, b0 and c0 are the lattice constants of the Pnnm structure at T = 0 K and P = 0 GPa. It is found that the incompressibility along the a- and b-directions is much larger than that of the c-direction. As shown in the structural analysis, the effect of pressure on the Na–O bond length is larger that of the O–O bond. In other words, the Na–O bond is more easily compressed than the O–O bond. For the considered phases, the Na–O and O–O bonds are mainly along the a- and b-directions, whereas the c-direction only contains Na–O bonds.


image file: c6ra12328g-f5.tif
Fig. 5 Calculated normalized lattice constants for the Pnnm, Immm and P4/mbm structures of NaO2 as a function of pressure.

The three considered phases are ferromagnetic. Their magnetic moments are 1.0, 0.9 and 1.0 μB per f.u. at 0.0, 4.6 and 6.7 GPa, respectively. These results imply that the effect of pressure on magnetic moment is very small. This is also in agreement with the slight bond length variation of the superoxide group under pressure. To further understand the electronic properties, we calculated the spin-polarized band structures and density of states (DOS) of the Pnnm, Immm and P4/mbm phases at the phase-transition pressures (Fig. 6). For clarity, the spin-up and spin-down energy band structures and corresponding DOS are shown, respectively. The three considered phases exhibit half metallic magnetism, wherein the spin-down is metallic and the spin-up is semiconductor. The spin-up PBE band gaps of Pnnm, Immm and P4/mbm are 5.05, 4.24 and 5.19 eV at 0.0, 4.6 and 6.7 GPa, respectively, indicating that the Immm phase has the smallest band gap. Analysis of the DOS shows that the magnetism and conducting states arise from the superoxide O2 groups. The same mechanism for superoxide-induced magnetism and metallicity was also observed in Li3O4 compound.52 For the considered phases, there is a dominant O p character around the Fermi energy, which is mainly response for the electronic properties.


image file: c6ra12328g-f6.tif
Fig. 6 Spin-polarized electronic band structures and spin-dependent total and density of states (DOS) of NaO2 within the Pnnm phase at 0 GPa (a), the Immm phase at 4.6 GPa (b), and the P4/mbm phase at 6.7 GPa (c). The red and black lines represent the spin-up and spin-down energy bands, respectively. The black dashed lines denote the Fermi level.

4 Conclusions

Unbiased structure searching combined with density functional total energy calculations was used to explore the structural phase transitions and electronic properties of NaO2 up to 20 GPa. Two novel high-pressure phases, Immm and P4/mbm, were identified at ∼4.6 and 6.7 GPa, respectively. During the phase transition, the Na atom coordination number gradually increases. Moreover, the Na–O and O–O bond lengths decrease with an increase in pressure. As a consequence, the phase transition mechanism mainly originates from the higher coordination number and denser polyhedral packing. Analysis of the electronic band structure reveals that the two high-pressure NaO2 phases are half-metallic and magnetic. It is hoped that this study will stimulate further experimental studies on NaO2 at high pressure.

Acknowledgements

The authors gratefully acknowledge financial support from the National Natural Science Foundation of China (21573037 and 21173035) and the Natural Science Foundation of Jilin Province (20150101042JC) and the Postdoctoral Science Foundation of China under grant 2013M541283.

Notes and references

  1. O. Arcelus, C. Li, T. Rojo and J. Carrasco, J. Phys. Chem. Lett., 2015, 6, 2027–2031 CrossRef CAS PubMed.
  2. S. Kang, Y. Mo, S. P. Ong and G. Ceder, Nano Lett., 2014, 14, 1016–1020 CrossRef CAS PubMed.
  3. D. H. Templeton and C. H. Dauben, J. Am. Chem. Soc., 1950, 72, 2251–2254 CrossRef CAS.
  4. G. F. Carter and D. H. Templeton, J. Am. Chem. Soc., 1953, 75, 5247–5249 CrossRef CAS.
  5. S. Yang and D. J. Siegel, Chem. Mater., 2015, 27, 3852–3860 CrossRef CAS.
  6. P. Singh and N. K. Gaur, Phys. Lett. A, 2007, 371, 349–353 CrossRef CAS.
  7. B. Lee, D.-H. Seo, H.-D. Lim, I. Park, K.-Y. Park, J. Kim and K. Kang, Chem. Mater., 2014, 26, 1048–1055 CrossRef CAS.
  8. P. Hartmann, D. Grübl, H. Sommer, J. Janek, W. G. Bessler and P. Adelhelm, J. Phys. Chem. C, 2014, 118, 1461–1471 CAS.
  9. I. V. Solovyev, Z. V. Pchelkina and V. V. Mazurenko, CrystEngComm, 2014, 16, 522–531 RSC.
  10. M. Kim and B. I. Min, Phys. Rev. B: Condens. Matter Mater. Phys., 2014, 89, 121106 CrossRef.
  11. T. Knaflič, M. Klanjšek, A. Sans, P. Adler, M. Jansen, C. Felser and D. Arčon, Phys. Rev. B: Condens. Matter Mater. Phys., 2015, 91, 174419 CrossRef.
  12. P. Hartmann, C. L. Bender, J. Sann, A. K. Durr, M. Jansen, J. Janek and P. Adelhelm, Phys. Chem. Chem. Phys., 2013, 15, 11661–11672 RSC.
  13. C. L. Bender, P. Hartmann, M. Vračar, P. Adelhelm and J. Janek, Adv. Energy Mater., 2014, 4, 1301863 CrossRef.
  14. B. D. McCloskey, J. M. Garcia and A. C. Luntz, J. Phys. Chem. Lett., 2014, 5, 1230–1235 CrossRef CAS PubMed.
  15. P. Hartmann, C. L. Bender, M. Vračar, A. K. Dürr, A. Garsuch, J. Janek and P. Adelhelm, Nat. Mater., 2013, 12, 228–232 CrossRef CAS PubMed.
  16. E. Zurek, R. Hoffmann, N. W. Ashcroft, A. R. Oganov and A. O. Lyakhov, Proc. Natl. Acad. Sci. U. S. A., 2009, 106, 17640–17643 CrossRef CAS PubMed.
  17. M. S. Miao, Nat. Chem., 2013, 5, 846–852 CrossRef CAS PubMed.
  18. Y. Ma, M. Eremets, A. R. Oganov, Y. Xie, I. Trojan, S. Medvedev, A. O. Lyakhov, M. Valle and V. Prakapenka, Nature, 2009, 458, 182–185 CrossRef CAS PubMed.
  19. R. S. McWilliams, D. K. Spaulding, J. H. Eggert, P. M. Celliers, D. G. Hicks, R. F. Smith, G. W. Collins and R. Jeanloz, Science, 2012, 338, 1330–1333 CrossRef CAS PubMed.
  20. P. F. McMillan, Chem. Soc. Rev., 2006, 35, 855–857 RSC.
  21. Y. Wang and Y. Ma, J. Chem. Phys., 2014, 140, 040901 CrossRef PubMed.
  22. Y. Wang, L. Jian, Z. Li, L. Shaohua, Y. Ketao, L. Quan, W. Hui, Z. Lijun and M. Yanming, J. Phys.: Condens. Matter, 2015, 27, 203203 CrossRef PubMed.
  23. W. Kohn and L. J. Sham, Phys. Rev., 1965, 140, A1133–A1138 CrossRef.
  24. J. P. Perdew, K. Burke and M. Ernzerhof, Phys. Rev. Lett., 1996, 77, 3865–3868 CrossRef CAS PubMed.
  25. G. Kresse and J. Hafner, Phys. Rev. B: Condens. Matter Mater. Phys., 1993, 47, 558–561 CrossRef CAS.
  26. G. Kresse and J. Furthmüller, Phys. Rev. B: Condens. Matter Mater. Phys., 1996, 54, 11169–11186 CrossRef CAS.
  27. G. Kresse and J. Furthmüller, Comput. Mater. Sci., 1996, 6, 15–50 CrossRef CAS.
  28. G. Kresse and D. Joubert, Phys. Rev. B: Condens. Matter Mater. Phys., 1999, 59, 1758–1775 CrossRef CAS.
  29. Y. Mo, S. P. Ong and G. Ceder, Phys. Rev. B: Condens. Matter Mater. Phys., 2011, 84, 205446 CrossRef.
  30. D.-H. Seo, H. Gwon, S.-W. Kim, J. Kim and K. Kang, Chem. Mater., 2010, 22, 518–523 CrossRef CAS.
  31. D.-H. Seo, H. Kim, H. Kim, W. A. Goddard and K. Kang, Energy Environ. Sci., 2011, 4, 4938–4941 CAS.
  32. D.-H. Seo, H. Kim, I. Park, J. Hong and K. Kang, Phys. Rev. B: Condens. Matter Mater. Phys., 2011, 84, 220106 CrossRef.
  33. D.-H. Seo, Y.-U. Park, S.-W. Kim, I. Park, R. A. Shakoor and K. Kang, Phys. Rev. B: Condens. Matter Mater. Phys., 2011, 83, 205127 CrossRef.
  34. G. Yang, S. Shi, J. Yang and Y. Ma, J. Mater. Chem. A, 2015, 3, 8865 CAS.
  35. H. J. Monkhorst and J. D. Pack, Phys. Rev. B: Condens. Matter Mater. Phys., 1976, 13, 5188–5192 CrossRef.
  36. A. Togo, F. Oba and I. Tanaka, Phys. Rev. B: Condens. Matter Mater. Phys., 2008, 78, 134106 CrossRef.
  37. Y. Wang, J. Lv, L. Zhu and Y. Ma, Phys. Rev. B: Condens. Matter Mater. Phys., 2010, 82, 094116 CrossRef.
  38. Y. Wang, J. Lv, L. Zhu and Y. Ma, Comput. Phys. Commun., 2012, 183, 2063–2070 CrossRef CAS.
  39. L. Zhu, H. Liu, C. J. Pickard, G. Zou and Y. Ma, Nat. Chem., 2014, 6, 644–648 CAS.
  40. J. Lv, Y. Wang, L. Zhu and Y. Ma, Phys. Rev. Lett., 2011, 106, 015503 CrossRef PubMed.
  41. L. Zhu, H. Wang, Y. Wang, J. Lv, Y. Ma, Q. Cui, Y. Ma and G. Zou, Phys. Rev. Lett., 2011, 106, 145501 CrossRef PubMed.
  42. D. Nishio-Hamane, M. Zhang, T. Yagi and Y. Ma, Am. Mineral., 2012, 97, 568–572 CrossRef CAS.
  43. Y. Wang, H. Liu, J. Lv, L. Zhu, H. Wang and Y. Ma, Nat. Commun., 2011, 2, 563 CrossRef PubMed.
  44. Q. Li, D. Zhou, W. Zheng, Y. Ma and C. Chen, Phys. Rev. Lett., 2013, 110, 136403 CrossRef PubMed.
  45. M. Zhang, H. Liu, Q. Li, B. Gao, Y. Wang, H. Li, C. Chen and Y. Ma, Phys. Rev. Lett., 2015, 114, 015502 CrossRef PubMed.
  46. G. Yang, Y. Wang, F. Peng, A. Bergara and Y. Ma, J. Am. Chem. Soc., 2016, 138, 4046–4052 CrossRef CAS PubMed.
  47. K. Momma and F. Izumi, J. Appl. Crystallogr., 2008, 41, 653–658 CrossRef CAS.
  48. K. C. Lau, L. A. Curtiss and J. Greeley, J. Phys. Chem. C, 2011, 115, 23625–23633 CAS.
  49. C. J. Pickard and R. J. Needs, Nat. Mater., 2008, 7, 775–779 CrossRef CAS PubMed.
  50. N. Deng, W. Wang, G. Yang and Y. Qiu, RSC Adv., 2015, 5, 104337–104342 RSC.
  51. J. R. Nelson, R. J. Needs and C. J. Pickard, Phys. Chem. Chem. Phys., 2015, 17, 6889–6895 RSC.
  52. G. Yang, Y. Wang and Y. Ma, J. Phys. Chem. Lett., 2014, 5, 2516–2521 CrossRef CAS PubMed.

Footnote

Electronic supplementary information (ESI) available: Computational detail of the structural prediction; the phonon dispersion curve for the considered for NaO2; the calculated structural information of the predicted NaO2 structures at selected pressures. See DOI: 10.1039/c6ra12328g

This journal is © The Royal Society of Chemistry 2016
Click here to see how this site uses Cookies. View our privacy policy here.