
Defect states and morphological evolution in mechanically processed ZnO + xC nanosystems as studied by EPR and photoluminescence spectroscopy
M. Kakazey*a,
M. Vlasovaa,
E. A. Juarez-Arellanob,
T. Torchynskac and
V. A. Basiukd
aCIICAp-Universidad Autónoma del Estado de Morelos, Cuernavaca, Mexico. E-mail: kakazey@hotmail.com; Fax: +52 777 329 70 84; Tel: +52 777 329 70 84
bInstituto de Química Aplicada, Universidad del Papaloapan, Tuxtepec, Oaxaca, Mexico
cEscuela Superior de Física y Matemáticas del Instituto Politécnico Nacional, México DF, Mexico
dInstituto de Ciencias Nucleares, Universidad Nacional Autónoma de México, Circuito Exterior C.U., 04510 México, D.F., Mexico
First published on 8th June 2016
Abstract
An evolution of electron paramagnetic resonance (EPR) and photoluminescence (PL) spectra of various active states (hydrogen donor DH EPR centers, Zn vacancy-related EPR centers  , EPR DS centers from shallow donors (g = 1.9640) in ZnOW, Mn2+ ions in ZnOZB, C EPR centers in carbon nanoparticles, forming the near-band-edge (NBE) PL emission, PL emission typical for Zn-, O- and N-enriched ZnOW particles, as well as oxidized carbon nanodots (OCN)) was observed in the mixtures of ZnO + xC nanoparticles during prolonged high-energy mechanical processing (MP) in a hermetically sealed grinding chamber. The results of EPR and PL spectroscopy, X-ray diffraction analysis, as well as morphological analysis by means of atomic force microscopy (AFM) and laser particle sizer (LPS) measurements show a wide variety of interrelated series–parallel processes in the samples with increasing MP processing time (tMP). These processes include: (a) dramatic reduction in intensity of the DH EPR signal and PL bands at 3.14 (1.57), 2.53 and 2.3 eV during the first minutes of MP, which correlate with sample disaggregation; (b) grinding of ZnO particles and formation of Zn vacancy-related EPR centers in the area of destruction (AD); (c) an increase in sample temperature; (d) annealing of the Zn vacancy-related EPR centers formed; (e) initiation of carbon nanoparticle interaction with oxygen in the grinding chamber; (f) formation and growth of the EPR signal due to carbon nanoparticles; (g) formation of a reducing environment in the grinding chamber; (h) stabilization of donor DS-centers in AD of ZnO nanoparticles; (i) an increase in CO concentration in the grinding chamber; (j) inhibition of DS paramagnetic centers in ZnO; (k) initiation of the EPR signals due to Mn2+ ions in ZnOZB sphalerite phase in the sample with the lowest carbon content; (l) inhibition of nitrogen PL centers in ZnO; (m) the formation of oxidized carbon nanodots (OCN) showing a PL band at 2.8 eV. A detailed analysis for the localization of EPR and PL centers in the MP samples is presented.
1. Introduction
Nanocomposite materials (in which at least one of the material components has one or more dimensions in the nanometer range) are referred to as materials of the 21st century, due to an opportunity to create in them a combination of properties that cannot be found in conventional bulk composites and to broaden design possibilities.1,2 In particular, it is known that the decoration of ZnO nanostructures by nanoparticles of other materials allows to modify the surface electronic structure, creating new properties of the composite material (as exemplified for the case of ZnO + Ag3).Nanocrystalline composite materials of ZnO with different forms of carbon are studied in the context of development of new catalytic and photocatalytic materials,4–7 low-voltage phosphor applications,8 engineering of magnetic ZnO with nonmagnetic C dopants,9 assembly of functional nanoscale electronic and photonic structures,10 cathode materials with improved field emission properties,11 luminescent materials,12 selective solar absorber coatings,13 among others. The effect of synthesis conditions on physico-chemical properties of the nanoparticles are indicative of a close relationship between the structure of their newly formed agglomerated forms and electronic states of the latter. Nanocomposites are not mechanical mixtures of nanoparticles of different phases: an important part of their properties is governed by interactions at interfaces between the phases. In other words, when considering the properties of nanocomposites it is necessary to account for the existence of (often crystalline) nanoparticle cores, their highly-defective surface layer, as well as for chemical interactions between the particles and for those with the surrounding atmosphere.
Earlier electron paramagnetic resonance (EPR) and photoluminescence (PL) studies revealed the existence of a number of active sites in ZnO, whose content depends on the sample preparation conditions.14–21 It is important to note that, while in single-crystal ZnO samples most of the EPR and PL centers can be identified rather unambiguously, in nanoparticulate samples a number of centers with similar parameters (g-factor in EPR; maximum peak position in PL) and properties can be observed. As a result, UV, violet, green and yellow PL bands in nanoparticulate ZnO are well known, but the luminescence mechanisms remains unclear. Varying synthetic conditions and post-processing (annealing under different atmospheres, irradiation, mechanical processing, etc.22–25) of ZnO-samples in a broad range led, on one hand, to frequently observed similarities in PL spectra, and to a very controversial interpretation of the nature of luminescence centers, on the other hand. In particular, the near-band-edge (NBE) UV-emission at ν ∼ 3.10–3.35 eV has been attributed to donor–acceptor pair transition,26 zinc vacancies,27 donor-bound excitonic emission,28,29 electron–hole recombination,30 an excitonic level which is lower than the conduction band,31,32 free exciton recombination,33 free-to-bound transition,34 electron–hole plasma recombination,35 surface-bound ionized acceptor–exciton complexes,36 and exciton–exciton collision process.37 These data indicate that NBE emission in each case is defined by the defect structure and chemical nature of the impurities, which in turn depend on the history of sample synthesis, subsequent storage, and even on the sample preparation procedure for PL measurements. EPR and luminescence characterization of carbon materials was performed as well.38–44
The main focus of our work is the modification of material properties by means of different ways of sample processing, including mechanical processing (MP). The first description of the luminescence spectra evolution in MP samples of ZnO + xC was presented in.45,46 We observed that the intensity of PL bands (at 3.14 eV, 2.42–2.50 eV and 1.57 eV) present in the spectra of unprocessed samples decreases dramatically in the first 3 min of MP. This effect was attributed to the generation of nonradiative recombination centers (increase of the center concentrations) due to MP.47 The appearance of PL band at 2.84 eV attributed to graphite oxide was observed at processing time tMP ≥ 30 min.45,46
The origin and evolution of several paramagnetic states in the mixtures of ZnOW + xC nanoparticles during intensive MP was previously described by us as well.48,49 These states include three types of Zn vacancy-related centers and shallow donor centers (g ≈ 1.96) in ZnO wurtzite structure (ZnOW), a C EPR signal due to carbon nanoparticles, an EPR feature due to Mn2+ ions in the zinc blende (sphalerite) ZnO phase (ZnOZB). All these EPR and PL changes reflect the diversity of physical and chemical processes occurring in the samples during MP.
In the present study, the evolution of EPR signals and luminescence spectra of different active centers (states) present in the untreated samples and appearing in the mixtures of ZnO with carbon nanoparticles during prolonged high-energy mechanical activation were explored in relation to morphological, thermal, chemical and other changes taking place in the samples during their MP. An especial emphasis is done on the localization of EPR and luminescence centers in the samples.
2. Materials and methods
An analytical grade commercial ZnO powder Reasol was used. A maximum limit of impurities was as follows: insoluble sulfuric acid, 0.010%; chlorides, 0.001%; carbonates, 0.001%; nitrates, 0.003%; sulfur compounds (as sulfates SO4), 0.010%; As, 0.0002%; Fe, 0.001%; Pb, 0.005%; Mn, 0.0005%. The average initial size of ZnO particles was dZnO ∼ 250 nm (according to scanning electron microscopy48,49).Carbon nanoparticles were purchased from EPRUI Nanoparticles & Microspheres Co. Ltd. According to high resolution transmission electron microscopy (TEM) images, the nanoparticles are shaped as quasi-spheres or convex polyhedra with diameters ranging from 10 to 60 nm. The structure of carbon nanolayers is typical for nongraphitized amorphous carbons.50 A more detailed characterization of the carbon nanoparticles by means of TEM, X-ray diffraction (XRD), EPR, etc., will be reported in a separate paper.
The starting mixtures ZnO + xC (x = 0.1%, 1.0% and 3.0% by weight) were prepared by mechanical mixing of the components. Both the mixing and subsequent high energy MP was carried out in a Planetary Ball-Mill PM 400/2 from Retsch Inc., using a grinding chamber of 50 ml volume made of tungsten carbide. For the mixing, seventeen balls of 10 mm diameter, also made of tungsten carbide, were used, at a ball-to-powder sample ratio of about 5![[thin space (1/6-em)]](https://www.rsc.org/images/entities/char_2009.gif) :1 by weight. The mechanical mixing was carried out at a low rotation speed of about 200 rpm and processing times (tMP) of 20 min. Hereafter, these mixtures will be referred to as initial samples (note that earlier we did not describe in detail the procedure for mixing powders, since it had no effect on the EPR and X-ray characteristics obtained48). The high energy MP was carried out in the same hermetically sealed grinding chamber with another set of tungsten carbide balls: three of 20 mm and ten of 10 mm diameter, at a ball-to-powder sample ratio of about 28:1 by weight. MP was performed at a maximum rotation speed of 400 rpm and tMP of 1, 3, 9, 30, 90 and 390 min.
:1 by weight. The mechanical mixing was carried out at a low rotation speed of about 200 rpm and processing times (tMP) of 20 min. Hereafter, these mixtures will be referred to as initial samples (note that earlier we did not describe in detail the procedure for mixing powders, since it had no effect on the EPR and X-ray characteristics obtained48). The high energy MP was carried out in the same hermetically sealed grinding chamber with another set of tungsten carbide balls: three of 20 mm and ten of 10 mm diameter, at a ball-to-powder sample ratio of about 28:1 by weight. MP was performed at a maximum rotation speed of 400 rpm and tMP of 1, 3, 9, 30, 90 and 390 min.
Morphological analysis (particle and agglomerate sizes) of the samples was performed by atomic force microscopy (AFM; by using Nanoscope IV from Digitial Instruments and a microscale cantilever with a radius of tip curvature of 5 nm), XRD (Bruker D8 Advance diffractometer with CuKα radiation), and by laser particle sizer (LPS; Analysette 22 COMPACT from Fritsch; lower measuring limit of 0.3 μm). Two types of AFM mode were used: non-contact imaging (constant height mode, h) and the tapping mode (phase regime, f). The powder samples were prepared (a) by dispersing the powder onto a flat disc with a double face adhesive tape on it; (b) by dispersing the powder and its triturating by pressing between two flat discs; (c) by dispersing the powder in a glass vial containing isopropyl alcohol in an ultrasonic bath, then a drop was deposited on a flat disc and the solvent evaporated in air. LPS analysis of particle/agglomerate size distribution with and without the use of ultrasonic processing (USP) were performed.
EPR spectra were recorded on a SE/X 2547 Radiopan instrument (9.38 GHz frequency; modulation frequency of 100 KHz; microwave power 2 mW; modulation amplitude of 1 gauss; cylindrical cavity (TE011 mode)) at room temperature. Double integration of EPR-signals was performed for measuring its intensity.
PL spectra were acquired at 300 K, with He–Cd laser excitation at a wavelength of 325 nm and a beam power of 46 mW, by employing the PL setup based on a SPEX500 spectrometer as described in ref. 51.
3. Results
3.1. Atomic force microscopy
The AFM micrographs (Fig. 1; exemplified for ZnO + 1% C) were used to determine an average ZnO particle size, DZnOAFM. With increasing the duration of MP, DZnOAFM decreased from 250 ± 40 nm (initial) to 35 ± 6 nm (tMP = 90 min) and further to 13 ± 3 nm (tMP = 390 min). | ||
| Fig. 1 AFM micrographs (phase regime) of MT samples of ZnO + 1% C for different MT duration: (a) initial sample; (b) tMT = 90 min; (c) tMT = 390 min. (a) Sample was prepared by dispersing the powder and its triturating by pressing between two flat discs; (b and c) samples were prepared by dispersing the powder in a glass vial containing isopropyl alcohol upon USP, then drop casting onto a flat disc and drying in air. | ||
3.2. X-ray diffraction
Fig. 2a shows XRD patterns of ZnO + xC samples as a function of milling time. When tMP increases, the height of XRD peaks decreases and their width increases. An average ZnO crystallite size (DZnOX) was calculated from XRD peak (101) broadening (Fig. 2a) using Scherrer's equation. Fig. 2b shows the changes in DZnOX versus MP duration. Within the accuracy of peak width measurements, these changes are independent of the carbon content in ZnO + xC samples. ZnO crystallite size changed from about 250 nm for the initial sample, which agrees with the individual particle size estimated by AFM, down to 14 nm for tMP = 390 min (Fig. 2b). Note that in chemically synthesized samples Zn1−xMnxO there was a significant difference between the data on the size of ZnO nanoparticles, determined by AFM and XRD methods.52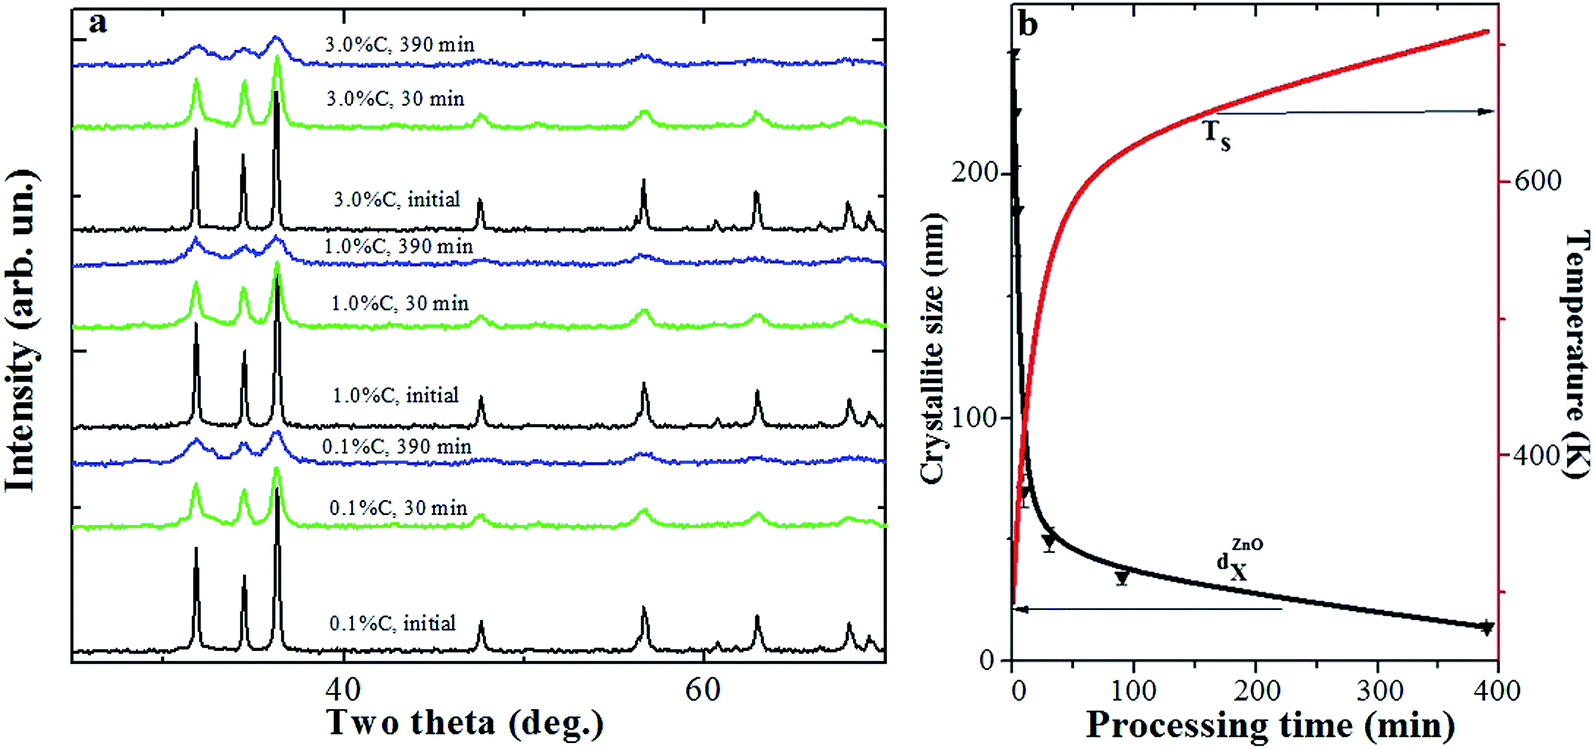 | ||
| Fig. 2 (a) X-ray diffraction patterns of ZnO + 0.1% C, ZnO + 1.0% C and ZnO + 3.0% C samples after MP during different tMP. (b) Changes in ZnO crystallite average size, DZnOX, and sample temperature, TS, versus MP duration. | ||
3.3. Laser particle analysis
The plots of size distribution for individual particles and agglomerates (which behave as individual particles), DLPS, for undoped ZnO sample measured without and with USP, are presented in Fig. 3a and b, respectively. According to Fig. 3a, for the starting sample as measured without USP, two maxima are observed in the range of 3 × 10³ to 4 × 10⁴ nm. At the same time, the measurements performed with USP produced a single maximum for particle size distribution (average size of nanoparticle agglomerates,![[D with combining macron]](https://www.rsc.org/images/entities/i_char_0044_0304.gif) LPS) at DLPS of 1 × 10³ to 2 × 10³ nm (Fig. 3b). Changes of LPS in undoped ZnO, ZnO + 0.1% C, ZnO + 1.0% C and ZnO + 3.0% C samples as a function of tMP measured with USP are shown in Fig. 3c. As one can see, for undoped ZnO LPS values are much higher as compared to the size of individual particles in the sample found by AFM (DZnOAFM). In other words, the particle size distribution as measured by LPS reflects the presence of strongly agglomerated ZnO nanoparticles (Fig. 4), similarly to our earlier studies on mechanically processed ZnO + MnO2 mixtures.53 Adhesion and autohesion phenomena are caused by superficial forces which depend on the surface properties of contacting particles and the surrounding gas environment. Since the surface properties of particles are formed during their preparation and storage, one can suggest that the sample agglomeration is a consequence of its previous history.53 Upon MP of undoped ZnO powder samples, the destruction of agglomerates take place mainly during first few minutes (tMP ≤ 9 min). At longer tMP, the size of ZnO agglomerates increases again (Fig. 3c).
LPS) at DLPS of 1 × 10³ to 2 × 10³ nm (Fig. 3b). Changes of LPS in undoped ZnO, ZnO + 0.1% C, ZnO + 1.0% C and ZnO + 3.0% C samples as a function of tMP measured with USP are shown in Fig. 3c. As one can see, for undoped ZnO LPS values are much higher as compared to the size of individual particles in the sample found by AFM (DZnOAFM). In other words, the particle size distribution as measured by LPS reflects the presence of strongly agglomerated ZnO nanoparticles (Fig. 4), similarly to our earlier studies on mechanically processed ZnO + MnO2 mixtures.53 Adhesion and autohesion phenomena are caused by superficial forces which depend on the surface properties of contacting particles and the surrounding gas environment. Since the surface properties of particles are formed during their preparation and storage, one can suggest that the sample agglomeration is a consequence of its previous history.53 Upon MP of undoped ZnO powder samples, the destruction of agglomerates take place mainly during first few minutes (tMP ≤ 9 min). At longer tMP, the size of ZnO agglomerates increases again (Fig. 3c).
 | ||
| Fig. 3 (a) LPS histogram for the size distribution (DLPS) in initial undoped ZnO sample as measured without USP; (b) LPS curves for different tMP values measured for initial ZnO sample with USP; (c) changes of LPS in ZnO, ZnO + 0.1% C, ZnO + 1.0% C and ZnO + 3.0% C samples as a function of tMP (measured with USP). | ||
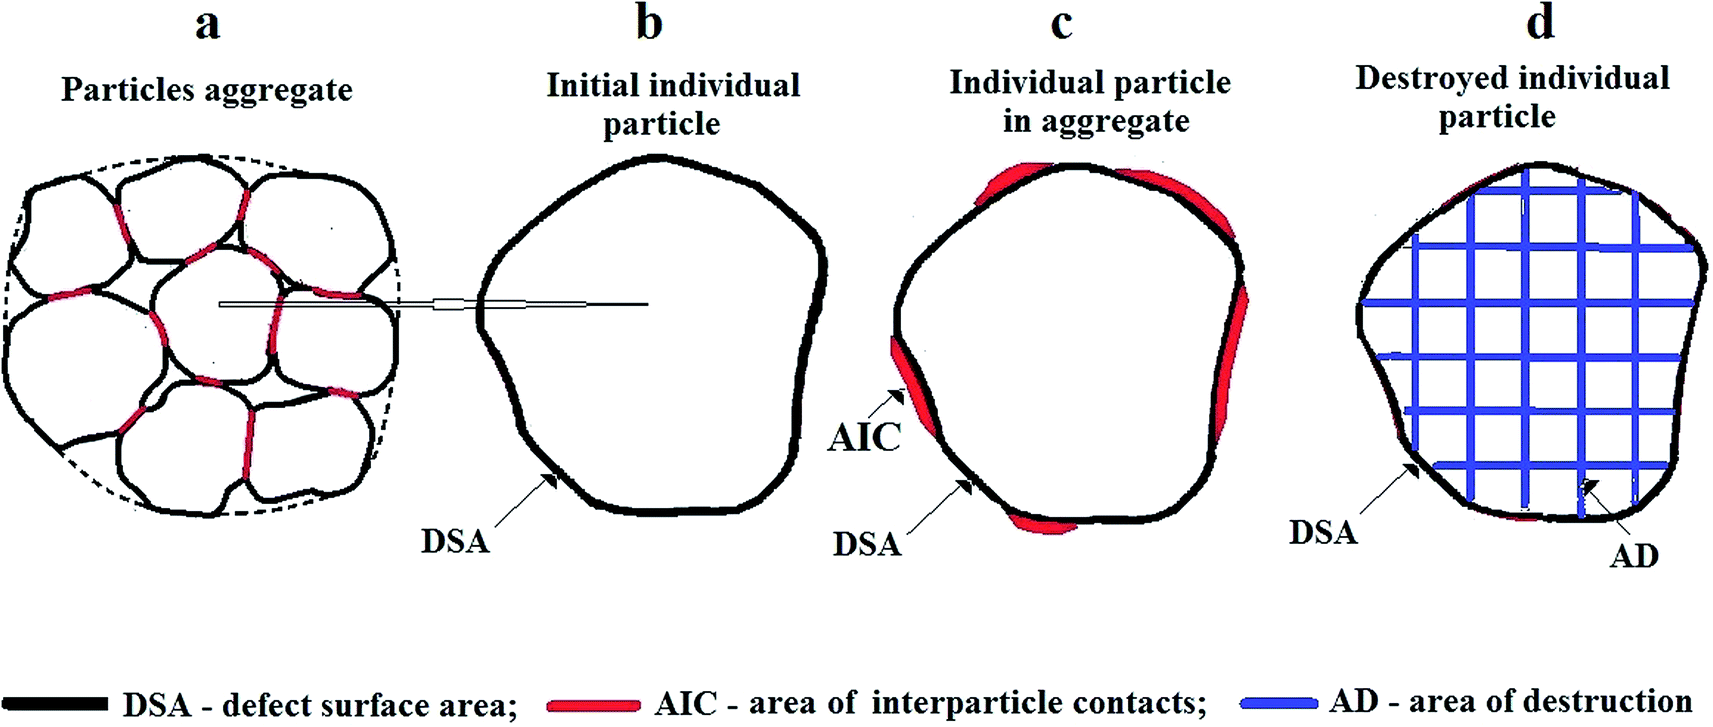 | ||
| Fig. 4 (a) Models of ZnO particle aggregate, (b) the initial individual particle, (c) the individual particle in the aggregate, (d) destroyed individual particle. Allocated defect areas: DSA (black) – defect surface area; AIC (red) – area of interparticle contacts; AD (blue) – area of destruction. | ||
Fig. 3c also shows that the degree of ZnO agglomeration varies greatly in ZnO + xC mixtures as well. The position of LPS in DLPS histograms is shifted toward lower values with increasing the content of carbon additives at the step of mechanical mixing (Fig. 3c). This shift is even more pronounced after high energy MP. Even after as short tMP as 3 min, LPS values decrease down to the lower measuring limit for LPS of 0.3 μm.
3.4. Electron paramagnetic resonance
EPR spectra of ZnO + xC samples before and after MP are shown in Fig. 5. In Fig. 6, the integral intensities of EPR signals observed are plotted against MP duration for different carbon content. A detailed description of EPR spectra for carbon containing ZnO samples was presented previously.48 Here we analyze the relationship between EPR spectra observed and the evolution of defects in the samples. | ||
| Fig. 5 EPR spectra for ZnO + 0.1% C (a), ZnO + 1.0% C (b) and ZnO + 3.0% C (c) samples at different MP times. | ||
 | ||
| Fig. 6 Changes in the integral intensity of EPR signals of Zn vacancy-related centers (II and III) and DS centers in ZnO nanoparticles, as well as C centers in carbon nanoparticles at different MP times. | ||
 in grinded ZnO nanoparticles. MP results in the initiation and evolution of several paramagnetic centers in the samples. The formation (further increase of their number to a maximum, then decrease down to disappearance) of some hole centers I (g = 2.0190, g < g), II (g = 2.0130, g = 2.0140) and III (g1 = 2.0075, g2 = 2.0060, g3 = 2.0015) (Fig. 5 and 6) takes place at tMP of 1–30 min. Signal I originates from
  centers;56 signal II, from
  centers;57 and signal III, from (VZn−)2− centers.56 All of them form in the area of destruction (AD see Fig. 4) of ZnO crystalline particles (on the newly formed surfaces) as a result of movement and interaction between dislocations during MP. From the analysis of peak widths for I (ΔBI ≈ 2.5 G), II (ΔBII ≈ 3.0 G) and III (ΔBIII ≈ 2.7 G), one can estimate that local concentration of I, II and III centers does not exceed 0.1 atomic%. The corresponding signal amplitudes Ii increase with increasing MP duration, reaching their maxima very fast, and then each of them weakens and finally disappears at different MP times (Fig. 6). No significant differences in qualitative and quantitative changes in EPR signals from I, II and III centers depending on tMP and x are observed in ZnO + xC samples.
Such changes of the intensities of signals I, II and III in the sample can be associated with the development of different processes during MP (deformation, fracture, interparticle friction, collision, etc.) leading to a consistent increase in sample temperature. In particular, it is known that signal II disappears after thermal treatment at TII ∼ 453 K; signal I, after thermal treatment at TI ∼ 493 K; and signal III, after thermal treatment at TIII ∼ 533 K.58 Therefore, sequential disappearance of EPR signals from II, I and III centers when increasing MP times indicates that TS exceeds annealing temperature of the corresponding defect. Fig. 2b gives an idea on the sample temperature during continuous MP (see also ref. 59).
 centers, were observed.61 That is, the signals at g ≈ 1.96 cannot be attributed to single zinc or single oxygen vacancies. Thus, it seems more appropriated to refer to a group of similar centers that exhibits paramagnetic signal at g ∼ 1.955–1.964, rather than to a single center. The basis for such a group of defects should be specific native point defects, whereas the associated impurities influence the value of g-factor and the peak width. The EPR signal at g = 1.9640 was observed previously in undoped ZnO powders, subjected to a high-pressure compression.18 In this case, paramagnetic states formed are isolated from contact with the air. This allows us to consider centers responsible for EPR signal with g = 1.9640 as the basic defect complex. It is known62 that during plastic deformation of a “two-layered structure” of the diamond-type lattice, the formation of double vacancies takes place. At the initial step of MP, the basic paramagnetic complexes, formed in the zones of destruction, interact with air oxygen molecules in the grinding chamber and convert into nonparamagnetic state (EPR signal at g = 1.9640 is absent). Thus, one can expect that in a sealed grinding chamber after 30-90 min MP, a reducing environment forms, which stabilizes DS centers in the area of destruction of ZnO particles. One should remember that the sample temperature at such tMP values reaches ∼600 K, and that in the grinding chamber conditions are created for interaction of carbon both with air oxygen and with surface oxygen atoms of ZnO. Carbon oxidation in the air is accompanied by the formation of two oxides: carbon monoxide (CO) and carbon dioxide (CO2). With increasing carbon content in the sample (and with increasing tMP) it is natural to expect an increased content of CO in the milling atmosphere. Thus, the phenomenon of CO inhibition of paramagnetic DS centers can explain the above-mentioned quantitative changes in the number of these centers in the sample with increasing both tMP and carbon content in the sample (Fig. 6).
 | ||
| Fig. 7 Comparison of the shapes of experimental C EPR signal (black) for ZnO + 0.1% C sample (tMP = 30 min) with a Lorentzian lineshape (red) having the same width and amplitude. | ||
Three main types of paramagnetic defects in carbon materials can be involved to give an interpretation of EPR signals observed. σ- and π-defects are typical for graphitized carbon, whereas dangling sp3-bonds are typical for diamond-like and amorphous carbon. According to,39 the signals with g-factors lower than the free electron value of ge = 2.00232 are characteristic for the materials where sp2 hybridization dominate. During MP of ZnO + xC samples, the following phenomena take place: (a) breakdown of the initial carbon nanoparticles; (b) coating of ZnO particles with carbon layers is promoted; (c) thermal and mechanical processes induce the reaction of carbon atoms with air oxygen from the grinding chamber and the surface O atoms of ZnO particles. Carbon atoms removed from the surface of amorphous carbon nanoparticles, which initially did not have unpaired electrons (dangling bonds), transform nonparamagnetic particles into particles producing EPR signals. The increase in C EPR line width in all the samples from ΔBC ≈ 3 G at 30 min of MP to ΔBC ≈ 4.05 G in ZnO + 3.0% C, ΔBC ≈ 4.4 G in ZnO + 1.0% C and ΔBC ≈ 6.8 G in ZnO + 0.1% C after 390 min of MP is apparently due to different kinetics of formation of reducing environment in hermetically sealed grinding chamber, which in turn influences the geometry of spin carbon clusters formed, as a function of carbon content in the samples.
The change in DS and C signal intensities in the tMT range of 9–90 min is almost synchronous (Fig. 6). Moreover, the integral intensity of these signals for ZnO + 0.1% C sample is nearly the same. For ZnO + 3.0% C and ZnO + 1.0% C, the intensity of C EPR signals was larger than the intensity of DS signal (Fig. 6). In ZnO + 1.0% C and ZnO + 3.0% C, the difference in intensities of C lines increased with increasing carbon content. However, as noted above, the intensities of DS lines decreases somewhat with increasing carbon content (Fig. 6).
 | (1) |
The EPR spectrum observed is attributed to Mn2+ ions in the zinc blende (sphalerite) ZnO phase (ZnOZB), generated on the surface of ZnOW nanoparticles during MP. Then the question arises, what is the surface composition of the MP dispersed sample? Even in the initial sample, there are two types of particle surfaces: (a) an exposed surface with a high defect concentration (defect surface area, or DSA); (b) a semi-closed AIC (see Fig. 4). These two surface states formed as a result of specific chemical synthesis of nanoparticles of ZnO (DSA) and their subsequent consolidation into a compact sample (AIC). Time and conditions of storage of samples may serve as a consolidating factor. During MP, the degradation of interparticle area and the formation of new surface implies the area of destruction (AD). This AD with newly formed fracture surface differ significantly from the first two, DSA and AIC. The absence in MP-samples of the EPR signature of Mn2+:ZnOW suggests that the impurities of manganese in the trivalent state are present in surface layer DSA of initial ZnOW particles. It is possible that most of other residual impurities are located in this layer. The Mn3+ → Mn2+ reduction directly result from the formation of reducing environment in the grinding chamber. The secondary phase is formed due to rearrangement and subsequent crystallization in DSA zones of ZnOW nanoparticles. The data presented above allow us to estimate the thickness of DSA layer, h, of ZnO initial particles, in which the observed changes take place, to be h ∼ 0.4–0.6 nm.
The formation of biphasic ZnOW–ZnOZB nanomaterials was observed during thermal oxidation of ZnS,66 pulse laser deposition,67 molecular beam epitaxy,68 chemical vapor deposition,69 etc. However, it is worth to mention that the cubic structure of zinc blende (ZnOZB) is unstable under normal conditions and that it can be stabilized in epitaxial thin films, grown on cubic substrates.70 In this case, the stabilizing factor is the difference in lattice parameters of the substrate and ZnOZB film phase, resulting in the emergence of unstable ZnOZB structural stresses. It is natural to expect that for different types of substrates the degree of stabilizing structural stresses will be different (different D values). In the case of ZnOZB formation on ZnOW surface, ZnOZB creates structural stresses leading to the appearance of Mn2+ ions rhombic components with D and E in the S-H parameter of EPR spectrum. The average value of the parameter “stabilizing” D in this case is about 70 × 10−4 cm−1.
The absence of Mn2+:ZnOZB EPR signature in the samples with 1% and 3% carbon added indicates that a large carbon content prevents surface transformation ZnOW → ZnOZB. It is possible that observation of intense Mn2+:ZnOZB EPR signal during MP of ZnOW + xMnO2 (ref. 59 and 71) (i.e. in the absence of carbon in the sample) is also due to the above presented mechanism of phase formation in DSA of initial ZnO particles (see Fig. 4). Occurrence of Mn2+ ions of the MnO2 particles within the bulk of ZnO (formation a solid solution of Mn2+:ZnOW)59,71 is observed at slightly higher sample temperature (at higher tMP values).
3.5. Photoluminescence measurements
:2:1, respectively (Fig. 8). The narrow UV peak at 3.14 eV is associated with the near-band-edge (NBE) emissions, and the narrow IR PL peak at 1.57 eV (III) correspond to the second order diffraction peak of the 3.14 eV.72 The visible-range luminescence (at ∼2.42 eV) in ZnO samples is typically attributed to defect related (II) emissions.14 After Gaussian fitting on visible-range PL spectra (Fig. 9), we found that the green-orange luminescence represents a superposition of two intensive PL peaks at 2.53 eV and 2.30 eV and low intensive peak at ∼2.10 eV (Fig. 8a and b). The bands at 2.52 eV and 2.30 eV are typical for Zn-enriched and O-enriched samples, respectively, in nonstoichiometric zinc oxide.73 The full width at half maximum (FWHM) of the emission bands at 3.14 eV, 2.53 eV, 2.30 eV and 1.57 eV (0.16 eV, 0.57 eV, 0.49 eV, 0.35 eV and 0.074 eV, respectively) did not depend on MP duration and nanocarbon content in the samples.
 | ||
| Fig. 8 PL spectra of MP ZnO + 0.1% C, ZnO + 1% C and ZnO + 3% C samples for different tMP: (1) initial, (2) 1 min, (3) 3 min, (4) 9 min, (5) 90 min, (6) 390 min. | ||
 | ||
| Fig. 9 Gaussian fitting of visible PL spectra for ZnO + 0.1% C samples: (a) initial; (b) tMP = 1 min; (c) tMP = 3 min. | ||
The changes in PL band intensities observed in ZnO + xC samples depending on tMT are shown in Fig. 10. IPL bands at 3.14 eV and 2.53 eV weakened with increasing tMP almost equally fast, while the peak at 2.3 eV weakened somewhat slower. This explains the above-noted ‘red-shifted’ superposition maximum of visible emission (Fig. 8 and 9).
 | ||
| Fig. 10 Changes in intensities of PL bands, IPL, observed in ZnO + xC samples as a function of tMT. | ||
The dependence of intensities of the above-mentioned PL bands (approximately 5:2:1) on the content of nanocarbon additives in samples after preparing the initial mixtures deserves special attention. Such changes may be attributed, on one hand, to a change in absorption–emission properties of the samples, depending on the content of carbon nanoparticles and, on the other hand, can result from the processes occurring during preparation of the mixtures. However, the optical gap of E04 ∼ 5 eV for initial carbon nanoparticles, which is higher than the energy range comprising excitation and luminescence spectra, does not imply their significant effect on PL band intensities in the samples at short MP times. Noteworthy, the intensity of FTIR absorption at 447 cm−1 (0.055 eV) due to ZnO vibrationals was roughly the same for all starting mixtures ZnO + xC.
Another important observation is an approximately 100-fold decrease in intensity (without changing the width) of PL bands at 3.14 eV, 2.53 eV and 2.30 eV taking place after first 3 min of MP. The weakening of PL bands due to MP was noted previously22,24,25 without explaining a mechanism of attenuation; it was linked to the surface localization of the centers responsible for PL. Explanation of such dramatic changes due to the formation of nonradiative recombination centers in ZnO involves the formation of high concentration of these centers upon MP. However, ZnO crystallite size decreases about by half after tMT = 3 min. The defects form in AD of ZnO (see Fig. 4). As noted above, local concentration of Zn vacancy-related EPR centers  in the area does not exceed 0.1 at%. Major changes in the morphological structure of the samples at initial stage of MP is related to particle disaggregation. Changes in the average aggregate size, LPS(tMT), for ZnO samples are illustrated in Fig. 3c.
Fig. 11 presents a comparison of changes in the intensity of PL band at 3.14 eV with morphological changes in the samples: namely, with the average size of nanoparticle aggregates, LPS, (reflecting the disaggregation process) and the medium-sized crystallites, DZnOX, (reflecting the fracture of ZnO nanoparticles) occurring in the first 9 minutes of MP. DZnOX changes, as changes in vacancy-related centers, do not depend on the nanocarbon content. Fig. 11 shows a good correlation between changes in the IPL(tMP) and LPS(tMP) allowing to link together the changes of IPL(tMP) with the process of disaggregation. Intensities of the bands at 2.53 eV and 2.30 eV behave similarly. That is, the centers responsible for luminescence bands at 3.14 (1.57) eV, 2.53 eV and 2.30 eV are localized on the surface of ZnO nanoparticles in the area of interparticle contacts (AIC see Fig. 4) in aggregates collapsing first during MP. In our opinion, these PL centers formed as a result of intergrain (interparticle) interactions during ZnO synthesis (and possibly also during powder storage). For example, in ref. 74 it was shown that the annealing treatment (at 500 and 800 °C) in air of undoped ZnO granular films deposited by magnetron sputtering (grains size ∼ 20 nm) leads both to an increase in grains size to ∼100 nm, and to a clear UV emission peak at 380 nm with simultaneously emerging broad green emission.
 | ||
| Fig. 11 Comparison of changes in the intensity of PL band at 3.14 eV (blue) with morphological changes in the samples: the average size of aggregates of nanoparticles, LPS, (green) and the medium-sized crystallites, DZnOX, (black) occurring in the first 9 minutes of MP. | ||
In other words, the evolution of surface defect structure of chemically synthesized ZnO particles in the zone of interparticle contacts during synthesis (and storage) results in the formation of strong cohesive area interparticle contacts (aggregation) and in the formation (involving local molecular environment) specific luminescence centers. The constant position and width of these PL bands in combination with ultra-fast changes in intensity during the destruction of interparticle contact (disaggregation) point to the existence of structure-specific luminescence centers, depending on the factors mentioned above as well as on the distance between the contacting surfaces, where separation of the contact zones destroys the luminescence centers.
The nanoparticle aggregates formed have variable mechanical strength. Therefore, partial disaggregation of the powder takes place during ZnO + xC mixture preparation. Nanocarbon additives increase disaggregation of initial ZnO powder at short MP times, and slow down the process of secondary aggregation after prolonged MP.
New bands with the maxima at 2.84 and 1.42 eV appear in PL spectra of all samples at tMP ≥ 9 min (Fig. 2b and 5b). The infrared PL band at 1.42 eV is attributed to the second order diffraction peak of the band at 2.84 eV.45,46 As follows from Fig. 10, the band intensity at 2.84 eV increases for longer MP duration and higher carbon concentration. Note that correlation between the PL intensity increases (Fig. 10), and the C EPR signal intensity increases (Fig. 6) as well.
A number of emission bands in UV and visible spectral ranges were reported for ZnO nanoparticles prepared by sol–gel technique76 and for ZnO films prepared by radiofrequency magnetron sputtering.77 Different hypotheses were proposed to explain the origin of PL bands around 2.80 eV. In particular, the blue band with maximum at 2.80 eV in ZnO was attributed to Cu-related defects,78,79 to interstitial Zn species,80 or to the donor–acceptor pairs including shallow donor and oxygen vacancies.81 At the same time, in mechanically processed commercial undoped ZnO powders, PL bands around 2.80 eV were not observed.17,22,24,25
Instead, such PL bands are typical for oxidized forms of carbon:graphite oxide, graphene oxide,42 carbon nanodots prepared by electrochemical etching of carbon fibers,42 as well as for ZnO + C60 fullerene mixtures82 (Fig. 12). The different PL spectra for carbon nanodots can be attributed to the presence of surface energy traps, which become emissive upon stabilization as a result of surface passivation.83 The factors resulting in tunable performance are different particle size and different oxygen-containing groups.84 The PL peak found at 2.80 eV in the present case is very close to the ones observed for graphite oxides and carbon nanodots with 2.7 nm size.44 Thus, one can associate PL band at 2.80 eV appearing during high-energy ball milling of ZnO + xC mixtures with the formation of some oxidized carbon nanodots (OCN) with a size of ∼2.7 nm.
 | ||
| Fig. 12 Comparison of PL spectra for graphite and graphene oxides,42 ZnO mixtures with fullerene C60,82 carbon nanodots with different sizes,44 and mechanically processed ZnO + 3% C sample (tMP = 90 min). | ||
Monitoring in the temperature range of 20–300 K showed that PL maximum at 2.80 eV does not change its position.43 On the contrary, other PL bands (at 3.14 eV, 2.58 eV and 2.23 eV at 300 K) shifted monotonously to higher energies when temperature decreased. The latter behavior is typical for PL spectra of ZnO:Ag nanorods and is related to shrinking the energy band gap at higher temperatures.85
4. Discussion
The data of EPR and PL spectroscopy, X-ray diffraction analysis, and morphological analysis by means of AFM and LPS are indicative of a variety of interrelated parallel processes in ZnO + xC mixtures subjected to high-energy MP in a hermetically sealed grinding chamber. The data obtained allow for identification of defect states in the initial mixture components, for detecting newly formed defect states, as well as for monitoring their evolution. In turn, this makes it possible to suggest an approximate scheme of the evolution of physical, chemical and morphological changes which occur during specific conditions of MP treatment of the samples.4.1. Initial state of reagents used and principal details of sample preparation
Data on the chemical composition of reagents used and main technical details of the sample preparation are presented in section Materials and methods. Here we focus on the principal details necessary for understanding the results obtained.Initial ZnO powder represents a system of strongly bound particle aggregates (Fig. 4a). An average size of the individual constituent particles in the aggregates is about 250 nm, and an average size of the aggregates, determined by non-destructive ultrasonic treatment of LPS measurements, is ∼1.7 μm. In untreated ZnO + xC samples, the intense luminescence bands in the UV (3.14 eV), visible (green-orange luminescence, ∼2.42 eV) and IR (1.57 eV) ranges (Fig. 8) and weak DH EPR signal (Fig. 5) were observed. The narrow UV peak at 3.14 eV has to do with NBE emission. The narrow IR PL peak at 1.57 eV (III) corresponds to the second order diffraction peak of 3.14 eV band.72 The visible luminescence spectra represent a superposition of two intense PL peaks at 2.53 eV and 2.30 eV and the low intensive peak at ∼2.1 eV (Fig. 8a and b). The IPL intensities for the initial samples of ZnO with 0.1% C, 1.0% C and 3.0% C added (i.e., after the mechanical mixing) changed according to the ratio of about 5:2:1, respectively (Fig. 8). The spectral features observed are associated with the sample history, namely, with the sample storage, preparation and synthesis conditions.
The second important circumstance is oxygen content in the grinding chamber. The chamber volume is 50 ml. When the sample is loaded for MP and the chamber is hermetically sealed, it remains to be partially filled with air. The calculated volume of pure oxygen in the chamber is about 5 ml, which is about 2.6 × 10²⁰ oxygen atoms. On the other hand, the carbon content in the samples ZnO + xC, where x = 0.1%, 1.0% and 3.0% by weight, is ∼5 × 10²⁰, ∼5 × 10²¹ and 1.5 × 10²² atoms respectively. That is, the available oxygen content in the chamber is insufficient for complete oxidation even of the minimal (0.1%) amount of carbon in the sample.
The third important circumstance is the high-energy mechanical action on ZnO + xC mixtures. In this context, one should take into account not only the processes of grinding and defects formation, but also development of thermal processes in the samples.
4.2. Physico-chemical processes and rheological changes at tMP = 1–9 min
During the first minutes of sample MP, a dramatic (more than 100-fold) reduction in intensity of the above-mentioned PL bands and DH EPR signal is observed, which correlates with the sample disaggregation (Fig. 5). This allows to attribute the localization of PL and DH EPR centers to AIC area (Fig. 4a and c). Partial destruction of the aggregates occurs already during ZnO + xC mixture preparation, which explains the difference in PL band intensities in the original samples. Noteworthy, AIC represents a special interest for understanding the cohesion mechanisms. The high sensitivity of PL spectra observed can be employed to study the processes of formation/destruction of this area.The grinding reduction of initial ZnO particles from 250 nm to about 60 nm size (Fig. 2b) is accompanied by the formation of Zn vacancy-related EPR centers  (Fig. 5 and 6) in the area of destruction (Fig. 4d). Simultaneously, the sample temperature increases to about 420 K (Fig. 2b).
Milling of the carbon particles did not result in the detection of C EPR signal, apparently due to a limited sensitivity of our EPR measurements.
4.3. Physico-chemical processes at tMP = 9–90 min
At these processing times, the particle size decreased from ∼60 to ∼38 nm, and the sample temperature increased from about 420 K to ∼600 K (Fig. 2b). The increase in sample temperature leads to the following phenomena:(a) Annealing of Zn vacancy-related EPR centers  in ZnO nanoparticles.
(b) Initiating the interaction of carbon nanoparticles with oxygen in the grinding chamber. Two carbon oxide species form in the chamber: CO and CO2. Since oxygen content in the chamber is limited, the relative (with respect to CO2) CO content in the gas medium becomes higher for the samples with high carbon nanoparticle content. The CO content in the gas medium increases also with increasing tMP.
(c) Simultaneously, the process of carbon oxidation promotes the initiation and growth of C EPR signal of Lorentzian shape (spin clusters) in carbon nanoparticles (Fig. 5–7). The intensity of this signal is roughly proportional to nanocarbon content in ZnO + xC samples.
(d) Graphite (graphene) oxides begin to form on the surface of carbon nanoparticles, which exhibit luminescence band at 2.80 eV (Fig. 8 and 12).
(e) MP, the formation of reducing environment in the grinding chamber, and increase in sample temperature result in the initiation and stabilization of donor DS centers in AD of ZnO nanoparticles (Fig. 4d).
4.4. Physico-chemical processes at tMP = 90–390 min
At these processing times, ZnO particle size further reduces from ∼38 nm to ∼14 nm, and the sample temperature increases from ∼600 K to ∼700 K (Fig. 2b). The integral intensities of C EPR signal in the samples ZnO + xC with different carbon content (x = 0.1%, 1.0% and 3.0%) become roughly equal (Fig. 6), thereby emphasizing the role of limited oxygen content in the grinding chamber in generating a certain number of broken valences in carbon nanoparticles. Variable (depending on x) CO/CO2 ratio influences geometry of the C-spin clusters formed. The intensities of luminescence band of graphite oxide at 2.80 eV for these three samples increase somewhat and become roughly equal also (Fig. 10). Within the frame of “carbon nanodots” model44 the results observed are typical for PL band of nanodots with a size of 2.7 nm. We can assume the formation of nanocomposite particles with ∼14 nm ZnO core coated with carbon nanoparticles of ∼2.7 nm size.The increase of CO content with increasing tMP completely inhibits DS paramagnetic centers in ZnO + xC samples. The conditions created in the grinding chamber at prolonged MP promote emergence of the EPR spectral features due to Mn2+ ions in ZnOZB sphalerite phase. Such a spectrum was observed for the sample with minimal carbon content only. The newly formed ZnOZB phase is located in DSA zone of initial ZnO particles (Fig. 4). The layer thickness of this phase is ∼0.4–0.6 nm.
5. Conclusions
In summary, our EPR and PL studies show that ZnO + xC samples exhibit a number of EPR signals , and DS in ZnOW, Mn2+ ions in ZnOZB, C in carbon nanoparticles) and PL emission bands (NBE, Zn-, O- and N-enriched ZnOW particles, as well as oxidized carbon nanodots) under different duration of their MP.
Dramatic reduction in intensity of DH EPR and PL bands at 3.14 (1.57), 2.53 and 2.30 eV during the first minutes of MP are consistent with the localization of corresponding centers in the area of ZnO-interparticle contacts within strongly bound particle aggregates of initial ZnO powder. In other words, reduction in the band intensities correlates with the sample disaggregation.
Increasing tMP results in the following phenomena: (a) grinding of ZnO particles and the formation of Zn vacancy-related EPR centers in in the area of destruction; (b) increase in sample temperature; (c) annealing of the Zn vacancy-related EPR centers formed; (d) initiating the interaction of carbon nanoparticles with oxygen in the grinding chamber; (e) formation and growth of the C signal in carbon nanoparticles; (f) formation of reducing environment in the grinding chamber; (g) stabilization of the donor DS centers in the area of destruction of ZnO nanoparticles; (h) increase in CO content in the grinding chamber; (i) inhibition of DS paramagnetic centers in ZnO; (j) emergence of the EPR spectral features due to Mn2+ ions in ZnOZB sphalerite phase in the sample with minimal carbon content only; (k) inhibition of N PL centers in ZnO; (l) formation of oxidized carbon nanodots exhibiting PL band at 2.80 eV.
Acknowledgements
This work was supported by the National Council of Science and Technology of Mexico (CONACYT, project number 155731) and the CIICAp-Universidad Autonoma del Estado de Morelos.References
- P. Mele, T. Endo, S. Arisawa, C. Li and T. Tsuchiya, Oxide Thin Films, Multilayers, and Nanocomposites, Springer International Publishing, Switzerland, 2015 Search PubMed.
- P. H. Cury Camargo, K. G. Satyanarayana and F. Wypych, Mater. Res., 2009, 12, 1–39 CrossRef.
- S. A. Ansari, M. M. Khan, S. Kalathil, A. Nisar, J. Lee and M. H. Cho, J. Phys. Chem. C, 2013, 117, 27023–27030 CrossRef CAS.
- R. Gurwitz, R. Cohen and I. Shalish, J. Appl. Phys., 2014, 115, 033701 CrossRef.
- H. Yu, H. Zhang, H. Huang, Y. Liu, H. Li, H. Ming and Z. Kang, New J. Chem., 2012, 36, 1031–1035 RSC.
- P. R. Potti and V. C. Srivastava, Ind. Eng. Chem. Res., 2012, 51, 7948–7956 CrossRef CAS.
- S. Adhikari, D. Sarkar and G. Madras, RSC Adv., 2014, 4, 55807–55814 RSC.
- Z. Fan and J. G. Lu, J. Nanosci. Nanotechnol., 2005, 5, 1561–1573 CrossRef CAS PubMed.
- H. S. Hsu, Y. Tung, Y. J. Chen, M. G. Chen, J. S. Lee and S. J. Sun, Phys. Status Solidi RRL, 2011, 5, 447–449 CrossRef CAS.
- Z. Chen, N. Zhag and Y.-J. Xu, CrystEngComm, 2013, 15, 3022–3030 RSC.
- N. Pan, H. Xue, M. Yu, X. Cui, X. Wang, J. G. Hou and J. Huang, Nanotechnology, 2010, 21, 225707 CrossRef PubMed.
- Y. Hu and H.-J. Chen, J. Appl. Phys., 2007, 101, 124902 CrossRef.
- G. Katumba, L. Olumekor, A. Forbes, G. Makiwa and B. Mwakikunga, Sol. Energy Mater. Sol. Cells, 2008, 92, 1285–1292 CrossRef CAS.
- A. B. Djurišić, A. M. C. Ng and X. Y. Chen, Prog. Quantum Electron., 2010, 34, 191–259 CrossRef.
- L. S. Vlasenko, Appl. Magn. Reson., 2010, 39, 103–111 CrossRef CAS.
- S. Yildirimcan, K. Ocakoglu, S. Erat, F. M. Emen, S. Repp and E. Erdem, RSC Adv., 2016, 6, 39511–39521 RSC.
- H. Kaftelen, K. Ocakoglu, R. Thomann, S. Tu, S. Weber and E. Erdem, Phys. Rev. B: Condens. Matter Mater. Phys., 2012, 86, 014113 CrossRef.
- M. G. Kakazey, G. N. Kakazei and J. G. Gonzalez-Rodriguez, Cryst. Res. Technol., 2001, 36, 429–439 CrossRef CAS.
- V. Ischenko, S. Polarz, D. Grote, V. Stavarache, K. Fink and M. Driess, Adv. Funct. Mater., 2005, 15, 1945–1954 CrossRef CAS.
- S. Das, C. K. Ghosh, R. Dey and M. Pal, RSC Adv., 2016, 6, 236–244 RSC.
- N. Vorobyeva, M. Rumyantseva, D. Filatova, E. Konstantinov, D. Grishina, A. Abakumov, S. Turner and A. Gaskov, Sens. Actuators, B, 2013, 182, 555–564 CrossRef CAS.
- M. Šćepanović, M. Grujić-Brojčin, K. Vojisavljević and T. Srećković, J. Appl. Phys., 2011, 109, 034313 CrossRef.
- T. K. Kundu, N. Karak, P. Barik and S. Saha, International Journal of Soft Computing and Engineering, 2011, 1, 19 Search PubMed.
- P. K. Giri, S. Bhattacharyya, D. K. Singh, R. Kesavamoorthy, B. K. Panigrahi and K. G. M. Nair, J. Appl. Phys., 2007, 102, 093515 CrossRef.
- R. Radoi, P. Fernández, J. Piqueras, M. S. Wiggins and J. Solis, Nanotechnology, 2003, 14, 794–798 CrossRef CAS.
- J. G. Lu, L. P. Zhu, Z. Z. Ye, Y. J. Zeng, F. Zhuge, B. H. Zhao and D. W. Ma, J. Cryst. Growth, 2005, 274, 425–429 CrossRef CAS.
- S. B. Zhang, S.-H. Wei and A. Zunger, Phys. Rev. B: Condens. Matter Mater. Phys., 2001, 63, 075205 CrossRef.
- A. B. M. A. Ashrafi, I. Suemune and H. Kumano, Jpn. J. Appl. Phys., 2002, 41, L1281–L1284 CrossRef CAS.
- B.-P. Zhang, L.-H. Manh, K. Wakatsuki, T. Ohnishi, M. Lippmaa, N. Usami, M. Kawasaki and Y. Segawa, Jpn. J. Appl. Phys., 2003, 42, 2291–2295 CrossRef CAS.
- B. Cao, W. Cai and H. Zeng, Appl. Phys. Lett., 2006, 88, 161101 CrossRef.
- H. Li, Y. Zhang, X. Pan, H. Zhang, T. Wang and E. Xie, J. Nanopart. Res., 2009, 11, 917–921 CrossRef CAS.
- L. Irimpan, V. P. N. Nampoori, P. Radhakrishnan, A. Deepthy and B. Krishnan, J. Appl. Phys., 2007, 102, 063524 CrossRef.
- Y. Zhang, B. Lin, Z. Fu, C. Liu and W. Han, Opt. Mater., 2006, 28, 1192–1196 CrossRef CAS.
- J. S. Reparaz, F. Güell, M. R. Wagner, A. Hoffmann, A. Cornet and J. R. Morante, Appl. Phys. Lett., 2010, 96, 053105 CrossRef.
- H. C. Hsu, C.-Y. Wu and W.-F. Hsieh, J. Appl. Phys., 2005, 97, 064315 CrossRef.
- W.-K. Hong, G. Jo, M. Choe, T. Lee, J. I. Sohn and M. E. Welland, Appl. Phys. Lett., 2009, 94, 043103 CrossRef.
- A. Umar, B. Karunagaran, E.-K. Suh and Y. B. Hahn, Nanotechnology, 2006, 17, 4072–4077 CrossRef CAS PubMed.
- R. C. Barklie, Diamond Relat. Mater., 2001, 10, 174–181 CrossRef CAS.
- R. C. Barklie, M. Collins and S. R. P. Silva, Phys. Rev. B: Condens. Matter Mater. Phys., 2000, 61, 3546–3554 CrossRef CAS.
- F. Beuneu, C. L'Huillier, J.-P. Salvetat, J.-M. Bonard and L. Forro, Phys. Rev. B: Condens. Matter Mater. Phys., 1999, 59, 5945–5949 CrossRef CAS.
- A. I. Shames, E. A. Katz, A. M. Panich, D. Mogilyansky, E. Mogilko, J. Grinblat, V. P. Belousov, I. M. Belousova and A. N. Ponomarev, Diamond Relat. Mater., 2009, 18, 505–510 CrossRef CAS.
- G. Singh, A. Choudhary, D. Haranath, A. G. Joshi, N. Singh, S. Singh and R. Pasricha, Carbon, 2012, 50, 385–394 CrossRef CAS.
- C. T. Chien, S. S. Li, W. J. Lai, Y. C. Yeh and H. A. Chen, Angew. Chem., Int. Ed., 2012, 51, 6662–6666 CrossRef CAS PubMed.
- F. Liu, Y. Cao, M. Yi, L. Xie, W. Huang, N. Tang, W. Zhong and Y. Du, Crystals, 2013, 3, 28–37 CrossRef CAS.
- T. Torchynska, B. Perez Millan, E. Velazquez Lozada, M. Kakazey and M. Vlasova, ECS Trans., 2015, 66, 297–303 CrossRef CAS.
- E. Velázquez Lozada, T. Torchynska, J. L. Casas Espinola, A. Vivas Hernandez, M. Kakazey, M. Vlasova, L. Shcherbyna and L. Castañeda, Mater. Sci. Semicond. Process., 2015, 237, 82–86 CrossRef.
- T. Torchynska, Phys. E, 2011, 44, 56–61 CrossRef CAS.
- M. Kakazey, M. Vlasova and E. A. Juarez-Arellano, J. Nanopart. Res., 2015, 17, 118 CrossRef.
- M. Kakazey, M. Vlasova, E. A. Juarez-Arellano and T. Torchynska, Mater. Sci. Semicond. Process., 2015, 39, 775–780 CrossRef CAS.
- A. B. Palotas, L. C. Rainey, C. J. Felderman and J. B. Vander Sande, Microsc. Res. Tech., 1996, 33, 266–278 CrossRef CAS PubMed.
- T. V. Torchynska, M. Dybiec and S. Ostapenko, Phys. Rev. B: Condens. Matter Mater. Phys., 2005, 72, 195341 CrossRef.
- T. Ruf, S. Repp, J. Urban, R. Thomann and E. Erdem, J. Nanopart. Res., 2016, 18, 109 CrossRef.
- M. Kakazey, M. Vlasova, M. Dominguez-Patiño, G. Dominguez-Patiño, Y. Enríquez-Méndez, M. C. Reséndiz-Gonzalez, T. Tomila, M. Ristic and M. V. Nikolic, Powder Technol., 2009, 93, 130–136 CrossRef.
- D. M. Hoffmann, A. Hofstaetter, F. Leiter, H. Zhou, F. Henecker and B. K. Meyer, Phys. Rev. Lett., 2002, 88, 045504 CrossRef PubMed.
- E. Erdem, J. Alloys Compd., 2014, 605, 34–44 CrossRef CAS.
- B. Schallenberger and A. Hausmann, Z. Phys. B: Condens. Matter Quanta, 1976, 23, 177–181 CrossRef CAS.
- D. Galland and A. Herve, Solid State Commun., 1974, 14, 953–956 CrossRef CAS.
- M. G. Kakazey, M. Vlasova, M. Dominguez-Patiño, G. Dominguez-Patiño, G. Gonzalez-Rodriguez and B. Salazar-Hernandez, J. Appl. Phys., 2002, 92, 5566–5568 CrossRef CAS.
- M. Kakazey, M. Vlasova, M. Dominguez-Patiño, I. Leon and M. Ristic, J. Mater. Sci., 2007, 42, 7116–7122 CrossRef CAS.
- L. E. Halliburton, N. C. Giles, N. Y. Garces, M. Luo, C. Xu, L. Bai and L. A. Boatner, Appl. Phys. Lett., 2005, 87, 172108 CrossRef.
- V. A. Nikitenko, K. É. Tarkpea, I. V. Pykanov and S. G. Stoyukhin, J. Appl. Spectrosc., 2001, 68, 502–507 CrossRef CAS.
- H. G. van Bueren, Imperfections in crystals, North-Holland Pub. Co., Amsterdam, 2nd edn, 1961 Search PubMed.
- D. Arcon, Z. Jaglicic, A. Zorko, A. V. Rode, A. G. Christy, N. R. Madsen, E. G. Gamaly and B. Luther-Davies, Phys. Rev. B: Condens. Matter Mater. Phys., 2006, 74, 014438 CrossRef.
- A. Hausmann, Solid State Commun., 1968, 6, 457–459 CrossRef CAS.
- S. Kunii, S. Tobita and E. Yirahara, J. Phys. Soc. Jpn., 1966, 21, 479–484 CrossRef CAS.
- G. H. Lee, T. Kawazoe and M. Ohtsu, Appl. Surf. Sci., 2005, 239, 394–397 CrossRef CAS.
- Y. Z. Yoo, Y. Osaka, T. Fukumura, M. Kawaski, H. Koinuma, T. Chikyow, P. Ahmet, A. Setoguchi and S. F. Chichibu, Appl. Phys. Lett., 2001, 78, 616–618 CrossRef CAS.
- A. B. M. A. Ashrafi, I. Suemune and H. Kumano, Jpn. J. Appl. Phys., 2002, 41, 2851–2854 CrossRef CAS.
- L. Xu, Y. Su, Y. Chen, H. Xiao, L. A. Zhu, Q. Zhou and S. Li, J. Phys. Chem. B, 2006, 110, 6637–6642 CrossRef CAS PubMed.
- A. B. M. A. Ashrafi and C. Jagadish, J. Appl. Phys., 2007, 102, 071101 CrossRef.
- M. Kakazey, M. Vlasova, M. Dominguez-Patiño and J. Munguia-Diaz, Solid State Commun., 2008, 145, 122–125 CrossRef CAS.
- T. V. Torchynska and B. El Filali, J. Lumin., 2014, 149, 54–60 CrossRef CAS.
- C. Ton-That, L. Weston and M. R. Phillips, Phys. Rev. B: Condens. Matter Mater. Phys., 2012, 86, 115205 CrossRef.
- X. Xu, C. Xu, G. Chen, J. Wu and J. Hu, Europhys. Lett., 2013, 101, 27009 CrossRef.
- M. A. Reshchikov, J. Q. Xie, B. Hertog and A. J. Osinsky, J. Appl. Phys., 2008, 103, 103514 CrossRef.
- S. Dutta and B. N. Ganguly, J. Nanobiotechnol., 2012, 10, 29 CrossRef CAS PubMed.
- Y. S. Choi, J. W. Kang, D. K. Hwang and S. J. Park, IEEE Trans. Electron Devices, 2010, 57, 26–41 CrossRef CAS.
- J. Lv, C. Liu, W. Gong, Z. Zi, X. Chen, K. Huang, T. Wang, G. He, S. Shi, X. Song and Z. Sun, Opt. Mater., 2012, 34, 1917–1920 CrossRef CAS.
- M. A. Reshchikov, H. Morkoc, B. Nemeth, J. Nause, J. Xie, B. Hertog and A. Osinsky, Phys. B, 2007, 401–402, 358–361 CrossRef CAS.
- M. K. Patra, K. Manzoor, M. Manoth, S. P. Vadera and N. Kumar, J. Lumin., 2008, 128, 267–272 CrossRef CAS.
- D. H. Zhang, Z. Y. Xue and Q. P. Wang, J. Phys. D: Appl. Phys., 2002, 35, 2837–2840 CrossRef CAS.
- D. I. Son, B. W. Kwon, J. D. Yang, D. H. Park, B. Angadi and W. K. Choi, J. Mater. Chem., 2012, 22, 816–819 RSC.
- R. L. Liu, D. Q. Wu, S. H. Liu, K. Koynov, W. Knoll and G. Li, Angew. Chem., 2009, 121, 4668–4671 CrossRef.
- H. Li, Z. Kang and Y. Liu, J. Mater. Chem., 2012, 22, 24230–24253 RSC.
- E. Velázquez Lozada, T. V. Torchynska, J. L. Casas Espinola, B. Perez Millan and L. Castañeda, Phys. B, 2014, 453, 111–115 CrossRef.
| This journal is © The Royal Society of Chemistry 2016 |