A. M. Patila,
V. C. Lokhandeb,
A. C. Lokhandec,
N. R. Chodankara,
T. Jib,
J. H. Kim*c and
C. D. Lokhande*a
aThin Film Physics Laboratory, Department of Physics, Shivaji University, Kolhapur, 416004 M.S, India. E-mail: l_chandrakant@yahoo.com; Fax: +91 231 2609233; Tel: +91 231 2609225
bDepartment of Electronics and Computer Engineering, Chonnam National University, Gwangju 500-757, South Korea
cDepartment of Materials Science and Engineering, Chonnam National University, 300 Yongbong-Dong, Puk-Gu, Gwangju, South Korea. E-mail: jinhyeok@chonnam.ac.kr
First published on 5th July 2016
Metal sulfides have received well deserved attention due to their excellent electrical conductivity and thermal stability, as compared to metal oxides, allowing them to achieve a high capacitance and energy density for portable energy storage devices. In this study, the preparation of highly porous nano-flames composed of nickel sulfide (NiS) thin film on a cost effective, flexible stainless steel substrate through a trouble free, inexpensive and simple chemical bath deposition (CBD) method is reported. The prepared nano-flames composed of a NiS thin film demonstrates the excellent electrochemical features with a maximum specific capacitance (Cs) of 750.6 F g−1 at a scan rate of 5 mV s−1 in a three electrode system. Furthermore, the portable symmetric flexible solid state supercapacitor (FSS-SC) and electrochemical supercapacitor (SC) are fabricated and tested. In comparison with the symmetric electrochemical SC, the symmetric FSS-SC shows an excellent electrochemical performance with a high Cs of 104 F g−1 at 5 mV s−1 with a good electrochemical stability of 85.3% over 3000 CV cycles. This study constitutes the first comparison of symmetric FSS-SCs and electrochemical SCs formed with NiS nano-flames. Such an impressive symmetric FSS-SC is predicted to be an exceptionally promising candidate for energy storage systems.
Recently, the preparation of nano-structured morphologies with a controlled shape, size, internal structure and composition has received an enormous amount of attention to accomplish novel morphology dependent chemical properties for electrode materials.5,6 The open-porous architecture composed of ultrathin nano-sheets, allowing for an electronically conductive framework, is highly favorable for increasing the electron transport along with maintaining a good ionic conductivity.7 Moreover, the porous morphology is beneficial for supercapacitor applications due to the maximum utilization of the electroactive material in addition to a fast charge transfer reaction between the electrode material and electrolyte ions.8 Furthermore, there is a need to synthesize porous morphological materials having pseudocapacitive behavior with better cycling stability.
Presently, metal sulfides (NiS, CoS, and CuS) are in the influence of research in the supercapacitor field due to their excellent intrinsic and electrochemical properties.9–11 Nickel sulfides inaugurate an important type of metal sulfides having different phases such as NiS, NiS2, Ni3S2, Ni3S4, Ni7S6, and Ni9S8. Moreover, the nickel sulfides are extensively applicable in dye-sensitized solar cells, supercapacitors and lithium ion batteries.12–14 NiS is one of the most imperative phases of nickel sulfide as it offers a number of benefits such as a high theoretical capacity, good rate performance and better electrical conductivity. To prefer supercapacitor materials, nickel sulfide is a most promising material and has been investigated by many researchers. Yu et al.15 synthesized a NiS material by an ultrasound-assisted soaking method and the electrode exhibited a Cs of 107.9 F g−1. A Cs of 800 F g−1 in a 6 M KOH electrolyte is reported by Wang et al.16 for a NiS/GO electrode prepared using a hydrothermal method. The α-NiS nanoparticles grown on reduced graphene oxide (RGO) and single-wall carbon nanotubes (CNT) exhibited high-performance (857.7 F g−1), which was synthesized by Yang et al.17 using a one-step solvothermal method. In addition to the above Cs values reported by investigators, further improvement of the long term electrochemical stability, the SPD and the SED of the supercapacitor is required. Moreover, there is still a need to investigate the performance of NiS electrodes fabricated using different inexpensive techniques.
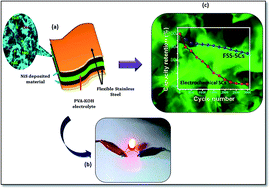
Herein, based on the above deliberation, NiS thin films are prepared by a simple, low cost chemical bath deposition (CBD) technique. The films are characterized using different techniques. The electrochemical performance is tested in a three electrode system using a battery cycler. Furthermore, a symmetric FSS-SC device is fabricated using NiS electrodes and a polyvinyl alcohol–potassium hydroxide (PVA–KOH) polymer gel electrolyte as a separator as well as the electrolyte. Subsequently, the electrochemical SC device is fabricated using two electrodes of NiS in an aqueous 2 M KOH electrolyte. Finally, the performance is compared by measuring the Cs, SED, SPD and electrochemical stability. All these investigations denote that the NiS electrode is quite promising for supercapacitor applications.
NiSO4 + TEA → [Ni[TEA]]+ + SO4− | (1) |
Na2S2O3 + H2O → H2S + Na2SO4 | (2) |
[Ni[TEA]]+ + H2S + HCl → NiS + TEA + HCl + 2H+ | (3) |
Fig. 1(B) depicts the FT-IR spectrum of the synthesized NiS thin film within the scanning range of 360–4000 cm−1. The peaks observed at 2921 and 2852 cm−1 correspond to the C–H stretching modes. The broad peak at 3450 cm−1 corresponds to the O–H stretching vibrations, while the peak at 1627 cm−1 is related to O–H rocking vibrations. The peak at 1385 cm−1 denotes reactivity of the C–N and N–H bonds in organic ligands. The bending vibrations of the sulfide group and absorption of H2O link to peaks at 1108 and 1627 cm−1, respectively.19 The two bands observed at 610 and 3450 cm−1 are due to the δOH as well as O–H vibrations of the hydrogen-bonded hydroxyl group and intercalated water molecules, respectively.
X-ray photoelectron spectroscopy (XPS) is preferred to determine the chemical composition of nickel sulfide and oxidation state of Ni in the deposited NiS thin film. Fig. 1(C) shows the survey spectrum, which displays no other elemental peaks different from the peaks of Ni, S, C, and O, confirming that the sample is pure. The Ni 2p spectrum is fitted to two spin–orbit doublet peaks as Ni 2p3/2 and Ni 2p1/2 at binding energy of 853.26 and 857.40 eV, respectively20 (see Fig. 1(D)). The corresponding satellite peaks at 861.5 and 880.0 eV indicate the presence of nickel-oxygen species on the surface of the NiS thin film.21 The peak at 853.26 eV, near Ni 2p3/2, corresponds to the characteristic peak of NiS materials.22 Moreover, the XPS spectrum of sulfur in the state of S 2p is displayed in Fig. 1(E). The peak observed at a binding energy of 169.5 eV corresponds to the presence of sulfur in thin film material.23 The fitting peaks at 168.8 and 170.77 eV correspond to S 2p3/2. This results are well matches to the previous report.24 The observed peaks at particular binding energies confirm the presence of Ni and S in thin film material with a stable phase.
The BET surface area and pore size distribution of NiS thin film surface are directly correlated with specific capacitance.25 The BET and pore size dispersal analysis accompanied by N2 adsorption–desorption isotherms are reported in Fig. 1(F). It displays a hysteresis loop with designated adsorption-desorption characteristics of porous NiS nano-flames. A considerably acceptable BET surface area of 54.3 m2 g−1 is observed. More importantly, the higher surface area contributed with formation of porous nano-flames on the surface. The BJH pore size distribution of the NiS powder material is deliberated using the desorption curve (see inset of Fig. 1(F)). The NiS sample comprises a higher macro/mesoporosity, as displays by the comparatively high intensity peaks at around 5.4 to 21.4 nm, which can offer low-resistant pathways for the ions through the porous nano-flames structure and a small diffusion route due to the well-ordered macro/mesoporous channels. More prominently, pores at the positions 44.5 and 67 nm reduce ion diffusion resistance, which contributes to fast charge transfer and storage capacity.
Fig. 2(A and B) shows FE-SEM images of the deposited NiS thin film surface at magnifications of 10000× and 25
000×. The surface morphology exhibits an interconnected, porous 3D framework structure composed of ultrathin nano-flames, which are electronically conductive and highly beneficial for extending the electron transport, while also maintaining a better ionic conductivity. The more number of electroactive sides offered by the NiS nano-flames could increase the effective contact area between the active material and OH− ions in the KOH electrolyte.26 The ultrathin nano-flames provide fast electrolyte penetration into the NiS material and react with the electroactive surface. The nano-flames of NiS give easy paths for the transfer of electrolyte ions and ionic diffusion resistance reduction, with fast charge transfer by a decrease in the charge transfer resistance (Rct) in the NiS material. An EDAX spectrum of the NiS sample is shown in Fig. 2(C). The peaks of nickel and sulfur elements are clearly consistent with the elemental composition of NiS. The atomic percentage is found to be 56.30% for nickel and 43.70% for sulfur, denoting good stoichiometry. The results from EDAX analysis are in well agreement with elemental mapping results. Fig. 2(D and E) shows the TEM images of the NiS thin film at two different ranges. The different levels of brightness in the TEM images indicate the porous surface of NiS nano-flames. This confirms that the porous and interconnected 3D framework structure, composed of ultrathin nano-flames, is grown randomly over the surface. The nano-flame-like structure is observed in the TEM, which is analogous to a surface morphology analysis. The contact angle on the surface of the NiS thin film is found to be 55.6° (see Fig. 2(F)). The wettability test is carried out to investigate the interaction between aqueous 2 M KOH and the NiS thin film. This hydrophilic property of NiS is useful for making proper contact between the electroactive material and the aqueous 2 M KOH electrolyte. This essential condition of the material provides a more specific response towards electrochemical capacitor applications. The percent wise elemental mapping of the NiS thin film is shown in Fig. 2(G). The distributions of nickel and sulfur present in thin film are illustrated in Fig. 2(H and I), respectively. The uniform distribution of Ni and S in the NiS nano-flames is clearly visualized in the elemental maps.
NiS + OH− ↔ NiSOH + e− | (4) |
The OH− ions from the KOH electrolyte participate in the reaction.
Fig. 3(B) shows the variation of Cs with scan rate. At a lower scan rate (5 mV s−1), more time is available for the intercalation/deintercalation reaction. Therefore, the Cs value is higher at a lower scan rate than at a higher scan rate. The maximum utilization of an electroactive material in an electrochemical reaction gives more charge storage. Fig. 3(C) depicts the charge–discharge curves at different current densities from 0.5 to 3 mA cm−2 in the 2 M KOH electrolyte. Initially, the charging curve shows a vertical line, which is commonly observed in the GCD measurement of NiS.29 There are voltage plateaus in the discharge curves of the NiS electrode, which is strong indication of a typical faradaic reaction at the electrode–electrolyte interface. Fig. 3(D) illustrates the Cs values at various discharge current densities calculated by the following equation.27
![]() | (5) |
![]() | (6) |
![]() | (7) |
Fig. 3(E) shows the Nyquist plot of the NiS electrode before CV cycling and after cycling in the 2 M KOH electrolyte. The figure inset shows the Nyquist plot magnified. The first non-zero intercept of the Nyquist plot with the real axis gives the solution resistance (Rs), whereas the diameter of the semicircle in the lower frequency region gives Rct. The semicircle in the higher frequency region indicates the capacitive behavior of the NiS electrode. After the semicircle, a straight line at an angle of 45° originated due to Warburg's constant. From these analyses, an Rs of 0.57 and 1.26 Ω cm−2 are observed for before and after CV cycling of the NiS electrode. Rct values of 0.67 and 1.41 Ω cm−2 are calculated for before and after CV cycling, respectively. A low value for Rct tends to improve the rate capability as Rct acts as a restrictive factor for the rapid charge and discharge of a supercapacitor.32 The resistance values for after 2500 CV cycling are more as compared to before CV cycling owing to degradation of the electroactive material after cycling. The ultrathin nano-flames of the NiS electrode display a low Warburg impedance before CV cycling, which assists the diffusion of OH− ions into the NiS electrode. The Bode plot of the NiS electrode is shown in Fig. 3(F). The phase angle at a higher frequency range is lower because of the ionic resistance of the electrolyte, designating a lower capacitance.33 The phase angle increases toward −90° at the lower frequency range marinating the capacitive behavior of the NiS electrode. The phase angle for the NiS electrode is found to be −80.69°. The figure inset displays the link between the real (C′r) and imaginary (C′′Im) parts of the capacitance, which changes with respect to frequency. This result supports the Nyquist plot analysis and CV study. At a higher frequency range, only Rs represents the total impedance of the system. Subsequently, the NiS electrode shows a plateau line in the higher frequency region.
Fig. 4(A) shows the Ragone plot of the NiS electrode. The NiS electrode in 2 M KOH electrolyte shows a maximum SED and SPD of 28 W h kg−1 and 4.98 kW kg−1, respectively. The previously reported SPD and SED values are also included in Ragone plot for comparison. Long term electrochemical stability is a critical requirement for the commercial use of supercapacitors. The electrochemical stability of the NiS electrode up to 2500 CV cycles is reported in Fig. 4(B). The figure inset shows the CV curves at a constant scan rate of 100 mV s−1 for the 2nd and 2500th CV cycles. A capacity retention after 2500 CV cycles of 92% is observed. The degradation of the electroactive material during the cycling process reduces the performance of the electrode. Fig. 4(C and D) shows FE-SEM images of the NiS film surface after 2500 CV cycles. The degradation of the electroactive material is cleanly observed. The ultrathin nano-flames on the surface vanish with a changing morphology. Obviously, the porosity and surface area are both reduced after CV cycling. The contribution of electroactive material decreases with CV cycling, resulting in a reduction in the performance of the electrode. The instability of the NiS electrode may be due to some irreversible oxidation reaction, phase change, and/or the detachment of nano-flames from the SS substrate. The comparative results from previous reports are included in Table 1, including material morphology, electrolyte and electrochemical stability. In addition, the XRD pattern and SEM image of the stainless steel substrate is included in Fig. 4(E and F). The three major peaks in the XRD pattern are observed at 2θ positions of 44.3°, 50.14° and 74.2°. The SEM image shows no particular morphology, but it has a plane structure. The 304 grade SS substrates that was used has a higher corrosion resistance compared with regular steel, while it has the ability to change into various shapes.
Material | Preparation method | Surface morphology | Electrolyte | Specific capacitance (F g−1) | Capacity retention (%) | Reference |
---|---|---|---|---|---|---|
NiS | Template assisted | Hollow structure | 3 M KOH | 668 | 72 (for 1000 cycles) | 42 |
NiS/GO | Hydrothermal | Spherical | 1 M H2SO4 | 109.37 | Not reported | 43 |
β-NiS | Solvothermal | Hierarchical flower-like | 2 M KOH | 512.96 | Not reported | 17 |
NiS | Chemical bath deposition | Ultrathin nano-flames | 2 M KOH | 750.6 | 92 (for 2500 cycles) | This work |
β-NiS | Anionic exchange | Nano needles | 2 M KOH | 415 | 90 (for 2000 cycles) | 8 |
NiS | Hydrothermal | Nano-rods | 2 M KOH | 583.2 | 72 (for 1000 cycles) | 44 |
α-NiS | One-step template free | Hollow spheres | 3 M KOH | 717.2 | 85.2 (for 1000 cycles) | 45 |
NiS | Ultrasound-assisted | Nano-sheet | 2 M KOH | 107.9 | 89 (for 1000 cycles) | 15 |
NiS | Hydrothermal | Not reported | 6 M KOH | 143 | Reported up to 200 cycles | 46 |
A comparative electrochemical performance study of the symmetric FSS-SC and the electrochemical SC is carried out. Fig. 6(a) depicts the CV curves of the FSS-SC device at scan rates of 5-100 mV s−1 within the potential window of 0 to +1.0 V. Above a +1.0 V potential, a dramatically drop in current during cycling was observed. This may be due to the incremental IR drop and insufficient active material involvement in the reaction. The CV curve shows increase in current as the scan rate goes from 5 to 100 mV s−1, which designates capacitive and fast charge–discharge behavior of the symmetric FSS-SCs device. Fig. 6(b) shows CV curves of the electrochemical SC device at various scan rates from 5 to 100 mV s−1 within potential of 0 to +0.8 V. Fig. 6(c) shows the comparison of the CV curves of the symmetric FSS-SC and electrochemical SCs devices. It is clearly observed that the area under the CV curve for the symmetric FSS-SC is high as compared to the electrochemical SC. More importantly, the potential window for the symmetric FSS-SC is greater than that of the electrochemical SC. The Cs versus scan rate graph of these two different devices shows a larger difference in the performance (see Fig. 6(d)). The figure inset shows the histogram of the device performance. An excellent specific capacitance is clearly observed. A maximum Cs of 104.2 F g−1 is achieved at a scan rate of 5 mV s−1 for the symmetric FSS-SC device. The major role of a higher Cs is more time availability during the charge–discharge process recommended at a lower scan rate (5 mV s−1) than a higher scan rate (100 mV s−1). A lower Cs of 15.7 F g−1 is observed for the electrochemical SC device. This may be due to large anions and the low dissociation energy of the PVA-KOH gel polymer electrolyte, providing more free ions than the aqueous 2 M KOH electrolyte. The achieved Cs values confirmed the hypothesis that the PVA-KOH gel electrolyte can dominantly suppress the irreversible oxidation reaction as well as structural pulverization of the NiS nano-flames, without losing the electrochemical performance. The major factor for improvement of the supercapacitor performance of the symmetric FSS-SCs device is the ionic conductivity of the polymer gel electrolyte. An ionic conductivity for the PVA-KOH polymer gel electrolyte on the order of 10−2 S cm−1 is reported by Yang et al.34,35
Fig. 6(e and f) shows the GCD curves of the symmetric FSS-SC device at various current densities varying from 1.2 to 5 mA with a potential window ranging from 0 to +1.0 V for the symmetric FSS-SC, and 0 to +0.8 V for the electrochemical SC device. From GCD analysis, it is observed that at the start of the charging process, almost vertical curves are generally observed in the GCD curve of nickel sulfide.13 Furthermore, the GCD curve shows a plateau line in the charge process revealing the redox process of the nickel sulfide. The triangle shape of charge–discharge curves confirm the excellent capacitive behavior of the FSS-SC device. Fig. 6(g) shows GCD curves of the above mentioned two devices at a constant current of 1.2 mA. The higher potential window and higher discharge time of the symmetric FSS-SC device provides a higher Cs as compared to the electrochemical SC. Fig. 6(h) depicts the graph of Cs versus current density of the symmetric FSS-SC device and the electrochemical SC device. The performance difference between these two devices shows that the FSS-SC has the ability to store more electrical energy than the electrochemical SC device. The symmetric FSS-SC device achieved a Cs of 98 F g−1 at a current density of 1.2 mA. This is due to a lower ion diffusion matrix, whereas the PVA-KOH gel electrolyte can prevent the chemical dissolution of NiS by reducing the water content of electrolyte. Moreover, the PVA-KOH electrolyte acts as an elastic coating which is useful for avoiding structure crushing, favorable for the mechanical strength of nickel sulfide. Fig. 6(i) illustrates the Ragone plots of these two devices, which displays a comparison between the performances of the high and low SPD of the devices. The positions of the SED and SPD values of these two devices confirm the supercapacitive nature of the NiS electrode. The Nyquist plot for the symmetric FSS-SC and electrochemical SC device in the frequency range of 100 mHz to 1 MHz at an AC amplitude of 10 mV is shown in Fig. 7(A and C), while figure insets show equivalent circuit and magnified Nyquist plots. At the higher frequency region, the small semicircle indicates that the charge is transferred at the NiS electrode and the PVA-KOH polymer gel electrolyte interface due to redox reactions.36–39 Equivalent series resistance (ESR) (R1) for the symmetric FSS-SC and electrochemical SC of 0.23 and 0.76 Ω, respectively, are observed due to the combination of the ionic resistance of the PVA-KOH electrolyte and the aqueous 2 M KOH electrolyte. The semicircle illustrates the combination of Rct and pseudocapacitance (C1), which appears due to the surface roughness and conductivity difference between the electrode and electrolytes. Total Rct values of 0.22 and 0.15 Ω are observed. More importantly, a line at nearly 45° in the mid frequency range relative to the diffusion ions in the NiS electrode is denoted as the Warburg constant (W). Fig. 7(B and D) illustrates the Bode plots of the symmetric FSS-SC and electrochemical SC devices in which the phase angle rises up to −78.15 and −37.56, respectively, demonstrating the capacitive behavior, supporting the Nyquist plot results. The higher difference in phase angle indicates the capability of the symmetric FSS-SC device over the electrochemical SC device. Fig. 8(A and B) depicts the imaginary (C′′im) and real (C′r) parts of capacitance. This higher frequency region manifests a plateau line indicative of the capacitive behavior of the symmetric FSS-SC and electrochemical SC devices. To prove that a gel electrolyte can increase the mechanical stability as well as reduce the chemical dissolution of NiS, further cycling performance tests for the symmetric FSS-SC and aqueous electrochemical SC devices were performed for 3000 CV cycles. Fig. 8(C and D) shows long term electrochemical stability of the symmetric FSS-SC and electrochemical SC devices for 3000 CV cycles. The area under the CV curve is slightly reduced after 3000 CV cycles, denoting degradation of the electroactive material during the charging-discharging process. The capacity retention after 3000 CV cycles for the symmetric FSS-SC and electrochemical SC devices is about 85.3% and 61.5%, respectively. The comparative electrochemical stability plots of the symmetric FSS-SC and electrochemical SC are represented in Fig. 8(E). The result shows that the supercapacitive performance of the symmetric FSS-SC device is better than the electrochemical SC device. Furthermore, the impact of bending on the flexible SC device is studied at different bending angles. Fig. 8(F) shows CV curves for the symmetric FSS-SC device for different bending angles. The result displays no larger change in the area under the CV curves, indicating that there is less impact of bending of the device on the supercapacitive performance. This proves the flexibility of the symmetric FSS-SC device without reducing the performance. Fig. 9 shows the Cs values at different bending angles of the device. The inset image shows actual images of the device at different bending angles. There is a slight change in the supercapacitive performance of the device at different bending angles. The actual demonstration of the fabricated symmetric FSS-SC device is shown in Fig. 10(a and b). The device is charged for 20 s, and during discharging the red light emitting diode (LED) glows up to 30 s. This confirms the scope of the NiS electrode in future supercapacitor electrode materials. From all the above mentioned results, the final conclusion is that the symmetric FSS-SC device is better than the electrochemical SC device. Furthermore, the drawbacks, such as leakage of the aqueous electrolyte, inflexibility, difficulty in maintaining cost, inconvenience in fabrication and maximum space requirements, of the electrochemical SC motivate toward the fabrication of the FSS-SC device.
![]() | ||
Fig. 10 Digital images of the actual demonstration of the symmetric FSS-SC device with the glow of a red LED at (a) 0 s and (b) 30 s. |
This journal is © The Royal Society of Chemistry 2016 |