Preparation and characterization of lignin demethylated at atmospheric pressure and its application in fast curing biobased phenolic resins
Jiongjiong Li,
Wen Wang,
Shifeng Zhang,
Qiang Gao,
Wei Zhang* and
Jianzhang Li*
MOE Key Laboratory of Wooden Material Science and Application, Beijing Key Laboratory of Wood Science and Engineering, Beijing Forestry University, 35 Qinghua East Road, Haidian District, Beijing 100083, P. R. China. E-mail: zhangweishe@126.com; lijzh@bjfu.edu.cn; Fax: +86-10-62336912; Fax: +86-10-62338083; Tel: +86-10-62336912 Tel: +86-10-62338083
First published on 11th July 2016
Abstract
Agricultural crop-based lignin was utilized to modify phenol-formaldehyde (PF) resin to prepare fast curing biobased phenolic resins by copolymerization. Prior to the reaction, four types of demethylation reagents were used at atmospheric pressure to sever the methoxy bonds of lignin to increase its reactivity. The chemical and structural changes of the lignin molecule were analyzed using Fourier transform infrared (FT-IR) spectroscopy and 1H-NMR. The analytical results revealed that the methoxyl groups of lignin were transformed by the demethylation reagents into phenolic hydroxyl groups. FT-IR and liquid state 13C-NMR analysis revealed that lignin demethylated by Na2SO3 resulted in more phenolic-OH groups on the molecule and higher molecular reactivity. The influence of demethylation on the properties of biobased phenolic resin was also investigated. The increased quantity of hydroxyl groups resulting from lignin demethylation caused higher curing rate of the biobased phenolic resin. These results were confirmed by the improved bond strength and lower formaldehyde emissions of plywoods bonded with biobased phenolic resins.
1. Introduction
The global demand for products derived from petroleum-based chemicals illustrates the strong dependence on materials made from non-renewable raw material sources. In response to the awareness of global warming and gradual depletion of fossil fuels, the effective utilization of renewable raw materials as a source of chemicals, materials and energy has received increased attention.1,2 Lignocellulosic biomass from agricultural crop sources has been acknowledged as the most abundant renewable feedstock for value-added biomaterials, biochemicals and biofuels.3 Massive amounts of lignin are produced annually, mainly as the byproduct of industrial pulping processes. However, efficient utilization of lignin remains a great challenge, because of its relatively low reactivity.3–5Phenol-formaldehyde (PF) resins, which are generally synthesized using petro-chemicals such as phenol and formaldehyde under alkaline catalysts, have been widely used in plywood industry due to their high mechanical strength, remarkable water resistance and excellent thermal stability.6–8 The ongoing shortage of petroleum and the rapidly rising cost of petro-chemicals have restricted broad applications of these useful resins. Therefore, an increasing focus has been placed on the use of low-cost, renewable raw materials as substitutes for petroleum-based sources.9–11
Lignin is an amorphous three-dimensional phenyl-propanol polymer composed of phenyl-propanoid units (Fig. 1); namely, p-coumaryl alcohol, coniferyl alcohol and sinapyl alcohol. These phenyl-propanols are linked primarily by enormous amounts of ether and carbon–carbon linkages.1,12,13 Many research efforts have been conducted on the utilization of lignin as a phenol substitute in the synthesis of PF resins, because its chemical structure is similar to phenol.14–17 However, direct utilization of lignin without pretreatment is always a challenge, due to the lower reactivity of lignin. This results from the few reactive sites on the molecule and the strong steric hindrance at these sites. Therefore, chemical pretreatment of lignin to enhance its reactivity is necessary and essential for it to be reactive.8,18 Many lignin modification strategies have been studied including demethylation,19,20 methylolation,7,11 phenolation8,21 and hydrothermal de-polymerization/liquefaction.18,22 The number of reactive sites on the lignin molecular structure cannot be significantly increased by methylolation, so the increase in reactivity is minimal.8 Phenolation is the so called “catch all” pathway, which utilizes raw lignin without purification.7,23 Demethylation is the most effective method to enhance the reactivity of lignin through removal of methoxyl groups, generating catechol moieties in the macromolecule.20,24 Researchers have also showed that demethylation can improve the abundance of hydroxyl groups in lignin.19,25
Lignin demethylation by biological means, such as fungal demethylation (white rot fungi or brown rot fungi) and bacteria demethylation (Pseudomonas or Sphingomonas), has been studied for decades.20,26–28 However, the notion that this process will inevitably degrade lignin to small molecules and the ability of laccase to degrade lignin without mediators has been in doubt.29,30 Sulfur-mediated demethylation of lignin has also been reported.24 Previous work has indicated that, after demethylation, the number of methoxyl group decreased from 10.39% to 6.09%, while the content of phenolic hydroxyl groups and carboxyl groups increased from 2.98% and 4.58% to 5.51% and 7.10%.31 It has been reported that pretreatment with sodium ethanethiolate (NaSEt) can reduce the methoxyl content of lignin.32 Nevertheless, the stringent requirements for reaction conditions and reactors have hindered the industrial application of this reported pretreatment method. Temperatures of up to 225 °C (ref. 31) and long processing times of up to 6 h (ref. 33) are required for these demethylation methods to be effective. The reactors must be capable of high pressure, which requires significant capital investment. Consequently, the preparation time and processing costs will be increased significantly. Therefore, it is desirable to develop a cheaper, efficient method to demethylate lignin to produce biobased phenolic resins.
Previous research indicated that sulfur-mediated demethylation reagents, such as sulfur (S),24 hydrogen sulfide (H2S),31 and NaHSO3,19 were effective in the demethylation of lignin. Other demethylation reagents, such as amine hydrohalide salt, have also been reported.24 However, because of the stringent requirements for reaction conditions and reactors, most of these methods never reached industrial application and have rarely attracted attention.7 Therefore, in this article, lignin was demethylated at atmospheric pressure using four types of sulfur-mediated demethylation reagents (S, NaSH, Na2SO3, n-dodecyl mercaptan) and this procedure was followed by the synthesis of fast curing demethylated lignin-phenol-formaldehyde (DLPF) resins. The chemical and structural changes of the demethylated lignin (DL) were detected using Fourier transform infrared (FT-IR) spectroscopy and 1H-NMR. The structural and thermal properties of DLPF resins were characterized by FT-IR, 13C-NMR, and thermo gravimetric analyzer (TGA). The effects of the demethylation reagents on the curing properties of the DLPF resins and the properties of plywood bonded with DLPF resins were also investigated. This work focused on investigating the relationship between the molecular structure of demethylated lignin and the bond strength of fast curing biobased DLPF resins.
2. Experimental section
2.1. Materials
Soda lignin (L) which purchased from Xinyi Feihuang Chemical Co., Ltd. (Jiangsu, China). Phenol, formaldehyde (aqueous solution, 37 wt%) and sodium hydroxide (NaOH) were AR grade reagents purchased from Beijing Chemical Reagents Co., Ltd. (China). Solid urea was an industrial-grade reagent obtained from Lanyi Chemical Co., Ltd. (China). Powdered sulfur (S, 99 wt%), sodium hydrosulfide (NaSH, 70 wt%), sodium sulfite (Na2SO3, 97 wt%) and n-dodecyl mercaptan (98 wt%) were provided by Guangdong Xilong Chemical Factory, China. NaOH solution with the concentration of 50 wt% was prepared for further use.2.2. Demethylation of lignin
The DL products, such as DL-S, DL-NaSH, DL-Na2SO3, DL-mercaptan (S, NaSH, Na2SO3, n-dodecyl mercaptan being demethylation reagent), were prepared by nucleophilic substitution reaction at atmospheric pressure. The demethylation reagent concentration (weight ratio of demethylation reagent to the weight of lignin) was 10%. For the demethylation process, 46.2 g H2O, 46.2 g lignin, and 4.62 g demethylation reagent were mixed in a 100 ml flask, and then 4.62 g solid NaOH (weight ratio of solid NaOH to the weight of lignin was 10%) was added to promote the dissolution of lignin. The mixture solution was heated at 90 °C, stirring in 1000 rpm, for 60 min, and then cooled to 40 °C. The pH of the mixture solution was adjusted with hydrochloric acid solution (1%) to 2.0, and then the demethylated lignin precipitated from the mixture. The obtained demethylated lignin were then separated from the solution by centrifugation (2500 rpm for 10 min), followed by washing with distilled water until neutral. After drying in a vacuum oven at 40 °C (−0.1 MPa, 24 h), the DL products were obtained and stored in a refrigerator before characterization.2.3. Preparation of lignin-phenol-formaldehyde (LPF) resin
The LPF resin was synthesized by batch polymerization according to the molar ratio of phenol together with lignin to formaldehyde was 1![[thin space (1/6-em)]](https://www.rsc.org/images/entities/char_2009.gif) :
:![[thin space (1/6-em)]](https://www.rsc.org/images/entities/char_2009.gif) 2.2.7 30% phenol was substituted by lignin according to previous research.7 In the first step, 108 g phenol, 46.2 g lignin, 100.8 g formaldehyde solution (37 wt%), 61.2 g H2O and 4.62 g solid NaOH were mixed in a 300 ml flask. This mixture was heated for 60 min at 80 °C. In the second step, 67.2 g formaldehyde solution and 10.8 g NaOH solution (50 wt%) was added to the flask and heated for 60 min at 80 °C. In the third step, 10.8 g NaOH solution and 78 g formaldehyde solution were added to the flask which was heated for 60 min at 80 °C. In the fourth step, 8.4 g urea and 23.4 g NaOH solution were added to the flask, which was heated for 15 min at 70 °C. And then the reaction mixture was rapidly cooled to 40 °C to yield LPF resin without any further purification or filtration.
2.2.7 30% phenol was substituted by lignin according to previous research.7 In the first step, 108 g phenol, 46.2 g lignin, 100.8 g formaldehyde solution (37 wt%), 61.2 g H2O and 4.62 g solid NaOH were mixed in a 300 ml flask. This mixture was heated for 60 min at 80 °C. In the second step, 67.2 g formaldehyde solution and 10.8 g NaOH solution (50 wt%) was added to the flask and heated for 60 min at 80 °C. In the third step, 10.8 g NaOH solution and 78 g formaldehyde solution were added to the flask which was heated for 60 min at 80 °C. In the fourth step, 8.4 g urea and 23.4 g NaOH solution were added to the flask, which was heated for 15 min at 70 °C. And then the reaction mixture was rapidly cooled to 40 °C to yield LPF resin without any further purification or filtration.
2.4. Preparation of DLPF resins
The DLPF resins, such as DLPF-S, DLPF-NaSH, DLPF-Na2SO3, DLPF-mercaptan, were prepared by batch copolymerization of phenol, lignin and formaldehyde in a molar ratio of 1![[thin space (1/6-em)]](https://www.rsc.org/images/entities/char_2009.gif) :
:![[thin space (1/6-em)]](https://www.rsc.org/images/entities/char_2009.gif) 2.2; here the substitution rate of lignin was 30%. In the first step, 108 g phenol, 46.2 g DL product, 100.8 g formaldehyde solution, 15 g H2O and 4.62 g solid NaOH were mixed in a 300 ml flask. The rest of the synthesis processes were the same as those for LPF resin.
2.2; here the substitution rate of lignin was 30%. In the first step, 108 g phenol, 46.2 g DL product, 100.8 g formaldehyde solution, 15 g H2O and 4.62 g solid NaOH were mixed in a 300 ml flask. The rest of the synthesis processes were the same as those for LPF resin.
2.5. Preparation of PF resin
The PF resin was prepared by batch copolymerization using a phenol formaldehyde mixture with a molar ratio of 1![[thin space (1/6-em)]](https://www.rsc.org/images/entities/char_2009.gif) :
:![[thin space (1/6-em)]](https://www.rsc.org/images/entities/char_2009.gif) 2.2. The NaOH concentration in this mixture (weight ratio of NaOH to the weight of phenol and lignin together) was 20%. The process was executed in three steps. In the first step, 218 g phenol and 158.8 g formaldehyde solution were mixed in a 300 ml flask and the mixture was heated for 50 min at 87 °C. In the second step, 130.2 g formaldehyde solution and 22.2 g NaOH solution was added to the flask and the mixture was again heated for 60 min at 87 °C. In the third step, 130.2 g formaldehyde solution and 22.2 g NaOH solution was added to the same flask, which was then heated for 50 min at 87 °C. In the fourth step, 28.8 g urea and 63.2 g NaOH solution were added to the flask, which was then heated for 30 min at 87 °C. The final mixture was heated for another 30 min at 87 °C and the reaction mixture was then rapidly cooled to 40 °C to yield the PF resin.
2.2. The NaOH concentration in this mixture (weight ratio of NaOH to the weight of phenol and lignin together) was 20%. The process was executed in three steps. In the first step, 218 g phenol and 158.8 g formaldehyde solution were mixed in a 300 ml flask and the mixture was heated for 50 min at 87 °C. In the second step, 130.2 g formaldehyde solution and 22.2 g NaOH solution was added to the flask and the mixture was again heated for 60 min at 87 °C. In the third step, 130.2 g formaldehyde solution and 22.2 g NaOH solution was added to the same flask, which was then heated for 50 min at 87 °C. In the fourth step, 28.8 g urea and 63.2 g NaOH solution were added to the flask, which was then heated for 30 min at 87 °C. The final mixture was heated for another 30 min at 87 °C and the reaction mixture was then rapidly cooled to 40 °C to yield the PF resin.
2.6. Preparation of plywood
Samples of the three-layer plywoods (400 mm × 400 mm × 6 mm) were prepared from poplar veneers. Both sides of the poplar veneer were coated with 250–300 g m−2 of adhesive. The glued plywood samples were then hot-pressed at 130 °C at 1.0 MPa for 7 min and stored at ambient conditions for 24 h prior to shear strength testing.2.7. FT-IR analysis of L, DL, PF, LPF and DLPF resins
The phenolic resins and DL samples were freeze-dried by placing them in a vacuum freeze-drier (Sihuan LGJ-25C, Sihuan Co., Ltd, Beijing, China) for 48 h, followed by sieving of the material through a 200-mesh screen. The freeze dried samples were combined with KBr powder and pressed into pellets for testing. FT-IR spectra of the freeze-dried DL, PF, LPF and DLPF resins were obtained using in a Nicolet (USA) IS10 instrument at resolution of 4 cm−1. Each spectrum was recorded in the frequency range of 600–4000 cm−1.2.8. Liquid state 13C-NMR analysis of PF, LPF and DLPF resins
The solid state CP MAS (cross-polarization magic-angle-spinning) 13C-NMR spectra of the freeze-dried PF, LPF and DLPF resins were acquired at ambient temperature using a Bruker 400 spectrometer (Bruker, Switzerland) at a frequency of 100 MHz and at a contact time of 3 ms. Chemical shifts were determined relative to tetramethyl silane (TMS), which was used as a control. The acquisition time was of 0.01 s with approximately 6000 transients. All the spectra were acquired with a relaxation delay of 1.0 s and a spectral width of 100![[thin space (1/6-em)]](https://www.rsc.org/images/entities/char_2009.gif) 000 Hz.
000 Hz.
2.9. 1H-NMR analysis of L and DL
In this analysis, DL products were subjected to acetylation in order to enhance their solubility in CDCl3, and then 0.01 g of p-nitrobenzaldehyde, which was used as internal standard, and 0.1 g of acetylated DL samples were dissolved in CDCl3. The liquid state 1H-NMR spectra were obtained at room temperature with a Bruker Avance III 500 MHz NMR spectrometer at a frequency of 300 MHz with an acquisition time of 3.0 s.2.10. Characterization of the plywood
The shear strength of the plywood was measured in accordance with the China National Standards (GB/T 9846.3-2004). For this test, eight plywood specimens (25 mm × 10 mm) which were cut from each plywood panels were submersed in boiling water for 3 h according to the China National Standards (GB/T 9846.3-2004), and then dried at room temperature for 10 min before the shear strength testing. The speed of the cross head was 5.0 mm min−1. Formaldehyde emissions were measured using the acetylacetone method.7 For this test, ten plywood specimens with the dimension of 15 cm × 5 cm were placed into a 10 liter glass desiccator that contained 300 ml of distilled water. The desiccator was kept at 20 °C for 24 h and then the concentration of formaldehyde absorbed in the distilled water was determined by the acetylacetone method with the ultraviolet spectrophotometer (UV) at a wavelength of 412 nm.2.11. Gel time of PF, LPF and DLPF resins
The gel time of the phenolic resins was determined according to Chinese National Standard (GB/T 14074.3-2006). 5 g sample of the resin to be tested was placed into a 16 mm × 160 mm test tube and maintained in an oil bath at 130 °C. Next, a thin wire spring was used to manually mix the sample until gelation occurred.2.12. TGA analysis of PF, LPF and DLPF resins
Thermogravimetric analysis of the freeze-dried PF, LPF and DLPF resins was performed using a Q50 TGA analyzer (TA Instruments, USA) in a nitrogen atmosphere (flow rate = 40 ml min−1) and at a temperature range from room temperature to 700 °C with a heating rate of 20 °C min−1.3. Results and discussion
3.1. Chemical structure of L, DL, and phenolic resins
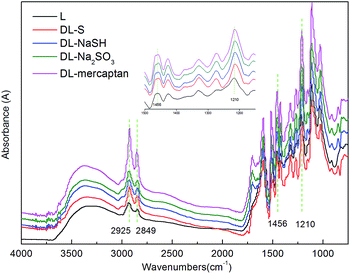
A wide range of absorption bands appeared at 3400 cm−1, which were attributed to the aromatic and aliphatic OH groups. The bands at 2925 and 1456 cm−1 were assigned to C–H vibration of CH2 and CH3 groups, while the C–H vibration of –OCH3 groups was exhibited by the band of 2849 cm−1.36 Guaiacyl and syringyl ring breathing with the C–O stretching vibration of the phenolic C–OH and phenolic C–O(Ar) are represented by the band of 1210 cm−1. The C–O stretching vibration band of the aliphatic C–OH, aliphatic C–O(Ar) and methylol C–OH in syringyl type of lignin appeared at 1030 cm−1. The aromatic C–H out of plane deformation vibration in the guaiacyl moiety of lignin can be seen at 855 cm−1.36
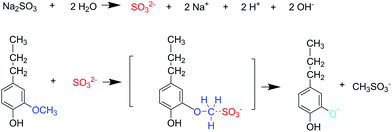
The ortho positions to the aromatic hydroxyl in the nine-carbon unit of lignin were substituted by one or two –OCH3 groups, hence the reactivity of the free hydroxyl group was hindered. If the –OCH3 groups could be removed and demethylated, then the DL products would have far more free phenolic groups and its reactivity would be significantly improved.24 Some researchers have indicated that when the –OCH3 groups of lignin were attacked by nucleophiles such as SO32−, S and HS−, the –OCH3 groups will be removed by a nucleophilic substitution reaction generating DL with a lower content of –OCH3 groups and higher content of phenolic-OH groups.19,24,31 The reaction mechanism for demethylation process is shown in Fig. 3. A semiquantitative analysis method37,56 was adopted to analyze the structural changes of lignin demethylated using different demethylation reagents. The aromatic skeletal vibrations occur at 1600 cm−1, which were consistent in each reaction system and unaffected by catalyst reaction. Thus, bands at 1600 cm−1 were used for normalization and their intensity was set to 1.000. For instances, the ratio of absorption value of 2849 cm−1 (variable)/1600 cm−1 (constant) was calculated to indicate the degree of –OCH3 groups in lignin. These results are presented in Table 1. As shown in Table 1, it could be found that L had a higher content of –OCH3 groups (2849 cm−1) and a lower content of phenolic-OH groups (1210 cm−1) than DL. It was because all the demethylation reagents were effective in the demethylation of lignin. It was also found that DL-Na2SO3 had a lower content of –OCH3 groups (2849 cm−1) and a higher content of phenolic-OH groups (1210 cm−1) and aliphatic-OH groups (1030 cm−1) than other DL. This was due to conversion of the –OCH3 groups into hydroxyl groups during the demethylation of lignin using Na2SO3 as the demethylation reagent, which resulted in enhanced lignin reactivity. Researchers have indicated that phenolic-OH group can activate the free ring positions in lignin making them more reactive with formaldehyde. This confirms that the phenolic-OH is the most important functional group in the preparation of phenolic resins.7,38,39 However, other researchers have found that a large amount of phenolic-OH groups presented in lignin structure can cause it to behave like a crowded and stiff macromolecule producing poor properties.40,41 By contrast, lignin has a higher total content of phenolic-OH and aliphatic-OH groups, which are more suitable for the synthesis of LPF resins.7,42
| Wave number cm−1 | Absorbance relative value | Assignments | ||||
|---|---|---|---|---|---|---|
| L | DL-S | DL-NaSH | DL-Na2SO3 | DL-mercaptan | ||
| a ν: stretching vibration, δ: deformation, ip: in-plane, am: asymmetric. | ||||||
| 1030 | 1.148 | 1.450 | 1.728 | 1.841 | 1.768 | ν(–OH) |
| 1210 | 1.230 | 1.476 | 1.828 | 1.935 | 1.912 | ν(–OH) |
| 1456 | 1.230 | 1.016 | 1.204 | 1.241 | 1.260 | δ am(C–H) |
| 1600 | 1.000 | 1.000 | 1.000 | 1.000 | 1.000 | ν(C![[double bond, length as m-dash]](https://www.rsc.org/images/entities/char_e001.gif) C) C) |
| 1700 | 0.774 | 0.379 | 0.564 | 0.607 | 0.572 | ν(C![[double bond, length as m-dash]](https://www.rsc.org/images/entities/char_e001.gif) O) O) |
| 2849 | 0.789 | 0.537 | 0.508 | 0.504 | 0.650 | ν(C–H) |
| 2925 | 0.898 | 0.643 | 0.611 | 0.608 | 0.860 | ν ip(–CH2–) |
| 3360 | 0.953 | 0.518 | 0.540 | 0.512 | 0.486 | (–OH) |
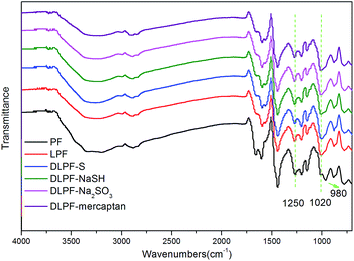
The FT-IR spectra (Fig. 4) of the samples obtained after freeze-drying were obtained to determine what structural changes took place in PF, LPF and DLPF resins during their demethylation reaction. The results indicated that the LPF and DLPF resins exhibited FT-IR spectra that were similar to the spectrum of the PF resin. This indicated that these molecules share a common molecular structure which was in agreement with previous reports.1,11
All the phenolic resins exhibited absorption bands at 1600, 1500 and 1450 cm−1, which were related to the aromatic ring vibrations of the phenyl-propane skeleton.43,44 The C–O stretching vibration of aliphatic C–O(Ar), aliphatic C–OH and methylol C–OH were represented by the band of 1020 cm−1.7 Due to the presence of methylol-OH and aliphatic-OH in LPF and DLPF resins, which was added by lignin, the 1020 cm−1 bands of LPF and DLPF resins were broader than this in the PF resin. The band at 980 cm−1 was related to C–H stretching vibration of vinyl in PF resin, which is absent in the spectra of LPF and DLPF resins. The peak at 1250 cm−1 observed in the spectrum of the LPF resin was weaker than that of the PF resin, indicating more C–O stretching vibration of the phenolic-OH groups in the PF resin than in the LPF resin. This was because partial phenol was substituted by lignin containing both a phenolic unit and non-phenolic unit in the LPF resins resulting in lower phenolic-OH group content.7 The absorption band in the spectrum of the DLPF resin at 1250 cm−1 exhibited stronger intensity than that of the LPF resin, indicating more phenolic-OH groups in the DLPF resins than in the LPF resin. This was because the methoxy groups were converted into hydroxyl groups by a nucleophilic substitution reaction,19 indicating that the demethylation catalysts had a positive effect on the demethylation reaction of lignin.
From the FT-IR analysis, it can be concluded that the content of phenolic-OH group increased in the DLPF resins, which was caused by the transformation of methoxy groups into hydroxy groups. Furthermore, the DL-Na2SO3 had a higher content of phenolic-OH groups, indicating that the Na2SO3 was a promising demethylation reagent for use in the demethylation of lignin.
![[thin space (1/6-em)]](https://www.rsc.org/images/entities/char_2009.gif) :
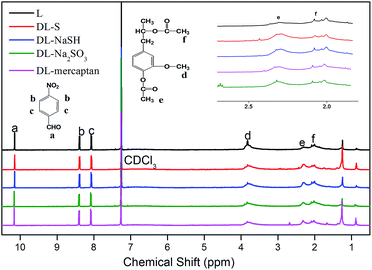
:![[thin space (1/6-em)]](https://www.rsc.org/images/entities/char_2009.gif) S, give an intense proton signal at around 3.8 ppm. As previous reports12,36,45 have indicated acetylation of lignin produces derivatives that display broad proton signals in regions that are slightly interfered by other hydrogen signals. In addition, the aromatic and aliphatic acetyl groups were shifted slightly (2.29 and 2.04 ppm, respectively), giving rise to separate peaks.
S, give an intense proton signal at around 3.8 ppm. As previous reports12,36,45 have indicated acetylation of lignin produces derivatives that display broad proton signals in regions that are slightly interfered by other hydrogen signals. In addition, the aromatic and aliphatic acetyl groups were shifted slightly (2.29 and 2.04 ppm, respectively), giving rise to separate peaks.
Some obvious differences can be observed in Fig. 5. Compared with lignin, the proton signal intensity at 3.8 ppm decreased with the addition of demethylation reagents, as a portion of the methoxy groups were converted to phenolic-OH groups, which was further confirmed by the increased proton signal intensity at 2.29 ppm. The spectra of DL-S, DL-NaSH and DL-mercaptan showed higher proton signal intensity at 3.8 ppm than DL-Na2SO3, which was due to the content of the methoxyl groups in DL-Na2SO3, which was lower than that in other DL. These observations were consistent with the FT-IR results, where DL-Na2SO3 showed a lower methoxyl group content at the peak of 2849 cm−1 and higher phenolic-OH group content at 1210 cm−1 band.
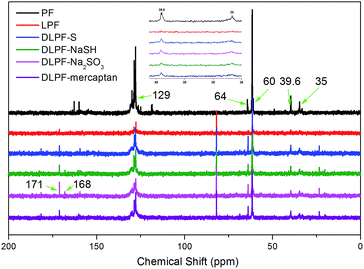
The liquid state 13C-NMR spectra of the various freeze-dried PF, LPF and DLPF resins are shown in Fig. 6. The 13C-NMR spectra of LPF and DLPF resins were similar to that of PF resin, indicating that the LPF and DLPF resins exhibited molecular structure similar to the PF resin, which agreed with the FT-IR data. The dominant peaks at around 129 ppm were assigned to the substituted ortho and para carbon sites on aromatic ring.7,46 For all the phenolic resins, the intensity of the peak at 35 ppm, ascribed to the para–para methylene bridges between phenolic units, was lower than that at the peak of 39.6 ppm, which belonged to the para–ortho methylene bridges between phenolic units. The intensity of methylol group on the ortho positions of phenolic-OH at 60 ppm was higher than that of methylol group on the para positions of phenolic-OH at 64 ppm.11,47 This can be ascribed to the reactivity of the aromatic hydrogen at the ortho position of the phenolic-OH, which was lower than that at the para position.
Some differences between PF resin and LPF resins can be observed in Fig. 6. The peak at 181 ppm and 81 ppm in LPF and DLPF resins were assigned to carbon of γ-position carbonyl on the lignin side chain and Cβ associated with β-O-4 bands.7,48 Compared to the PF resin, the carbon related to carbonyl in the acetates of alcohols and phenol, reflected the concentration of phenolic and alcoholic groups in lignin as shown by signals at 171 ppm and 168 ppm in the LPF and DLPF resins.49 The fact that the aromatic acetate signal of the DLPF resins was larger than that of LPF resin resulted, because the DLPF resin had more free phenolic-OH groups than the LPF resin. DLPF-Na2SO3 resin showed higher band intensity (171 ppm and 168 ppm) than the other DLPF resins, which was due to the content of the free phenolic-OH groups in the DLPF-Na2SO3 resin, which was higher than that in the other DLPF resins. These results indicated that Na2SO3 had a positive effect on the demethylation of lignin, which was consistent with the FT-IR data. The peak around 115–118 ppm was ascribed to the unsubstituted active sites in the aromatic ring and was significantly decreased in the LPF and DLPF resins. This may have been caused by the decreased content of the active sites in the LPF and DLPF resins due to the incorporation of lignin.47 Examination of the spectrum of the DLPF resin shows that the para–ortho methylene bridges (39.6 ppm) and para–para methylene bridges (35 ppm) between phenolic units exhibit stronger intensity peaks than in the LPF resins. This is also true of the methylol groups in the DLPF resins on the ortho (60 ppm) and para (64 ppm) positions of phenolic-OH. This phenomenon can be ascribed to the higher degree of copolymerization of the DLPF resins than the LPF resin, which was caused by the improved reactivity of the DL.
3.2. Performance of plywoods
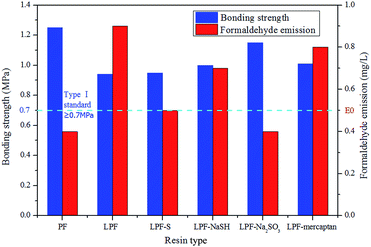
Fig. 7 depicts the results of the bond strength tests of the resins (determined after boiling the plywood samples for 3 h) and the formaldehyde emissions from plywood bonded with these resins. The plywood bond strength of the LPF resin was lower than PF resin and the formaldehyde emission was higher, because more ash and carbohydrates were present in LPF resin. The remained ash and carbohydrates in soda lignin were introduced into LPF resin with the addition of lignin, and the remained carbohydrates would reduce the water resistance of the cured LPF resin and produced more formaldehyde during the hot-pressing process.10 Therefore it could explain why LPF resin exhibited lower bond strength and higher formaldehyde emission than PF resin. In addition, the reactivity of the phenol was higher than the lignin in this resin. This occurred because phenol has three active sites (two ortho and one para) available for polymerization, while there are two or less active sites in lignin.50 Also, there is far greater steric hindrance in the large lignin molecule, which can further adversely affect the polycondensation reaction.51 When 30% phenol was substituted with lignin in the resin mixture, the bond strength of the LPF resins decreased from 1.25 MPa to 0.94 MPa, but still met the 0.7 MPa standard for exterior-grade plywood panels.Compared to the LPF resin, the bond strength of the plywoods bonded with the DLPF resins was higher. This was a result of the higher reactivity of the DL products, which means that the demethylation reagents accelerated the removal of the methoxyl groups in the lignin, thereby generating an abundance of hydroxyl groups. This can be confirmed by the FT-IR analysis, where DLPF resins showed higher content of phenolic-OH groups (1250 cm−1) than the LPF resin. It should be mentioned that the bond strength of DLPF-Na2SO3 resin was higher than that of the other DLPF resins, and the formaldehyde emission from the plywood bonded with DLPF-Na2SO3 resin was below 0.5 mg l−1, which met the E0 grade and was close to that of the PF resin. It was assumed that the reactivity of the DL products in the addition reaction with formaldehyde was significantly improved when the lignin was demethylated by Na2SO3, which can be confirmed by the FT-IR and NMR data. With this increase in the degree of demethylation, the DLPF resins fully cured, resulting in less formaldehyde monomer being released from the bonded plywood.
3.3. Gel time analysis of PF, LPF, and DLPF resins
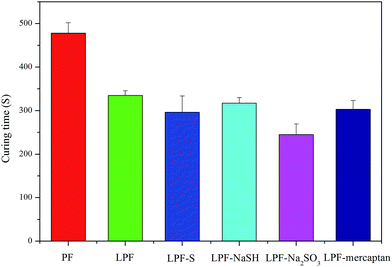
Fig. 8 shows the gel time of various phenolic resins. Gel time is generally defined as the time required for the prepolymer to transform from a disorganized liquid into a 3-dimensional macromolecular structure under specified conditions. Consequently, this parameter can be used as an indicator of the curing rate and molecular reactivity of the phenolic resins.7 With a 30 wt% substitution of phenol in the lignin, the gel time of the LPF and DLPF resins was decreased indicating a faster curing rate. Researchers have reported that higher molecular weight can result in the shorter gel times,52 hence the LPF and DLPF resins would cure faster than the PF resin due to the higher MW of lignin over phenol.11 With the addition of the demethylation catalysts as the nucleophiles, the partial methoxyl groups of lignin were converted into hydroxyl groups, which will increase the degree of hydroxymethylation of the phenolic resins and subsequently their reactivity, which resulted in a shorter gel time for the DLPF resins as shown in Fig. 8. It was encouraging that the gel time of the DLPF-Na2SO3 resin was decreased to half that of the PF resin, which was the shortest gel time of the modified resins. Therefore, in addition to the curing rate, the molecular reactivity of the resins was increased by addition of a demethylation reagent forming more cross-links, which was supported by the values of the bond strength and formaldehyde emission.3.4. Thermal behavior of phenolic resins
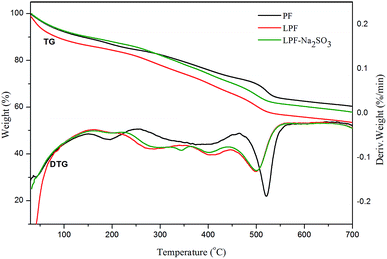
The thermal decomposition and thermal stability of the phenolic resins were determined using TGA analysis under nitrogen atmosphere. The TGA curves revealed the weight loss of substances in relation to the temperature of thermal degradation, while the first derivative of that curve (DTG) shows the corresponding rate of weight loss. The peak of this curve (Tmax) can be expressed as the maximum thermal decomposition temperature during various thermal events, which can be used to compare the thermal stability characteristics of different polymers.36,53 The TGA-DTG curves of PF, LPF and DLPF-Na2SO3 resins are shown in Fig. 9, and the Tmax during different thermal events of the phenolic resins as well as the weight residues at 700 °C are given in Table 2.| Resin | First thermal event Tmax (°C) | Second thermal event Tmax (°C) | Third thermal event Tmax (°C) | Weight residue (%) |
|---|---|---|---|---|
| PF | 196 | 402 | 520 | 60.4 |
| LPF | 199 | 401 | 498 | 53.4 |
| DLPF-Na2SO3 | 206 | 404 | 502 | 57.8 |
From the TGA-DTG thermograms, it can be seen that the curves can be divided into three main regions, which are related to the three degradation steps (postcuring, thermal reforming and ring stripping) of phenolic resins.11 The initial stage is in the range of 150–250 °C. The mass loss here was due to the evaporation of formaldehyde, phenol and water, which was generated by condensation reaction of the methylol groups.53,54 The second thermal event occurred in the range of 250–450 °C. The mass loss here was attributed to the loss of water, which was produced from the condensation reaction of phenolic-OH and methylene as well as that between two hydroxyl functional groups.11,21 The third event occurred in the range of 450–600 °C. The mass loss here arose from the elimination of hydrogen caused by the crosslinking of methylene with carbon–hydrogen crosslinks along with the release of carbon monoxide and methane formed by the degradation of methylene bridge.7,21,55
When 30 wt% phenol was substituted by lignin, the Tmax (199 °C) of LPF resin in the first thermal event was higher than that of the PF resin (196 °C). It can be seen that, compared to the LPF resin, DLPF-Na2SO3 resin had a higher Tmax (206 °C) and showed better thermal stability in the initial stage. This may be attributed to the fact that the methylol OH content of the DLPF-Na2SO3 resin was higher than that of the LPF resin, which was reflected by the results shown in the liquid 13C-NMR spectrum at 60 ppm and 64 ppm. In the second thermal event, the thermal degradation performance of the LPF and DLPF-Na2SO3 resins was similar to that of the PF resin. In the third thermal event, the PF resin exhibited better heat resistance than the LPF resin, because the Tmax and the weight residue at 700 °C were greater than that of the LPF resin. The DLPF-Na2SO3 resin exhibited better thermal resistance with a higher Tmax (502 °C) and lower weight residue (57.8%) at 700 °C compared to the LPF resin, which was close to the thermal stability of the PF resin.
From the TGA-DTG analysis, it can be concluded that the thermal stability of the LPF resin was higher than the PF resin in the initial stage. The PF resin demonstrated better heat resistance with the increase of temperature. The DLPF-Na2SO3 resin exhibited better thermal stability in the initial and final thermal events when compared to the LPF resin.
From the TGA-DTG analysis, it can be concluded that the thermal stability of the LPF resin was higher than the PF resin in the initial stage. The PF resin demonstrated better heat resistance with the increase of temperature. The DLPF-Na2SO3 resin exhibited better thermal stability in the initial and final thermal events when compared to the LPF resin.
3.5. Scale-up experiments of LPF resins as plywood adhesive
The LPF resins with lower reactivity have been reported in many literatures, and higher temperature would be needed to achieve a complete curing.7,57 To reach industrial application, further experiments would be needed. In this article, an atmospheric pressure and a mild temperature were used to prepare LPF resins. Therefore, compared to previous methods which needed high pressure and elevated temperature for the pretreatment of lignin, our approach has a promising prospect for large-scale application.4. Conclusions
Lignin was demethylated at atmospheric pressure to produce DLPF resins for application as plywood adhesives. Structural analysis of the DL by FT-IR and 1H-NMR confirmed the demethylation results as evidenced by the improved performance of plywood bonded with the DLPF resins and their shorter gel times. FT-IR and liquid state 13C-NMR analysis of the phenolic resins also indicated that the methoxy groups in lignin were successfully converted into hydroxy groups, which was confirmed by the increased content of phenolic-OH group in the DLPF resins. Furthermore, Na2SO3 proved to be very effective in the demethylation process of lignin. The DLPF-Na2SO3 resin exhibited better thermal stability when compared to the LPF resin.These results indicate that the DLPF-Na2SO3 is a promising candidate for use as a fast curing biobased phenolic resin for application in the exterior-grade plywood industry.
Acknowledgements
This work was supported by the Special Fund for Forestry Research in the Public Interest (Project 201504502), the Chinese National Science and Technology Support Program (2015BAD14B03), and China Postdoctoral Science Foundation Funded Project (2015M570039).References
- M. Alekhina, O. Ershova, A. Ebert, S. Heikkinen and H. Sixta, Ind. Crops Prod., 2015, 66, 220–228 CrossRef CAS.
- M. Kuroe, T. Tsunoda, Y. Kawano and A. Takahashi, J. Appl. Polym. Sci., 2013, 129, 310–315 CrossRef CAS.
- H. Lian, S. Hong, A. Carranza, J. D. Mota-Morales and J. A. Pojman, RSC Adv., 2015, 5, 28778–28785 RSC.
- S. Yang, T. Q. Yuan, M. F. Li and R. C. Sun, Int. J. Biol. Macromol., 2015, 72, 54–62 CrossRef CAS PubMed.
- T. Q. Yuan, F. Xu and R. C. Sun, J. Chem. Technol. Biotechnol., 2013, 88, 346–352 CrossRef CAS.
- A. Moubarik, J. Adhes., 2015, 91, 347–355 CrossRef CAS.
- W. Zhang, Y. Ma, C. Wang, S. Li, M. Zhang and F. Chu, Ind. Crops Prod., 2013, 43, 326–333 CrossRef CAS.
- M. Zhao, J. Jing, Y. Zhu, X. Yang, X. Wang and Z. Wang, Int. J. Adhes. Adhes., 2016, 64, 163–167 CrossRef CAS.
- J. Li, C. Li, W. Wang, W. Zhang and J. Li, Bioresources, 2016, 11, 2256–2268 CAS.
- S. Yang, J. L. Wen, T. Q. Yuan and R. C. Sun, RSC Adv., 2014, 4, 57996–58004 RSC.
- W. Zhang, Y. Ma, Y. Xu, C. Wang and F. Chu, Int. J. Adhes. Adhes., 2013, 40, 11–18 CrossRef CAS.
- M. H. Hussin, A. A. Rahim, M. N. M. Ibrahim and N. Brosse, Ind. Crops Prod., 2013, 49, 23–32 CrossRef CAS.
- A. Moubarik, N. Grimi, N. Boussetta and A. Pizzi, Ind. Crops Prod., 2013, 45, 296–302 CrossRef CAS.
- S. Cheng, Z. Yuan, M. Leitch, M. Anderson and C. C. Xu, Ind. Crops Prod., 2013, 44, 315–322 CrossRef CAS.
- Z. Guo, Z. Liu, L. Ye, K. Ge and T. Zhao, Mater. Lett., 2015, 142, 49–51 CrossRef CAS.
- V. Ibrahim, G. Mamo, P. J. Gustafsson and R. Hatti-Kaul, Ind. Crops Prod., 2013, 45, 343–348 CrossRef CAS.
- Y. Matsushita, S. Wada, K. Fukushima and S. Yasuda, Ind. Crops Prod., 2006, 23, 115–121 CrossRef CAS.
- Y. Zhang, Z. Yuan, N. Mahmood, S. Huang and C. C. Xu, Ind. Crops Prod., 2016, 79, 84–90 CrossRef CAS.
- M. Ferhan, N. Yan and M. Sain, J. Chem. Eng. Process Technol., 2013, 4, 160 Search PubMed.
- L. Zou, B. M. Ross, L. J. Hutchison, L. P. Christopher, R. F. Dekker and L. Malek, Enzyme Microb. Technol., 2015, 73, 44–50 CrossRef PubMed.
- W. J. Lee, K. C. Chang and I. M. Tseng, J. Appl. Polym. Sci., 2012, 124, 4782–4788 CAS.
- S. Cheng, C. Wilks, Z. Yuan, M. Leitch and C. C. Xu, Polym. Degrad. Stab., 2012, 97, 839–848 CrossRef CAS.
- D. Stewart, Ind. Crops Prod., 2008, 27, 202–207 CrossRef CAS.
- L. Hu, H. Pan, Y. Zhou and M. Zhang, Bioresources, 2011, 6, 3515 CAS.
- A. Xin-nan, A. S. Herbert and E. T. Gerald, Chem. Ind. For. Prod., 1995, 15, 36 Search PubMed.
- F. H. Bernhardt, W. Nastainczyk and V. Seydewitz, Eur. J. Biochem., 1977, 72, 107–115 CrossRef CAS PubMed.
- K. Li and X. Geng, Macromol. Rapid Commun., 2005, 26, 529–532 CrossRef CAS.
- R. Riley, A. A. Salamov, D. W. Brown, L. G. Nagy, D. Floudas, B. W. Held and E. A. Lindquist, Proc. Natl. Acad. Sci. U. S. A., 2014, 111, 9923–9928 CrossRef CAS PubMed.
- Q. Chen, M. N. Marshall, S. M. Geib, M. Tien and T. L. Richard, Bioresour. Technol., 2012, 117, 186–192 CrossRef CAS PubMed.
- L. Munk, A. K. Sitarz, D. C. Kalyani, J. D. Mikkelsen and A. S. Meyer, Biotechnol. Adv., 2015, 33, 13–24 CrossRef CAS PubMed.
- S. Wu and H. Zhan, Cellul. Chem. Technol., 2001, 35, 253–262 Search PubMed.
- S. H. Campion and I. D. Suckling, Appita J., 1998, 51, 209–212 CAS.
- Q. N. Sun, T. F. Qin and G. Y. Li, Int. J. Polym. Anal. Charact., 2009, 14, 19–33 CrossRef CAS.
- V. Ibrahim, L. Mendoza, G. Mamo and R. Hatti-Kaul, Process Biochem., 2011, 46, 379–384 CrossRef CAS.
- H. Nadji, P. N. Diouf, A. Benaboura, Y. Bedard, B. Riedl and T. Stevanovic, Bioresour. Technol., 2009, 100, 3585–3592 CrossRef CAS PubMed.
- A. Tejado, C. Pena, J. Labidi, J. M. Echeverria and I. Mondragon, Bioresour. Technol., 2007, 98, 1655–1663 CrossRef CAS PubMed.
- T. Malutan, R. Nicu and V. I. Popa, Bioresources, 2007, 3, 13–24 Search PubMed.
- W. O. Doherty, P. Mousavioun and C. M. Fellows, Ind. Crops Prod., 2011, 33, 259–276 CrossRef CAS.
- Y. Jin, X. Cheng and Z. Zheng, Bioresour. Technol., 2010, 101, 2046 CrossRef CAS PubMed.
- S. Sarkar and B. Adhikari, Polym. Compos., 2001, 22, 518–527 CrossRef CAS.
- R. W. Thring, P. Ni and S. M. Aharoni, Int. J. Polym. Mater., 2004, 53, 507–524 CrossRef CAS.
- M. A. Khan, S. M. Ashraf and V. P. Malhotra, J. Appl. Polym. Sci., 2004, 92, 3514–3523 CrossRef CAS.
- Z. Guo, Z. Liu, L. Ye, K. Ge and T. Zhao, Mater. Lett., 2015, 142, 49–51 CrossRef CAS.
- M. Wang, M. Leitch and C. C. Xu, Eur. Polym. J., 2009, 45, 3380–3388 CrossRef CAS.
- A. García, A. Toledano, L. Serrano, I. Egüés, M. González, F. Marín and J. Labidi, Sep. Purif. Technol., 2009, 68, 193–198 CrossRef.
- A. Trosa and A. Pizzi, Holz Roh- Werkst., 1998, 56, 229 CrossRef CAS.
- S. Yang, Y. Zhang, T. Q. Yuan and R. C. Sun, J. Appl. Polym. Sci., 2015, 132, 42493 Search PubMed.
- T. Kishimoto, Y. Uraki and M. Ubukata, Org. Biomol. Chem., 2005, 3, 1067–1073 CAS.
- J. Wang, Cure kinetics of wood phenol-formaldehyde systems Diss, Washington State University, 2007.
- Y. Ma, X. Zhao, X. Chen and Z. Wang, Colloids Surf., A, 2011, 377, 284–289 CrossRef CAS.
- Y. Qin, D. Yang and X. Qiu, ACS Sustainable Chem. Eng., 2015, 3, 3239–3244 CrossRef CAS.
- M. A. Khan and S. M. Ashraf, J. Adhes. Sci. Technol., 2005, 19, 493–509 CrossRef CAS.
- W. Qiao, S. Li, G. Guo, S. Han, S. Ren and Y. Ma, J. Ind. Eng. Chem., 2015, 21, 1417–1422 CrossRef CAS.
- M. A. Khan, S. M. Ashraf and V. P. Malhotra, J. Appl. Polym. Sci., 2004, 92, 3514–3523 CrossRef CAS.
- M. A. Khan and S. M. Ashraf, J. Therm. Anal. Calorim., 2007, 89, 993–1000 CrossRef CAS.
- Z. Yi, J. Zhang, S. Zhang, Q. Gao, J. Li and W. Zhang, Polymers, 2016, 8, 159 CrossRef.
- Y. Q. Jin, X. S. Cheng and Z. B. Zheng, Bioresour. Technol., 2010, 101, 2046–2048 CrossRef CAS PubMed.
| This journal is © The Royal Society of Chemistry 2016 |


