M. Zachut,
G. Kra,
Y. Portnik,
F. Shapiro and
N. Silanikove*
Department of Ruminant Science, Institute of Animal Sciences, Volcani Center, Bet Dagan 50250, Israel. E-mail: nissim.silanikove@mail.huji.ac.il; Fax: +972-89475075; Tel: +972-89484436
First published on 4th July 2016
Early lactation in high-producing dairy cows is associated with negative energy balance (EB) and with massive lipolysis to support the energy demands for milk production. The large influx of free fatty acids and glycerol increases oxidative stress in the mammary gland. Milk concentrations of glucose and glucose-6-phosphate (G6P), activity of glucose-6-phosphate dehydrogenase (G6PDH), level of the oxidative stress marker malondialdehyde (MDA), total antioxidant capacity of milk, calculated EB and various parameters reflecting EB (plasma concentrations of nonesterified fatty acids and body condition score), and glucose metabolism (plasma insulin concentration) were measured in 12 high-yielding dairy cows in early lactation (3–57 days in lactation), once a week for 4 weeks. Weekly averages of milk glucose concentration increased from 81 to 184 μM, and of milk G6P decreased from 223 to 81 μM. The activity of milk G6PDH decreased from 902.8 to 256.4 mU ml−1, so that the G6P/glucose ratio in milk decreased from 3.5 to 0.5. A significant correlation between milk G6PDH activity and milk G6P concentration, and an inverse relationship between milk MDA concentration and days in lactation suggest that G6P is shunted to the pentose phosphate pathway in the mammary gland in early lactation, as part of a homeostatic adaptation to counterbalance the excess oxidative stress during early lactation in dairy cows. Milk G6P concentration and G6P/glucose ratio may serve as objective, accurate and noninvasive indicators of EB in dairy cows and potentially in other mammals subjected to negative EB and oxidative stress.
Glucose is a central metabolite in mammary epithelial cells. In dairy cows, the mammary gland extracts 80–85% of the whole body's glucose production.9 Mammary epithelial cells do not synthesize glucose because they lack the enzyme glucose-6-phosphatase.10 Hence, glucose concentration in mammary epithelial cells depends on the quantity of glucose extracted from the blood. Glucose concentration in milk reflects its concentration in the mammary epithelial cell cytoplasm.9,11–13 Glucose-6-phosphate (G6P) is a central metabolite in the glycolytic axis because it serves as an intermediate compound during lactose synthesis, and participates in the first step of both glycolysis and the pentose phosphate pathway (PPP).9 Previous studies have shown that the concentration of metabolites produced by mammary epithelial cells in the milk of humans14,15 and ruminants11–13,16–18 is closely associated with milk secretion. Those studies highlighted the potential of glucose and citrate concentrations in milk for predicting changes in milk yield. Because the large influx of free fatty acids and glycerol increases oxidative stress in the mammary gland in early lactation, and since the PPP plays an essential role in antioxidant defense by serving as a source of NADPH production,19,20 in the present work, we hypothesized that oxidative stress in early lactation is associated with the shunting of glucose entering the mammary epithelial cells into the PPP. Therefore, the objectives of this study were: (i) to test the hypothesis that oxidative stress in early lactation is associated with changes in the activity of glucose-6-phosphate dehydrogenase (G6PDH), the first enzyme in the PPP, and with milk G6P concentrations, resulting in the shunting of glucose entering mammary epithelial cells into the PPP; (ii) to examine the relationships between milk concentrations of G6P and glucose, as well as G6PDH activity and oxidative stress markers in milk and dry matter intake (DMI), calculated EB, plasma NEFA and insulin concentrations in early lactation, to determine whether concentrations of G6P and glucose in milk can be used as noninvasive biomarkers of the physiological status of dairy cows during early lactation.
![]() | ||
Fig. 1 Weekly averages of milk yield (A), dry matter intake (B), body weight (C) and calculated energy balance (D) during the study. Data are presented as weekly average ± SEM. |
The average concentration of glucose in the milk increased from week 1 to week 3 in lactation (P < 0.01), and then remained constant (∼180 μM) until week 6 in lactation (Fig. 2A). Milk glucose was positively correlated to days in lactation (P < 0.0001; Table 1). The free glucose levels in milk in the present study were lower than those reported elsewhere for cows (331 μM;22 220 μM;23 254 μM18). This can be explained by the early stage of lactation and by the high milk yield in the present study.
Y | Range | X | Range | Typea | r = | P < |
---|---|---|---|---|---|---|
a E, exponential interrelationship, y values transformed to their natural log form; L, linear interrelationship; MDA, malondialdehyde; ORAC, oxygen radical antioxidant capacity. | ||||||
Milk G6P (μM) | ||||||
Milk G6P | 51.6–338.7 | Days in lactation | 3–57 | E | −0.50 | 0.0003 |
Milk G6P | 51.6–338.7 | Milk ORAC (μM) | 418.8–901.6 | L | 0.25 | 0.1 |
Milk G6P | 51.6–338.7 | Dry matter intake (kg per day) | 4.8–35.9 | L | −0.51 | 0.01 |
Milk G6P | 51.6–338.7 | Milk G6PDH activity (mU ml−1) | 38.8–4250.4 | E | 0.68 | 0.0001 |
Milk G6P | 51.6–338.7 | Plasma NEFA (μeq. l−1) | 190.2–1489.1 | L | 0.60 | 0.02 |
Milk G6P | 51.6–338.7 | EB (Mcal per day) | −30.3–20.7 | L | −0.45 | 0.02 |
![]() |
||||||
Milk G6P/glucose | ||||||
Milk G6P/glucose | 0.3–8.9 | Dry matter intake (kg per day) | 4.8–35.9 | L | −0.65 | 0.0007 |
Milk G6P/glucose | 0.3–8.9 | Milk G6PDH activity (mU ml−1) | 38.8–4250.4 | E | 0.55 | 0.0001 |
Milk G6P/glucose | 0.3–8.9 | Days in lactation | 3–57 | E | −0.69 | 0.0001 |
Milk G6P/glucose | 0.3–8.9 | Plasma NEFA (μeq. l−1) | 190.2–1489.1 | L | 0.81 | 0.0003 |
Milk G6P/glucose | 0.3–8.9 | EB (Mcal per day) | −30.3–20.7 | L | −0.52 | 0.0045 |
Plasma insulin (pg ml−1) | 162.7–2416.5 | Milk G6P/glucose | 0.3–8.9 | L | −0.68 | 0.02 |
![]() |
||||||
Milk G6PDH activity (mU ml−1) | ||||||
Milk G6PDH activity | 38.8–4250.4 | Dry matter intake (kg per day) | 4.8–35.9 | E | −0.57 | 0.0003 |
Milk G6PDH activity | 38.8–4250.4 | EB (Mcal per day) | −30.3–20.7 | E | −0.50 | 0.001 |
Milk G6PDH activity | 38.8–4250.4 | Milk G6P/glucose | 0.3–8.9 | L | 0.53 | 0.0003 |
Milk G6PDH activity | 38.8–4250.4 | Days in lactation | 3–57 | E | −0.37 | 0.01 |
![]() |
||||||
Additional oxidative stress and metabolic status indicators | ||||||
Milk MDAa (nM) | 101.3–948.5 | Days in lactation | 3–57 | E | −0.36 | 0.01 |
Milk glucose (μM) | 16.6–439.4 | Days lactation | 3–57 | E | 0.56 | 0.0001 |
Milk ORACa (μM) | 418.8–901.6 | Days in lactation | 3–57 | E | −0.29 | 0.06 |
Milk ORAC (μM) | 418.8–901.6 | EB (Mcal per day) | −30.3–20.7 | E | −0.30 | 0.07 |
Plasma insulin (pg ml−1) | 162.7–2416.5 | Milk glucose (μM) | 16.6–439.4 | L | 0.49 | 0.06 |
In contrast, the average concentration of G6P in the milk (Fig. 2B) was highest (223.2 ± 29.2 μM) for week 1 in lactation, remained high in week 2 and then decreased in week 3 (P < 0.02), and continued to decrease until week 5 in lactation (81.0 ± 23.2 μM; P < 0.01). As a result, milk G6P concentration was negatively correlated to days in lactation (Table 1). Consistent with our results, a recent study using a similar enzymatic–fluorimetric method to determine milk G6P in over 3200 milk samples from cows on a commercial farm reported an average mean G6P of 81 μM (during weeks 1–70 in lactation22). In addition, a similar decrease in G6P and increase in glucose concentrations in milk in early lactation (weeks 1–3) compared to later stages of lactation were also reported.22 However, that report lacked data on cows' DMI, blood parameters and EB. Nevertheless, the agreement of our findings with this previous report strengthens the validity of the former and adds important information on the relationship between these milk metabolites and indicators of metabolic status, as the present study is the first to examine the association between milk G6P and DMI, EB, and plasma NEFA and insulin concentrations.
The G6P/glucose ratio (Fig. 2A) was highest at week 1 in lactation (3.5 ± 0.5, P < 0.02) and reached its lowest levels at week 5 in lactation (0.5 ± 0.4, P < 0.04). The G6P/glucose ratio was exponentially negatively correlated with days in lactation (Table 1). To investigate the possible mechanism underlying this phenomenon, we examined the activity of milk G6PDH, which is the first enzyme in the PPP. Indeed, the activity of G6PDH was highest in weeks 1–2 of lactation, and then decreased, similar to milk G6P concentration, until week 5 in lactation (Fig. 2B). Moreover, G6PDH activity was linearly correlated with milk G6P (P < 0.0001) and with G6P/glucose ratio (Table 1). In addition, milk G6PDH activity was negatively correlated to days in lactation, DMI and EB (Table 1).
Milk MDA concentration was highest in early lactation and then exponentially decayed (Table 1). It was inversely correlated with days in lactation (Table 1), which is consistent with the pattern and levels of milk MDA in early lactation.24 Milk antioxidative capacity (ORAC values, Table 1) tended to be negatively and exponentially correlated with days in lactation and EB (Table 1), and to be positively and linearly correlated to milk G6P (Table 1).
The concentrations of milk G6P were positively and linearly correlated to plasma NEFA concentrations (Table 1), and the G6P/glucose ratio was highly linearly correlated to plasma NEFA concentrations (Table 1). These correlations are in accordance with that between G6P and calculated EB, as NEFA concentrations reflect body reserve mobilization in early lactation. Moreover, the positive correlation between plasma NEFA and milk G6P is in accordance with that previously reported between milk beta-hydroxyl butyrate and G6P.22
A negative correlation was found between milk G6P and DMI (Table 1). Similarly, the G6P/glucose ratio was closely correlated to DMI. In addition, a negative linear correlation between G6P in milk and EB was found, as well as between the G6P/glucose ratio and EB (Table 1). The G6P/glucose ratio was negatively correlated to plasma insulin concentration (Table 1). As the concentration of insulin in the blood increases with increasing DMI, the negative correlation between plasma insulin and milk G6P/glucose ratio is consistent with the negative relationships between G6P and G6P/glucose and DMI and EB.
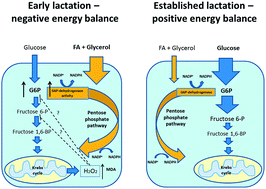
Only a few studies have reported on G6PDH activity in milk. Among them, Mellenberger and Bauman26 found that milk G6PDH activity increases from mid-pregnancy to lactation in rabbits. In humans, G6PDH is synthesized in the mammary gland in response to hormonal stimuli during pregnancy and lactation.27 Grigor and Hartmann28 examined G6PDH activity in the milk of sows, rats and rabbits, and concluded that milk G6PDH activity reflects that found in the mammary gland, which is consistent with our hypothesis. Based on our findings, we hypothesize that elevated G6PDH activity in early lactation reflects increased shunting of G6P to the PPP. Because G6P is derived from glucose, the only possible explanations for a G6P/glucose ratio > 1 in milk at the beginning of lactation (up to week 2, Fig. 2A) are: (i) inhibition of its passage through the downstream stages of glycolysis in the mammary epithelial cells, or (ii) recycling of fructose-6-phosphate formed in the PPP to G6P.20 The increase of G6P in the mammary epithelial cell cytosol likely brings it closer to the optimal Km of G6PDH. According to this explanation, the enhanced diversion of G6P through the PPP and conversely, inhibition of its passage through the glycolytic pathway gradually fade, so that the G6P/glucose ratio in milk decreases on average from ∼3.5 immediately postpartum to ∼0.5 at established lactation (once a positive EB is obtained; Fig. 3). The low SCC in the cows used in the present experiment strongly suggests that the milk MDA and ORAC levels reflected cellular events and not post-secretion events due to bacterial infection. It is consistent with previous reports associating milk synthesis with fat and protein oxidation due to oxidative stress by free radicals.24,29,30 The shunting of G6P to PPP and resulting formation of NADPH balanced, to some extent, the overloading of oxidative stress, as reflected in the positive relationship between G6P and ORAC levels. However, it could not prevent the increase in MDA formation because radical formation is most likely the cause of this response (Fig. 3) and because radical activity is very rapid (a few split seconds25).
We suggest a biochemical–physiological model to explain the results of the present study (Fig. 3). The high G6P/glucose ratio in milk at the beginning of lactation may reflect the need to shunt G6P through the PPP to counterbalance the oxidative stress in the mammary epithelial cells (Fig. 3). Consistent with our model, it is known that PPP regulation during the oxidative stress response is a conserved paradigm from yeast to mammals of the cellular antioxidant defense mechanism via reduction of NADP+ to NADPH.20 The fastest response (on the order of seconds) is made possible through oxidative inhibition of glycolytic enzymes supported by post-translational modifications (on the order of minutes) that increase G6PDH activity.20 Thus the increase in G6PDH activity and G6P/glucose ratio in early lactation in association with increased oxidative stress are consistent with those basic homeostatic responses.
Early lactation is associated with negative energy balance and extensive lipolysis, which in turn induces oxidative stress in central and peripheral tissues. The mammary gland is the most active peripheral tissue and is subjected to oxidative stress leading to increased concentration of H2O2 in its epithelial cells.7 When it interacts with minerals such as Fe and Cu, H2O2 tends to react with peroxides and produce free radicals that may reach toxic levels in the cells. Glutathione is an important antioxidant that prevents damage to important cellular components caused by reactive oxygen species such as free radicals, peroxides, lipid peroxides and heavy metals.19 Conversion of oxidized glutathione to reduced glutathione by glutathione reductase is the central reaction for degradation of H2O2.20 This reaction requires NADPH as a cofactor, increasing the cell's requirement for NADPH during oxidative stress.20 Our and Bouwstra et al.24 finding of a negative correlation between milk MDA and days in lactation supports this model. Two molecules of NADPH are produced per molecule of G6P shunted to the PPP. Under non-oxidative stress, most of the G6P is metabolized via the glycolytic pathway, which most likely reflects the lower Km of the immediate downstream enzymes of the glycolytic axis rather than the Km of G6P dehydrogenase, which is responsible for diverting G6P to the PPP. Thus, diversion of G6P to the PPP can be enhanced by inhibiting the downstream flow of G6P along the glycolytic axis, and its accumulation then allows its diversion into the PPP. The mechanism of inhibition of downstream glycolytic enzyme requires further study: it may be a direct effect of H2O2,20 or mediated by an intracellular signal that is sensitive to H2O2 concentration. The gradual conversion from negative energy balance to positive energy balance progressively increases the flow of G6P through the glycolytic axis.
NEC = NEL/kg of DM × DMI; |
NEM = BW0.75 × 0.08 × 1.1; |
NEP = milk, kg × [(0.0929 × fat, %) + (0.0547 × protein, %) + (0.0395 × lactose, %)]; |
EB = NEC − (NEM + NEP) |
This journal is © The Royal Society of Chemistry 2016 |