The role of Ni doping on photoelectric gas-sensing properties of ZnO nanofibers to HCHO at room-temperature
Jiabao Cuia,
Jingjing Jianga,
Linqi Shia,
Fei Zhaoa,
Dejun Wangab,
Yanhong Lin*a and
Tengfeng Xie*a
aCollege of Chemistry, Jilin University, Changchun 130012, P. R. China. E-mail: xietf@jlu.edu.cn; linyh@jlu.edu.cn
bDepartment of Chemistry, Tsinghua University, Beijing 100084, P. R. China
First published on 12th August 2016
Abstract
Ni-Doped ZnO nanofibers have been synthesized by a simple, facile electrospinning method. The structure and morphology of the products were characterized by SEM, HRTEM and XRD analysis. X-ray photoelectron spectroscopy (XPS) confirmed that Ni2+ ions exist in the ZnO nanofiber structures. The photoelectric gas-sensing tests reveal that the response was significantly enhanced by Ni doping, and the 0.7% molar ratio Ni-doped sample (NZ0.7) exhibits the highest response of 532.7% to 100 ppm HCHO at room temperature. Photoluminescence (PL) measurements show that there are more donors in Ni-doped ZnO nanofibers by the introduction of Ni2+ ions. Furthermore, the surface photovoltage (SPV) and transient photovoltage (TPV) tests indicated that Ni doping can effectively enhance the donor density, which could facilitate charge separation and transport in the semiconductor, and promote photogenerated holes to move toward the irradiated surface of the samples. These results contribute to the photocatalytic oxidation of HCHO so as to achieve higher gas-sensing properties for Ni-doped ZnO nanofibers.
Introduction
Formaldehyde (HCHO) is one of most serious indoor air pollutants among volatile organic compounds (VOCs) that are widely used in household materials,1,2 which is the leading cause of center nervous system damage, immune system disorders and nasopharyngeal cancer.3 Therefore, it is necessary to achieve rapid selective detection of HCHO from a practical point of view. Gas sensors based on metal oxide semiconductors (MOS) have attracted considerable interest because they can significantly enhance sensitivity and response time, and have been widely used in the environmental monitoring and detection of inflammable, explosive, or toxic gases.4 Among the materials studied, zinc oxide (ZnO) is one of the most attractive n-type semiconductors, and it is widely used as a material for gas sensors due to its remarkable advantages of low maintenance cost, rapid response and recovery time and so on.5At present, most of the ZnO sensors have attempted to improve the gas-sensing response and sensitivity by the evolution of structures,6 hetero-junctions,7 and doping8 and so on. However, working at high temperature (heated beyond 200 °C) requires a complex structural design and fabrication process for the sensors, which can increase their cost and are unfavourable to portable. Moreover, high operation temperature is undesirable in many situations, such as in a flammable or an explosive environment. Therefore, it is required to fabricate the gas sensors working at room temperature. Due to a wide direct band gap of 3.7 eV and a large exciton binding energy of 60 meV,6,9 ZnO is regarded as one of the most suitable gas-sensing materials to fabricate the gas sensors, which can operate at room temperature by using UV light as the excitation energy. Several experimental studies have been carried out on the effect of UV irradiation on the MOS gas-sensing properties and theoretical model of the gas-sensing mechanism in the presence of UV irradiation.10,11 The results suggested that continuous light irradiation can replace the conventional heating. Furthermore, the light irradiation can promote the charge separation and catalytic reaction of gases on the sensors' surface.
As we all know, the gas-sensing mechanism of metal oxide gas-sensing materials is based on the reaction between the target-gas molecules and oxygen species adsorbed on the surface of the MOS.12,13 When the ZnO sensors are exposed to HCHO gases, the catalytic reaction between the HCHO and adsorbed oxygen species such as O2− by capturing the electron from the ZnO conduction band will take place, and released electrons return back to the ZnO conduction band, resulting in the increasing of the conductivity of the sensor, and then, gases can be detected.14 Based on the gas-sensing mechanism, the number of adsorbed oxygen species would significantly affect the gas-sensing response of sensors. Therefore, to increase the number of adsorbed oxygen species, it is necessary to develop a suitable growth method to fabricate ZnO nanomaterials with large surface area and abundant donor defects. Among all methods used to synthesize ZnO nanomaterials, electrospinning is an efficient, relative simple way to produce polymer and composite polycrystal fibers.15 Particularly, compared to 1D materials synthesized with other methods, the ZnO nanofibers prepared by electrospinning have larger specific surface areas, higher aspect ratio, and better pore interconnectivity, which are favourable for the gas detection. In addition, it is well known that Ni2+ ion is a more efficient doping element used to modify the ZnO surface to improve and tune the optical and electrical properties.16,17 Ni2+ has similar radius to Zn2+ (the effective ionic radii are 69 pm and 74 pm, resp.). Thus, Ni2+ has easily gone into ZnO lattice by substitution of replace Zn2+, and then donor defects will be created, which facilitated charge separation and transport in the ZnO nanomaterials.18,19 Consequently, motivated by these factors, the central goal of our work is to fabricate the HCHO gas sensor based on Ni-doped ZnO nanofibers, and expected that the combination of Ni2+ ions and ZnO nanofibers could result in a remarkable increase in the photoelectrical gas-sensing at the room temperature.
In this paper, a new gas sensor using Ni-doped ZnO nanofiber was fabricated and used for the detection of HCHO under 365 nm UV-light irradiation at room temperature. The effect of Ni doping on the HCHO gas-sensing properties was sufficiently discussed by the means of PL, SPV, and TPV spectrums. The results suggest that an appropriate amount of Ni doping in ZnO nanofibers could effectively enhance donor density so as to promote the charge separation and transport, and then restrain the recombination of photogenerated electron–hole pairs, improving the HCHO gas-sensing performance.
Results and discussion
Morphology structures and chemical state in Ni-doped ZnO nanofibers
To elucidate the crystal structure of ZnO and Ni-doped ZnO nanofibers, further investigations were carried out. Fig. 1a shows an SEM image of ZnO nanofibers. The calcined ZnO exhibits the typical nanofiber network structure with 250–350 nm in diameter. Fig. 1b is the SEM image of NZ0.7 nanofibers. It is clearly identify that the introduction of Ni2+ ions didn't change the structure and diameter size of nanofibers. It is also observed that nanofibers were composed of tightly packed nanocrystallites and the size of individual grain is ∼45 nm. In order to obtain the microstructure of Ni-doped ZnO nanofibers, the TEM and HRTEM observations were carried out and the corresponding results are shown in Fig. 1c and d. It is found that individual Ni-doped ZnO nanofibers consist of single nanoparticles which stack along the nanofiber axis. HRTEM showed the only presence of ZnO crystal lattices in the NZ0.7 nanofibers. As shown in Fig. 1d, the interplanar distances of 1.303, 1.377 and 1.979 Å are close to the d-spacing of (004), (112) and (102) planes of ZnO, respectively. These results confirmed that Ni doping with trace didn't affect the polycrystal structure of ZnO nanofibers.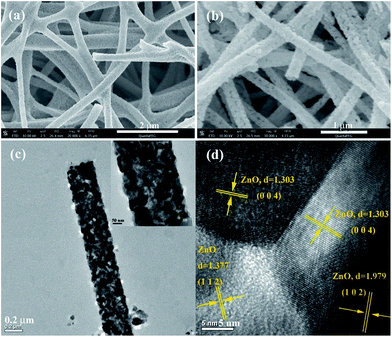 | ||
| Fig. 1 SEM images of ZnO nanofibers (a) and NZ0.7 nanofibers (b), TEM image of NZ0.7 nanofibers (c), HRTEM image of NZ0.7 nanofibers (d). | ||
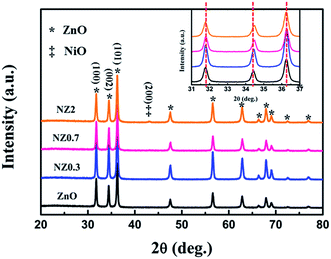
The crystal structure of the samples was investigated using XRD. As shown in Fig. 2, all the Ni-doped ZnO samples with various doping contents gave XRD sharp peaks marked by stars that match the standard diffraction data for the hexagonal ZnO wurtzite structure (JCPDS no. 36-1451), suggesting good crystallinity of the nanofibers after calcining at 520 °C for 4 h. No trace of metal nickel, its oxides, or composites can be detected in the samples when the Ni-doping content is 0.3 mol% and 0.7 mol%, respectively. However, samples doped with 2.0 mol% Ni content display additional diffraction peak obviously compared with that of the pure ZnO specimen. The additional XRD peak (200) corresponds to NiO and is marked by two stars. In addition, it is worth mentioning that a slight of (002) peak position shift towards higher angle for Ni doping samples compared to the pure ZnO were observed (Fig. 2, inset). The higher 2θ indicates contraction of the lattice due to the ionic radii of Zn ions is larger than Ni ions.25 This result maybe attributes the incorporation of Ni ions into the ZnO lattice.
The chemical composition of nanofiber samples was analyzed by XPS. As observed in Fig. 3a, there are two symmetric peaks in the Zn 2p region. For ZnO nanofibers, the binding energies at near 1021.2, 1044.3 eV correspond to the Zn 2p3/2, Zn 2p1/2, which can be well index to Zn2+ and O2− ions in a wurtzite ZnO structure.26 Compared with the spectra record on ZnO nanofibers, the Zn 2p3/2 and Zn 2p1/2 peaks of Zn–O bond in NZ0.7, NZ2 nanofibers shift remarkably to the higher binding energy, which can be attributed to the existence of Ni2+ ions in the synthesized Ni-doped ZnO.27 Fig. 3b shows the Ni 2p XPS spectra of NZ0.7 and NZ2 nanofibers. The Ni 2p XPS spectra was fitted into four peaks at 854.6, 861.5, 872.9 and 880.9 eV, which was applied using Gaussian–Lorentzian peak shape after subtraction of Shirley background. Compared with the NiO samples,28 the peaks both Ni 2p3/2 and Ni 2p1/2 of NZ0.7 and NZ2 nanofibers shifted toward the lower binding energy. The energy shift of the detected Zn 2p and Ni 2p peaks in XPS could be due to the difference in the electronegativity of the Ni2+ and Zn2+ ion (the electronegativity are 2.17 and 1.91, resp.).29 The results suggested that the Ni–O–Zn bond might present in Ni-doped ZnO nanofibers, and Ni element might have been successfully incorporated into the ZnO nanofibers.
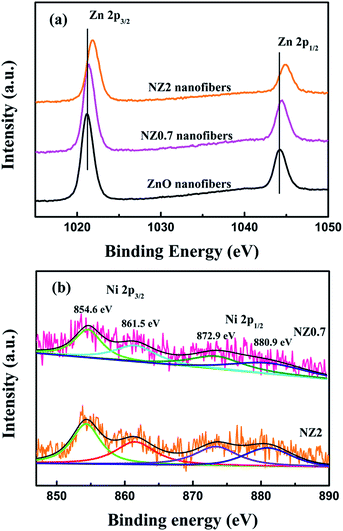 | ||
| Fig. 3 High resolution XPS spectra of ZnO, NZ0.7 and NZ2 nanofibers: (a) Zn 2p spectra and (b) Ni 2p spectra. | ||
Optical properties
Before the measurement of gas-sensing properties, the experiment about the photo-response and stability of the samples under 365 nm UV-light on and off were tested. The results are shown in Fig. 4. The resistance of every sample is different. Therefore, to better compare the results, the photocurrent normalization was made. Fig. 4 shows the conductivity changes when the UV illumination is switched on or off. It can be seen that the photocurrent of the samples increases rapidly by over 1–2 orders of magnitude on 365 nm UV-light illumination. After lighting is off, the current drops back to the initial value. In addition, it is worth noting that appropriate amount of Ni doping can improve the photocurrent (NZ0.7 > NZ0.3 > NZ2 > ZnO), suggesting that Ni doping is more beneficial for the samples to promote the separation and transport of photogenerated charges. More importantly, after the three cycle experiments of the light on–off under 365 nm UV-light irradiation, the photocurrent response did not change, indicating that ZnO and ZnO doped with Ni2+ ions have very good stability to light and it is an ideal candidate material for photoelectric gas sensors.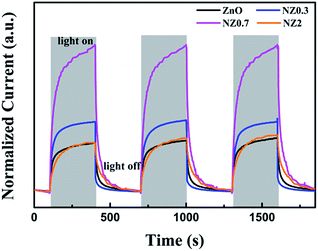 | ||
| Fig. 4 Surface photocurrent of pure ZnO and Ni-doped ZnO nanofibers exposed to three cycle of UV-light on/off with 10 V bias under the illumination of 365 nm at room temperature. | ||
Enhancement of 365 nm UV-light gas-sensing performance
The gas-sensing response curves of sensors to different concentrations of HCHO are shown in Fig. 5. It was measured under 365 nm UV-light irradiation at room temperature. And it can be obviously seen that the photocurrent increases significantly for all samples with the increasing HCHO concentrations.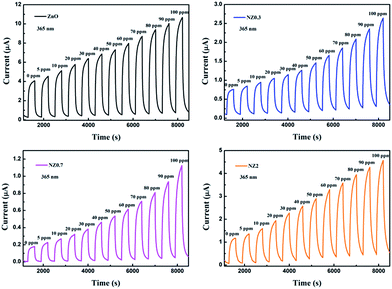 | ||
| Fig. 5 The gas-sensing response cycles of the ZnO and Ni-doped ZnO nanofibers to different concentrations HCHO with a bias voltage of 10 V under 365 nm UV-light illumination. | ||
In order to observe more clearly about the gas-sensing of the samples, the HCHO gas sensor response is calculated and shown in Fig. 6. It is found that, with the increase of the HCHO concentration, the gas sensor response of all samples increased and all the Ni-doped ZnO nanofibers showed significantly increased HCHO gas-sensing response compared with undoped ZnO. Among them, the NZ0.7 sample has a much better gas-sensing performance than that of others, no matter whether the test is in the low or high concentration of HCHO. The response is ∼27.7, 82.3, 246.3, and 532.7%, corresponding to HCHO concentrations of ∼5, 20, 60, and 100 ppm in the container, respectively. However, the NZ2 sample begins to have a lower response, which is 16.1, 65.7, 181.7, and 290.6%, respectively. This indicates that the formation of NiO has the significantly affected the gas-sensing response of ZnO and that there is an optimal dopant concentration of Ni in ZnO nanofibers. In addition, the injection of ∼0.4 μL HCHO liquid into the test chamber can prepare 100 ppm HCHO atmosphere in our experiment, and very little H2O was introduced with HCHO liquid into the chamber. The injected H2O is not enough to change the humidity of circumstance. Therefore, the effect of H2O on the gas-sensing response can be ignored in our gas-sensing test and this method of gas detection is feasible.30
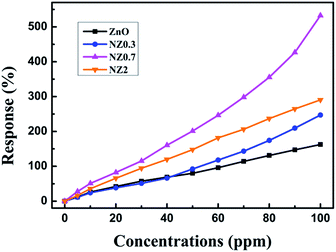 | ||
| Fig. 6 Gas response (S) of ZnO, Ni-doped ZnO nanofibers to various concentrations of HCHO with 365 nm UV-light irradiation. | ||
A comparison of sensing performance between the sensor reported in this work and previous HCHO sensors published by our group is summarized in Table 1. From the table, comprehensively considering the gas response, it is obvious that NZ0.7 has more superior gas response than those in the literature.
Influencing and mechanism of enhancement of gas-sensing response
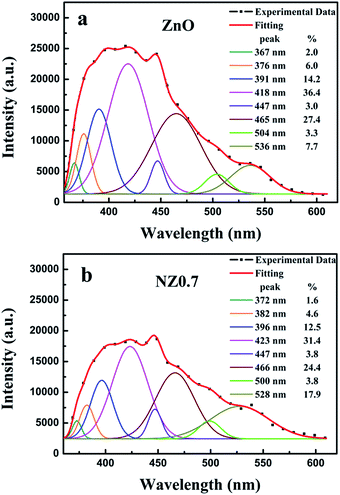
In order to analyze the influencing of doped ZnO nanofibers gas-sensing property, the native defects of the samples were studied by room temperature photoluminescence (PL) measurements. Fig. 7 shows room temperature PL spectrum of synthesized ZnO and 0.7% Ni-doped-ZnO nanofibers. The samples were excited at 325 nm using He–Cd laser. Fig. 7a reveals eight PL peaks for ZnO nanofibers centered at ∼367, 376, 391, 418, 447, 465, 504, and 536 nm, respectively. The peaks at ∼367 and 376 nm are attributed to near band edge (NBE) emission, which results from the recombination of electrons in the conduction band and holes in the valance band. The violet emission peak (∼391 nm) near the tail region of UV emission may be attributed to the lattice disrobe/defects in the chemical synthesized ZnO nanostructure.33,34 Both of peaks at ∼418 and 447 nm are attributed to interstitial zinc (Zni).35 The peak ∼465 nm is related to zinc vacancy (VZn) and the peak centered at 504 nm is attributed to oxygen vacancy (VO).36 For the Ni-doped ZnO nanofibers, as shown in Fig. 7b, Ni2+ doping showed a slight red shift in the PL emission peaks compared with ZnO nanofibers. Additionally, the deep emission peak (∼536 nm) of ZnO is related to interstitial oxygen (Oi) and the peak at ∼528 nm of NZ0.7 is associated with VO.37 Generally, Zni and VO are donors that give rise to free electrons, while VZn and Oi are acceptors that consume free electrons.36 The percentages of donors and acceptors can be obtained by Fig. 7, and it is found that 0.7% Ni-doped ZnO nanofibers have the higher content (56.9%) of donors than that of ZnO nanofibers. It is beneficial to the absorption of oxygen and the reaction on surface of NZ0.7, which is responsible for the achievement of the highest response to HCHO at room temperature. Therefore, when the sensor is exposed to HCHO atmosphere, the reaction will occur between the HCHO molecules and the oxygen anions absorbed on the surface of the samples. Under the 365 nm UV-light irradiation, lots of photogenerated electron–hole pairs will be generated in the ZnO nanofibers. Correspondingly, the reaction between photogenerated holes and the adsorbed oxygen anions will take place. Oxygen molecules can be activated and react with HCHO gas molecules: ,12,13,38 the photogenerated holes and adsorbed oxygen molecules will dramatically decrease. Eventually, photocatalytic oxidation of HCHO will cause the increase of the conductance of the sensors. Furthermore, oxygen vacancies would be expected to be produced with Ni doping,18 because of Ni2+ has an empty 3d orbital, which is a preferred absorption orientation.39 PL spectrum also demonstrates that Ni doping can significantly enhance the concentration of donors, and increase the opportunity of oxygen anions adsorption on the surface of samples. Therefore, it is benefit for improving the response of the sensors to HCHO gas.
Generally speaking, charge transfer process between adsorbed oxygen molecules and the tested gas is one of the key factors to determine the intensity of the photoelectric gas-sensing response.40 In order to investigate the relationship between photogenerated charge properties and photoelectric gas-sensing activity of the samples, the SPV, TPV and corresponding phase spectrum measurement were carried out. A SPV signal starts to rise when the light is absorbed by semiconductor materials as well as the photoinduced excess charges are separated in space.41,42 As shown in Fig. 8a, NZ0.7 has the highest SPV response signal, which indicates that more photogenerated electron–hole pairs will be involved into the reaction under UV-light illumination. In addition, the obvious phase value around zero in the illustration was observed according to the phase spectrum, which suggested photogenerated holes move to the irradiation surface of the samples.43 A strong signal of NZ0.7 means that more photogenerated holes maybe transfer to the surface and participate in redox reaction with oxygen anions. In addition, according to the SPV spectrum, all the samples exhibit the obvious SPV response under 356 nm light, which is reasonable that 365 nm light was selected as illumination light for gas-sensing measurement. The TPV measurement is a promising method for investigating the kinetic property of the photogenerated charges transfer process.22 It provides directed information about the generation, separation, and recombination of photogenerated charges. Fig. 8b shows the TPV response of ZnO, Ni-doped ZnO samples under irradiation of UV laser pulse at 355 nm, respectively. The positive signal implies that photogenerated holes transfer to surface and accumulate at the surface area nearby,44,45 and the tendency of signal strength is consistent with the SPV spectrum. It can be seen that there are two response peaks of all the samples, and the time value of the peak is shorter than 10−6 s while that of the peak is longer than 10−5 s. When the time is less than 10−6 s, the TPV signal rises under the illumination of 355 nm laser pulse. It is the typical feature which produces by the separation of charges under the effects of a built-in electric field in the surface space-charge region.46 When the time is longer than 7 × 10⁻⁶ s, the TPV signal is retarded in time, which is typical for diffusion process.47 According to the TPV results, NZ0.7 has the strongest TPV response, meaning that an optimal dopant concentration of Ni in ZnO nanofibers could improve the separation extent and restrain the recombination of photogenerated electron–hole pairs, which is beneficial to improve the photoelectric gas-sensing ability of samples.
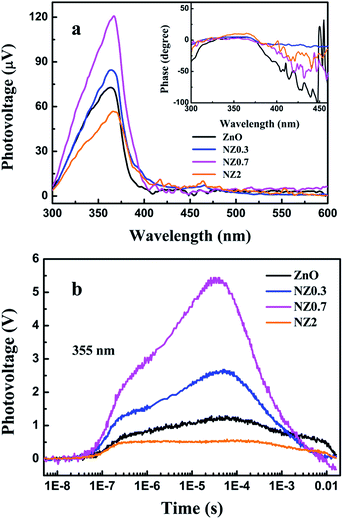 | ||
| Fig. 8 Surface photovoltage (SPV) spectra, inset is the corresponding phase spectra (a) and transient photovoltage (TPV) spectra (b) of ZnO, Ni-doped ZnO nanofibers. | ||
Conclusions
Ni-Doped ZnO nanofibers have been synthesized for enhancing photoelectric gas-sensing property by a facile electrospinning method. All of the samples exhibit good stability under the irradiation 365 nm UV-light. Among of them, NZ0.7 has an excellent HCHO gas-sensing response, which is 532.7% to 100 ppm HCHO. Through the introduction of an appropriate amount of Ni dopants into ZnO nanofibers, higher concentrations of donors are obtained, which is contributed to the separation of photogenerated electron–hole pairs so as to more holes take part in the photocatalytic oxidation reaction between HCHO gas and oxygen anions. The results revealed Ni-doped ZnO nanofibers are an ideal candidate material for photoelectric HCHO gas-sensing sensors.Experimental
Chemicals
Zinc acetate dehydrate (99+%, Xilong Chemical Co., Ltd.), nickel acetate (98+%, Tianjin donghua chemical), N,N-dimethylformamide (99.5+%, Tianjin tiantai chemical), polyvinylpyrrolidone (Mw = 1![[thin space (1/6-em)]](https://www.rsc.org/images/entities/char_2009.gif) 300
300![[thin space (1/6-em)]](https://www.rsc.org/images/entities/char_2009.gif) 000 K88-96, aladdin).
000 K88-96, aladdin).
Preparation of the ZnO, Ni-doped ZnO nanofibers
In a typical procedure, the nanofibers of ZnO, Ni-doped ZnO were synthesized using an electrospinning and calcination method. First, 0.3 g of acetate salt with Ni(CH3COO)2·4H2O and Zn(CH3COO)2·2H2O molar ratios of 0, 0.3%, 0.7% and 2% were dissolved in 4 mL of N,N-dimethylformamide (DMF) in a glass bottle under vigorous stirring for 30 min. Then, 0.9 g of polyvinylpyrrolidone (PVP; Mw = 1![[thin space (1/6-em)]](https://www.rsc.org/images/entities/char_2009.gif) 300
300![[thin space (1/6-em)]](https://www.rsc.org/images/entities/char_2009.gif) 000) was added into the above solution. After stirring at the room temperature for 12 h, the precursor solution of the PVP/acetate salt was obtained and loaded into a plastic syringe. The needle tip was 20 cm away from a piece of plat aluminium foil (collector). The applied potential was maintained at 15 kV and the feeding rate was kept constant at 0.3 mm min−1. Finally, the obtained precursor nanofibers were calcined at 520 °C for 4 h (heating rate: 2 °C min−1) to remove the PVP. The as-prepared samples were labeled as ZnO, NZ0.3, NZ0.7 and NZ2, respectively.
000) was added into the above solution. After stirring at the room temperature for 12 h, the precursor solution of the PVP/acetate salt was obtained and loaded into a plastic syringe. The needle tip was 20 cm away from a piece of plat aluminium foil (collector). The applied potential was maintained at 15 kV and the feeding rate was kept constant at 0.3 mm min−1. Finally, the obtained precursor nanofibers were calcined at 520 °C for 4 h (heating rate: 2 °C min−1) to remove the PVP. The as-prepared samples were labeled as ZnO, NZ0.3, NZ0.7 and NZ2, respectively.
Characterizations
The morphologies and crystal structures of synthesized nanofibers were investigated using scanning electron microscopy (SEM) (JSM-6700F, JEOL), high resolution transmission electron microscopy (HRTEM) (FEI company), and X-ray diffraction (XRD) (Rigaku D/Max-2550, Cu Ka λ = 1.54056 Å). The elemental composition of the samples was analyzed by using an X-ray photoelectron spectroscopy (XPS) (Thermo VG Scientific ESCALAB250) with the monochromatized Al Kα excitation. The room temperature photoluminescence (PL) spectra with an excitation wavelength of 325 nm were measured on a FLUOROMAX-4.The surface photovoltage (SPV) spectroscopy measurement was carried out with self-made instrument,20,21 which consisted of the lock-in amplifier (SR830, Stanford Research Systems, Inc.) with a light chopper (SR540, Stanford Research Systems, Inc.), a source of monochromatic light and a sample chamber. The transient photovoltage (TPV) measurement system consisted of a laser radiation pulse (wavelength of 355 nm and pulse width of 5 ns) from a third-harmonic Nd/YAG laser (Polaris II, New Wave Research, Inc.), 500 MHz digital phosphor oscilloscope (TDS5054, Tektronix) with a preamplifier and a sample chamber.22,23 Both the TPV and SPV measurements were a sandwich-like structure of ITO-sample-ITO and operated in air ambient at room temperature.
Gas-sensing measurement
Gas-sensing properties were measured based on the photocurrent measurement system, which was composed of a source of monochromatic light, an electrochemistry workstation (CHI630b), and a sample test chamber and a computer. The monochromatic light was obtained by the double-prism monochromatic (Hilger and Watts, D300) and a 500 W xenon lamp (CHFXQ500 W, Global xenon lamp power).The fabrication of sensor was simple. Firstly, the ZnO samples were ultrasonically dispersed in double-distilled water. And then, the suspension liquid was dripped onto the etched comb-like ITO electrode, and kept 60 °C for 2 h to vaporize water. Finally, the photoelectric gas sensors were fabricated and the thickness of sensing film is ∼0.1 mm.
A detected gas (HCHO liquid) was injected into the test chamber by a syringe, and air was used both as a reference gas and a diluting gas to obtain desired concentration of detected gas.24 An electrochemistry workstation recorded the current intensity across the gas sensor with bias of 10 V and the sensor was illuminated by monochromatic light (365 nm, 0.213 μW cm−2). After the sensor was put into the test chamber with the detected gas, the UV light is immediately turned on and lasts 300 s. And then, the light is turned off and lasts 300 s. The current intensity is recorded by the workstation system with the light turning on/off. The maximum photocurrent intensity in pure air is defined as Ia, and that in detected gas is Ig. The gas-sensing response S is defined as:  . In addition, all the measurements were taken at room temperature.
Acknowledgements
We are grateful to the National Science Foundation of China (No. 51572106), and the National Basic Research Program of China (973 Program) (2013CB632403), and the Science and Technology Developing Funding of Jilin Province (No. 20150203009GX).Notes and references
- T. Salthammer, Angew. Chem., Int. Ed., 2013, 52, 3320–3327 CrossRef CAS PubMed.
- P. R. Chung, C. T. Tzeng, M. T. Ke and C. Y. Lee, Sensors, 2013, 13, 4468–4484 CrossRef CAS PubMed.
- N. Noisel, M. Bouchard and G. Carrier, Regul. Toxicol. Pharmacol., 2007, 48, 118–127 CrossRef CAS PubMed.
- S. Sharma and M. Madou, Philos. Trans. R. Soc., A, 2012, 370, 2448–2473 CrossRef CAS PubMed.
- J. Zhang, S. Wang, M. Xu, Y. Wang, B. Zhu, S. Zhang, W. Huang and S. Wu, Cryst. Growth Des., 2009, 9, 3532–3537 CAS.
- N. Qin, Q. Xiang, H. Zhao, J. Zhang and J. Xu, CrystEngComm, 2014, 16, 7062–7073 RSC.
- C. Wang, J. Zhu, S. Liang, H. Bi, Q. Han, X. Liu and X. Wang, J. Mater. Chem. A, 2014, 2, 18635–18643 CAS.
- L. Liu, S. Li, J. Zhuang, L. Wang, J. Zhang, H. Li, Z. Liu, Y. Han, X. Jiang and P. Zhang, Sens. Actuators, B, 2011, 155, 782–788 CrossRef CAS.
- K. K. Korir, A. Catellani and G. Cicero, J. Phys. Chem. C, 2014, 118, 24533–24537 CAS.
- B. P. J. d. l. Costello, R. J. Ewen, N. M. Ratcliffe and M. Richards, Sens. Actuators, B, 2008, 134, 945–952 CrossRef.
- S. Mishra, C. Ghanshyam, N. Ram, R. P. Bajpai and R. K. Bedi, Sens. Actuators, B, 2004, 97, 387–390 CrossRef CAS.
- J. J. Yang, D. X. Li, Z. J. Zhang, Q. L. Li and H. Q. Wang, J. Photochem. Photobiol., A, 2000, 137, 197–202 CrossRef CAS.
- T. Tachikawa, M. Fujitsuka and T. Majima, J. Phys. Chem. C, 2007, 111, 5259–5275 CAS.
- L. Zhang, J. Zhao, H. Lu, L. Gong, L. Li, J. Zheng, H. Li and Z. Zhu, Sens. Actuators, B, 2011, 160, 364–370 CrossRef CAS.
- H. Fong, I. Chun and D. H. Reneker, Polymer, 1999, 40, 4585–4592 CrossRef CAS.
- S. Husain, F. Rahman, N. Ali and P. A. Alvi, Journal of Optoelectronics Engineering, 2013, 1, 28–32 Search PubMed.
- A. A. M. Farag, M. Cavas, F. Yakuphanoglu and F. M. Amanullah, J. Alloys Compd., 2011, 509, 7900–7908 CrossRef CAS.
- X. Wang, M. Zhao, F. Liu, J. Jia, X. Li and L. Cao, Ceram. Int., 2013, 39, 2883–2887 CrossRef CAS.
- J. Iqbal, B. Wang, X. Liu, D. Yu, B. He and R. Yu, New J. Phys., 2009, 11, 063009 CrossRef.
- Q. Zhao, D. Wang, L. Peng, Y. Lin, M. Yang and T. Xie, Chem. Phys. Lett., 2007, 434, 96–100 CrossRef CAS.
- Q. Zhang, D. Wang, X. Wei, Q. Zhao, Y. Lin and M. Yang, Mater. Chem. Phys., 2006, 100, 230–235 CrossRef CAS.
- X. Wei, T. Xie, D. Xu, Q. Zhao, S. Pang and D. Wang, Nanotechnology, 2008, 19, 275707 CrossRef PubMed.
- T. Jiang, T. Xie, W. Yang, H. Fan and D. Wang, J. Colloid Interface Sci., 2013, 405, 242–248 CrossRef CAS PubMed.
- J. Cui, D. Wang, T. Xie and Y. Lin, Sens. Actuators, B, 2013, 186, 165–171 CrossRef CAS.
- W. G. Chen, T. Y. Gao, H. L. Gan, L. N. Xu and L. F. Jin, Mater. Technol., 2015, 30, 356–361 CrossRef CAS.
- Y. Liu, M. Zhong, G. Shan, Y. Li, B. Huang and G. Yang, J. Phys. Chem. B, 2008, 112, 6484–6489 CrossRef CAS PubMed.
- R. Deng, B. Yao, Y. F. Li, Y. M. Zhao, B. H. Li, C. X. Shan, Z. Z. Zhang, D. X. Zhao, J. Y. Zhang, D. Z. Shen and X. W. Fan, Appl. Phys. Lett., 2009, 94, 022108 CrossRef.
- Z. Wu, Y. Wang, L. Sun, Y. Mao, M. Wang and C. Lin, J. Mater. Chem. A, 2014, 2, 8223–8229 CAS.
- Z. Zhang, C. Shao, X. Li, C. Wang, M. Zhang and Y. Liu, ACS Appl. Mater. Interfaces, 2010, 2, 2915–2923 CAS.
- L. Han, D. Wang, Y. Lu, T. Jiang, L. Chen, T. Xie and Y. Lin, Sens. Actuators, B, 2013, 177, 34–40 CrossRef CAS.
- J. Zhai, D. Wang, L. Peng, Y. Lin, X. Li and T. Xie, Sens. Actuators, B, 2010, 147, 234–240 CrossRef CAS.
- L. Han, D. Wang, J. Cui, L. Chen, W. Yan and Y. Lin, J. Mater. Chem., 2012, 22, 12915–12920 RSC.
- B. Pal, S. Dhara, P. K. Giri and D. Sarkar, J. Alloys Compd., 2015, 647, 558–565 CrossRef CAS.
- F. Zhao, J.-G. Zheng, X. Yang, X. Li, J. Wang, F. Zhao, K. S. Wong, C. Liang and M. Wu, Nanoscale, 2010, 2, 1674–1683 RSC.
- H. Zeng, G. Duan, Y. Li, S. Yang, X. Xu and W. Cai, Adv. Funct. Mater., 2010, 20, 561–572 CrossRef CAS.
- S. Bai, S. Chen, Y. Zhao, T. Guo, R. Luo, D. Li and A. Chen, J. Mater. Chem. A, 2014, 2, 16697–16706 CAS.
- S. Yamauchi, Y. Goto and T. Hariu, J. Cryst. Growth, 2004, 260, 1–6 CrossRef CAS.
- C. H. Ao, S. C. Lee, J. Z. Yu and J. H. Xu, Appl. Catal., B, 2004, 54, 41–50 CrossRef CAS.
- Z. Lou, L. Wang, T. Fei and T. Zhang, New J. Chem., 2012, 36, 1003–1007 RSC.
- N. Yamazoe, Sens. Actuators, B, 2005, 108, 2–14 CrossRef CAS.
- I. Mora-Sero, T. Dittrich, A. Belaidi, G. Garcia-Belmonte and J. Bisquert, J. Phys. Chem. B, 2005, 109, 14932–14938 CrossRef CAS PubMed.
- T. F. Xie, D. J. Wang, L. J. Zhu, C. Wang, T. J. Li, X. Q. Zhou and M. Wang, J. Phys. Chem. B, 2000, 104, 8177–8181 CrossRef CAS.
- V. Duzhko, V. Y. Timoshenko, F. Koch and T. Dittrich, Phys. Rev. B: Condens. Matter Mater. Phys., 2001, 64, 075204 CrossRef.
- V. Duzhko, F. Koch and T. Dittrich, J. Appl. Phys., 2002, 91, 9432–9434 CrossRef CAS.
- T. Dittrich and V. Duzhko, Phys. Status Solidi A, 2003, 197, 107–112 CrossRef CAS.
- L. Kronik and Y. Shapira, Surf. Sci. Rep., 1999, 37, 1–206 CrossRef CAS.
- H. Li, D. Wang, H. Fan, P. Wang, T. Jiang and T. Xie, J. Colloid Interface Sci., 2011, 354, 175–180 CrossRef CAS PubMed.
| This journal is © The Royal Society of Chemistry 2016 |

