Effect of chitosan quaternary ammonium salt on the growth and microcystins release of Microcystis aeruginosa
Yaowen Zhua,
Haiyan Pei*ab,
Wenrong Huab,
Yan Jina,
Hangzhou Xua,
Ying Rena and
Di Xuea
aSchool of Environmental Science and Engineering, Shandong University, Jinan, 250100, China. E-mail: haiyanhup@126.com; Fax: +86-531-88392983; Tel: +86-531-88392983
bShandong Provincial Engineering Center on Environmental Science and Technology, Jinan, 250061, China
First published on 11th August 2016
Abstract
Developing effective methods to control Microcystis aeruginosa (M. aeruginosa) bloom is significant for repelling the adverse impact from hepatotoxic microcystins (MCs). Chitosan quaternary ammonium salt (HTCC), a water-soluble derivative of chitosan, shows excellent antioxidant and antibacterial properties. The present study was the first to research the application potential of HTCC in M. aeruginosa control. Five experimental groups with different doses of HTCC (0, 0.6 mg L−1, 1.2 mg L−1, 2.4 mg L−1, and 4.8 mg L−1) were built to explore the effects of HTCC on the growth and physiological changes of M. aeruginosa and the release of intracellular matter. The results indicated that the growth of M. aeruginosa was effectively inhibited by HTCC, and the inhibition efficiency was dependent on dosage within 7 days (d). Especially for the treatment with 4.8 mg L−1 HTCC, the inhibitory rate remained above 93.6% after 7 d exposure. However, the integrity of M. aeruginosa cells treated with 2.4 and 4.8 mg L−1 HTCC may be damaged and partial MCs were released. Furthermore, the release of MCs in the 1.2 mg L−1 HTCC treated groups was significantly lower than that of the control sample. To balance the inhibition efficiency of M. aeruginosa and the release of MCs, 1.2 mg L−1 was chosen as the appropriate dose for inhibiting the growth of M. aeruginosa and reducing the release of MCs. HTCC could damage the antioxidant defense system of M. aeruginosa and exhibit the inhibitive property. The results demonstrated HTCC can be used as an effective and safe inhibitor to control algal blooms.
1. Introduction
Due to the excessive input of nutrients and pollution into water, eutrophication accompanied with algal blooming has become a worldwide problem.1–3 The cyanobacterial blooms usually break out along with the release of cyanotoxins and threaten aquatic and human life.4,5 M. aeruginosa, the most common harmful algal blooming species, is commonly observed in highly eutrophic water and can produce hepatotoxic MCs.6–8 Therefore, controlling and eliminating cyanobacterial blooms has become a significant issue.5,9Various chemical methods are widely adopted to control the growth of M. aeruginosa in water bodies, such as addition of algaecide (e.g., copper sulfate, chlorine), oxidizers (e.g., potassium permanganate and sodium hypochlorite), flocculants including FeCl3, AlCl3, polyaluminum chloride (PAC), and polyaluminum ferrous chloride (PAFC).10 These treatment processes are efficient in removing cyanobacteria cells. However, the persistence of some chemical compounds may potentially induce secondary pollution and harm aquatic organisms even humans.11 Consequently, it is necessary to improve the measures to control or eliminate cyanobacterial blooms with greater efficiency and less environmental impact.10 In recent years, natural plant agents (allelochemicals) have received attention as a biodegradable alternative to inorganic chemical agents.11–14 However, the biotechnological methods employed are not particularly effective due to the instability of the bio-components.15 Recently, nontoxic natural polymers with biocompatible and biodegradable properties have received much more attention because they are stable, efficient, and has less environmental impact.
Chitosan, a non-toxic and degradable natural polymer, considered as a new kind of coagulant, has been widely used in water treatment.16,17 However, it is insoluble in water, which limits its application in its original form. In recent years, N-(2-hydroxyl) propyl-3-trimethyl ammonium chitosan chloride (HTCC), a derivative of chitosan, was commercialized in China.18 When the quaternary ammonium salt group is added to the –NH2 of chitosan, the compound can be soluble in water while the advantages of chitosan also remained.19,20 In recent years, HTCC, characterized by flocculation, moisture absorption, and antibacterial properties, can be applied in many fields.21 Until now, most studies have focused on the antibacterial activity of chitosan and its derivatives, but little research has been involved in the application of HTCC to control cyanobacterial blooms.21–25
Hence, the objective of this study was to: (1) test the effects of HTCC on the growth of M. aeruginosa; (2) assess the effect of HTCC on extracellular organic matter and MCs release by M. aeruginosa; and (3) illustrate the potential mechanism of influence through changes in chlorophyll a (chl-a), intracellular protein, malondialdehyde (MDA), and superoxide dismutase (SOD) activity.
2. Materials and methods
2.1 M. aeruginosa culturing
M. aeruginosa FACHB-905 was purchased from the Freshwater Algae Culture Collection at the Institute of Hydrobiology, Chinese Academy of Sciences. The strain, which was known to produce MC-LR, was selected as model algae in this study. The strain was grown in BG11 medium at constant temperature (25 °C) under 2000 lx illumination with a light/dark cycle (12 h/12 h) in the laboratory. The M. aeruginosa was cultivated to an exponential growth phase (107 cells per mL) for experiments. Cell viability was determined by a fluorescence microscope (Nikon Ti-S, Japan) on days 0, 3, 5, and 7.2.2 Chemicals
Chitosan quaternary ammonium salt, namely N-(2-hydroxyl) propyl-3-trimethyl ammonium chitosan chloride (HTCC), was purchased from Tianhua Chemical Reagent Co. Ltd (Shandong, China). The molecular weight of HTCC is about 20![[thin space (1/6-em)]](https://www.rsc.org/images/entities/char_2009.gif) 000 and the degree of quaternary ammonium salt substitution is 98%. HTCC was dissolved in distilled water and stirred 30 min at 100 rpm by a magnetic stirrer to obtain a 1 g L−1 stock solution. The HTCC concentration was determined by spectrophotometric methods with a zincon–chitosan reaction.26
000 and the degree of quaternary ammonium salt substitution is 98%. HTCC was dissolved in distilled water and stirred 30 min at 100 rpm by a magnetic stirrer to obtain a 1 g L−1 stock solution. The HTCC concentration was determined by spectrophotometric methods with a zincon–chitosan reaction.26
2.3 Algal bioassays
M. aeruginosa culture (107 cells per mL) was inoculated into a conical flask to achieve an initial cell density of 106 cells per mL to simulate an algal bloom for all experiments.27,28 The algal cells were counted using microscopy by a hemocytometer (OLYMPUS CX31, Japan). Each conical flask was dosed with a quantitative HTCC stock solution (1 g L−1) to obtain 4 concentration groups (0.6 mg L−1, 1.2 mg L−1, 2.4 mg L−1, and 4.8 mg L−1). Each concentration and control group had three replicates and all groups were cultivated at 25 °C under 2000 lx illumination with a light/dark cycle (12 h/12 h) in the laboratory. The biovolume of M. aeruginosa was evaluated measuring the freeze-dried weight. The cells were harvested (12![[thin space (1/6-em)]](https://www.rsc.org/images/entities/char_2009.gif) 000 rpm, 12 min, 4 °C), triple-rinsed with distilled water, and freeze-dried (FDU-1200, EYELA, Japan). The weight of the freeze-dried cells was measured.
000 rpm, 12 min, 4 °C), triple-rinsed with distilled water, and freeze-dried (FDU-1200, EYELA, Japan). The weight of the freeze-dried cells was measured.
2.4 Chlorophyll-a
Chl-a is known as an important indicator of algal biomass.29 4 mL of culture was sampled and centrifuged at 12![[thin space (1/6-em)]](https://www.rsc.org/images/entities/char_2009.gif) 000 rpm for 10 min and the supernatant was discarded. Chl-a was extracted with methanol at 45 °C for 24 h in the dark. After centrifugation and discarding the supernatant the amount was determined using a UV-vis spectrophotometer (UV-2450, Shimadzu Instrument Co. Ltd, Japan) at 652.4, 665.2, and 750 nm. Chl-a content was calculated according to the following equation:30
000 rpm for 10 min and the supernatant was discarded. Chl-a was extracted with methanol at 45 °C for 24 h in the dark. After centrifugation and discarding the supernatant the amount was determined using a UV-vis spectrophotometer (UV-2450, Shimadzu Instrument Co. Ltd, Japan) at 652.4, 665.2, and 750 nm. Chl-a content was calculated according to the following equation:30| Chl-a (μg mL−1) = 16.72A665.2 − 9.16A652.4 |
Inhibitory rate (IR) was determined by the following formula:
| IR (%) = (1 − C/C0) × 100% |
2.5 Extracellular MCs
All samples were filtered through syringe drive filter units. The extracellular MCs in filtrate fractions were determined using Beacon's Microcystin Plate Kits (Beacon Analytical System Inc., ME, USA). The extracellular MCs concentrations were calculated according to the standard curve as μg L−1 of microcystin-leucine-arginine (MC-LR) equivalents.2.6 Extracellular protein
The extracellular protein was determined using a fluorescence excitation–emission matrix (EEM). Each sample was filtrated by a 0.45 μm filter membrane for extracellular protein analysis by a fluorescence spectrophotometer (F-4600, Hitachi, Japan) every day. The excitation wavelengths were increased from 200 to 450 nm in 5 nm steps, and the emission spectra (range 220 to 550 nm) were evaluated in 1 nm steps. Excitation and emission slits were both maintained at 5 nm and the scanning speed was set at 2400 nm min−1.312.7 Effect on physiological indicators
All samples were centrifuged at 12![[thin space (1/6-em)]](https://www.rsc.org/images/entities/char_2009.gif) 000 rpm for 10 min to collect algal cells. Then, algal cells were re-suspended with phosphate buffer (50 mM, pH 7.0) and homogenized by an ultrasonic cell pulverizer (JY92-2D, Xinzhi Co., Ltd, China) with ice-bath cooling for 10 min (600 W, ultrasonic time: 2 s; rest time: 8 s). After that, the homogenate was centrifuged at 12
000 rpm for 10 min to collect algal cells. Then, algal cells were re-suspended with phosphate buffer (50 mM, pH 7.0) and homogenized by an ultrasonic cell pulverizer (JY92-2D, Xinzhi Co., Ltd, China) with ice-bath cooling for 10 min (600 W, ultrasonic time: 2 s; rest time: 8 s). After that, the homogenate was centrifuged at 12![[thin space (1/6-em)]](https://www.rsc.org/images/entities/char_2009.gif) 000 rpm for 15 min and the cell-free enzyme supernatant was stored at −20 °C for further use.33 The intracellular protein levels were determined by the Bradford method33 using bovine serum albumin as standard. Malondialdehyde (MDA) content was measured by a colorimetric method.34 Superoxide dismutase (SOD) activity was measured according to the method of Beauchamp and Fridovich.33 The intracellular MCs were determined using Beacon's Microcystin Plate Kits (Beacon Analytical System Inc., ME, USA).
000 rpm for 15 min and the cell-free enzyme supernatant was stored at −20 °C for further use.33 The intracellular protein levels were determined by the Bradford method33 using bovine serum albumin as standard. Malondialdehyde (MDA) content was measured by a colorimetric method.34 Superoxide dismutase (SOD) activity was measured according to the method of Beauchamp and Fridovich.33 The intracellular MCs were determined using Beacon's Microcystin Plate Kits (Beacon Analytical System Inc., ME, USA).
3. Results and discussion
3.1 The effects of HTCC on the growth of M. aeruginosa
Chl-a is an important factor in determining the biomass of M. aeruginosa. The concentration of chl-a was in proportion to cell density.35 The chl-a content of M. aeruginosa was determined as shown in Fig. 1. The chl-a content showed an obvious increase with prolonged time in the control group. Compared with the control group, the chl-a of M. aeruginosa was reduced at all four tested concentrations (0.6 mg L−1, 1.2 mg L−1, 2.4 mg L−1, and 4.8 mg L−1) during the 7 d test period. Moreover, the inhibition effect gradually increased from 0.6 to 4.8 mg L−1 HTCC, indicating the inhibition rates of different groups were dependent on the HTCC concentration within 7 days. In Fig. 1, the maximal inhibition of M. aeruginosa growth was achieved on the seventh day at the HTCC concentration of 4.8 mg L−1 and the maximal inhibition ratio was 93.6% (Table 1). The results suggested that HTCC showed a potent inhibitory effect on algal cells and the effective doses ranged from 0.6 to 4.8 mg L−1.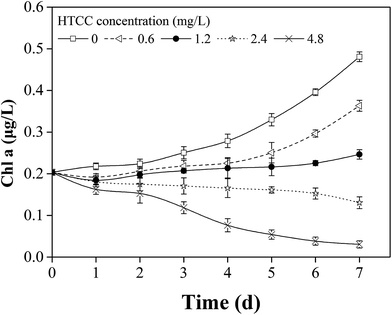 | ||
| Fig. 1 The changes of chlorophyll-a concentration of M. aeruginosa at different HTCC doses during the experimental time. | ||
| Cultivation time (d) | Inhibitory rate (%) | |||
|---|---|---|---|---|
| 0.6 mg L−1 | 1.2 mg L−1 | 2.4 mg L−1 | 4.8 mg L−1 | |
| 1 | 11.8 | 15.3 | 17.0 | 25.3 |
| 2 | 8.0 | 11.8 | 22.0 | 31.9 |
| 3 | 12.9 | 17.3 | 31.9 | 52.7 |
| 4 | 20.6 | 24.8 | 41.7 | 73.0 |
| 5 | 24.0 | 34.3 | 51.1 | 83.6 |
| 6 | 25.1 | 43.0 | 61.4 | 90.3 |
| 7 | 24.5 | 48.7 | 72.9 | 93.6 |
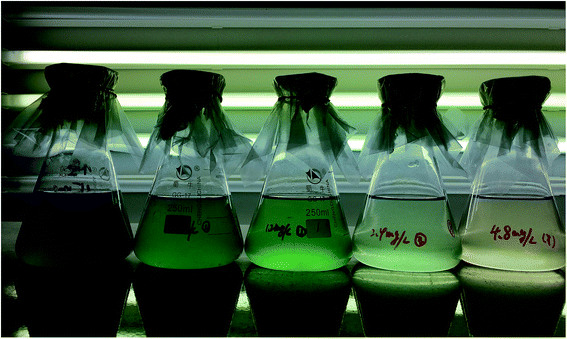
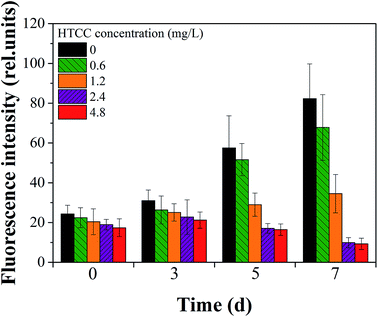
To further demonstrate the efficacy of HTCC intuitively, the inhibitory effect of each group on the 7th day are shown in Fig. 2. It could be seen that the inhibition effect gradually increased from 0.6 mg L−1 to 4.8 mg L−1 HTCC and the biomass of M. aeruginosa was least on the seventh day at the HTCC concentration of 4.8 mg L−1. This was consistent with the change of chl-a (Fig. 1). Cell viability based on chl-a auto-fluorescence analysis was used to assess the integrity of M. aeruginosa cells.36 We explored the cytomorphology with auto-fluorescence to verify the membrane integrity of cells in all groups (Fig. 3). Further, to quantify the fluorescence intensity, the mean fluorescence intensity of cells in different treatments was calculated using the Image J program (NIH, USA, Version: ij150-win-jre6-32-bit). It could be seen that after 5 d of exposure, HTCC caused remarkable change in the auto-fluorescence of M. aeruginosa cells (Fig. 4). The fluorescence intensity of M. aeruginosa cells in the control and the dose of 0.6 mg L−1 group showed an obvious increase while those in treatments at high concentration (2.4 mg L−1 and 4.8 mg L−1) showed a gradual decline with the increase of HTCC. The results demonstrated that chlorophyll, one of the most important intracellular auto-fluorescence materials, might be damaged by the HTCC. This is consistent with many previous correlation studies where the activity of photosynthesis in some species of phytoplankton is inhibited by allelochemicals because of dysfunction in the photosystem.11
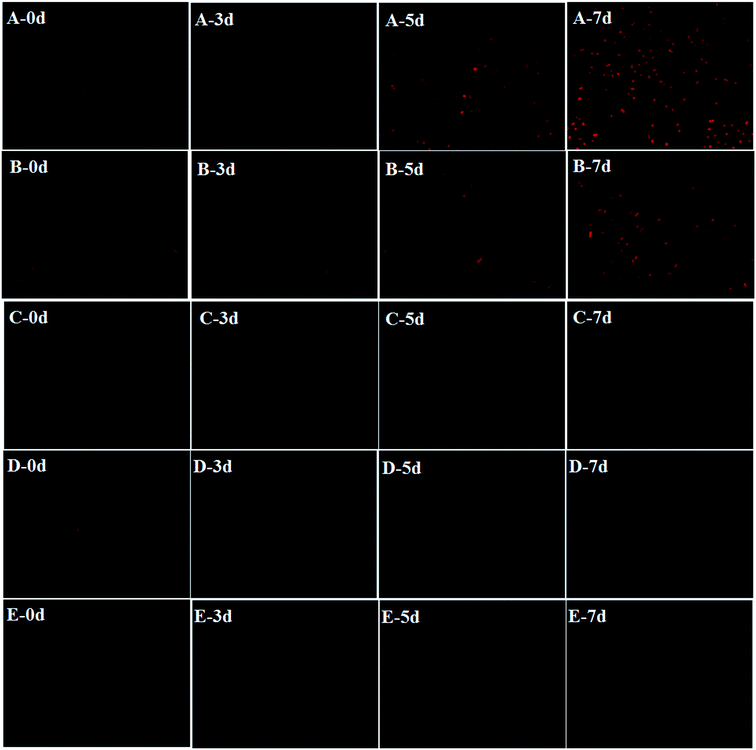 | ||
| Fig. 3 Cell viability microscope images in different doses of HTCC. (A): control, (B): 0.6 mg L−1, (C): 1.2 mg L−1, (D): 2.4 mg L−1, and (E): 4.8 mg L−1, respectively, at 0, 3, 5, and 7 d. | ||
3.2 Effects on extracellular organic matter and toxin release
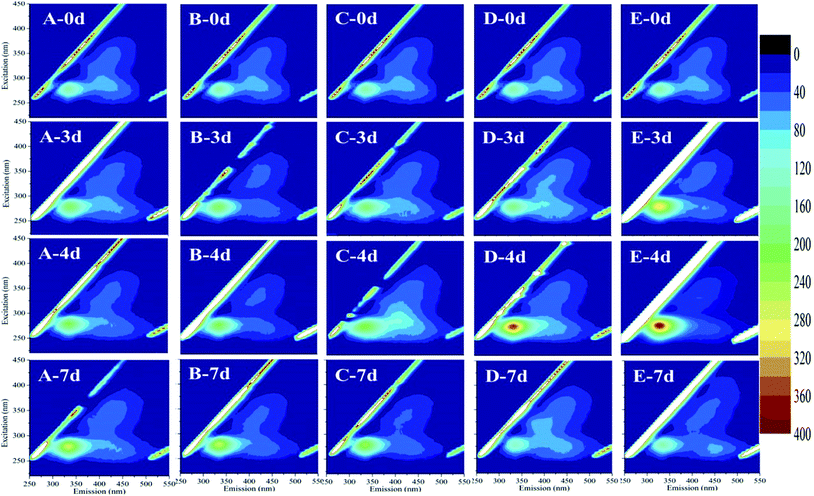
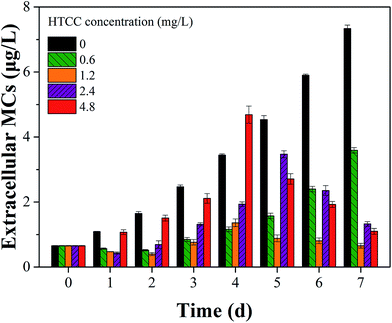
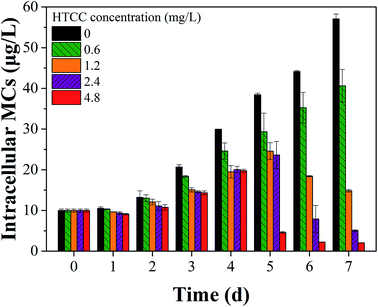
Fluorescence EEM is a rapid, selective, and sensitive technique to distinguish organic compounds in water.37 Some studies reported that cyanobacteria exhibited fluorescence from the tryptophan-like aromatic substances with a peak at Ex/Em pairing of around 230/360 nm.38,39 In this study, EEM tests had an insight into the variation of M. aeruginosa cellular components after exposure to HTCC. Fig. 5 showed selected EEMs of the growth phase (0, 3, 4, and 7 d after exposure). According to previous reports, the peak observed at Ex/Em of 280/335 nm is related to protein-like substances.37,40 For initial HTCC concentrations of 2.4 and 4.8 mg L−1, after 4 d of exposure, the release of protein-like substances was higher than that of the control group while the treatment groups at low concentration (0.6 mg L−1 and 1.2 mg L−1) was broadly unchanged. This indicated that the high concentration of HTCC damaged the alga cells and released intracellular organic matter.As we know, MCs may be released from Microcystis species when the cell wall cracks.5,41 Therefore, the effect of HTCC on MCs release is a crucial factor of ecological safety when using HTCC as an inhibitor for controlling algal growth. In this experiment, to assess the release of toxin from M. aeruginosa cells, the concentrations of intracellular and extracellular MCs in the control and treated groups were determined every day (Fig. 6 and 7). The initial value of intracellular and extracellular MCs were 0.66 μg L−1 and 9.98 μg L−1 (1.0 × 10⁶ cells per mL), respectively. Due to the intracellular MCs released in the phase of normal cell growth, the extracellular MCs of the control sample gradually increased with time and reached up to 7.40 μg L−1 on the 7th day. Compared with the initial value of extracellular MCs, the extracellular MCs were restrained by 0.6 mg L−1, 1.2 mg L−1, and 2.4 mg L−1 HTCC on the first day. This was because the presence of amino and hydroxyl groups gave HTCC powerful adsorptive capacity.42 However, the integrity of M. aeruginosa cells treated with 4.8 mg L−1 HTCC may be damaged and partial MCs were released, which may lead to extracellular MCs increasing on the first day. Fortunately, the release of MCs in the treated groups were significantly lower than that of the control sample during the whole experimental period, except the MCs release in the treatment with 4.8 mg L−1 HTCC on the fourth day. It could be seen that the trend of extracellular MCs was also coincident with the extracellular protein-like substances and intracellular MCs (Fig. 7). For 0.6 mg L−1 HTCC, similar to the control group, the intracellular and extracellular MCs increased significantly over time, which indicated that its inhibition was less effective. When the exposure time was extended to 4 d, extracellular MCs in the group exposed to 4.8 mg L−1 HTCC increased significantly compared to the 2.4 mg L−1 HTCC sample on the fifth day. When the culture time reached the 7th day, the extracellular MCs exposed at high concentration (2.4 mg L−1 and 4.8 mg L−1) of HTCC decreased, which can be explained by two primary factors: cyanobacteria cells were decreasing over time and partial extracellular MCs were removed through natural processes such as oxidation, microbial decomposition, and photodegradation.
As shown in Fig. 5 and 6, the inhibition effects of the groups treated with 2.4 and 4.8 mg L−1 HTCC were evident. However, M. aeruginosa cells exposed at high concentrations (2.4 and 4.8 mg L−1) of HTCC were damaged and intracellular MCs were released. This might increase the value of extracellular MCs. Nevertheless, for 0.6 mg L−1 HTCC, the growth curves were similar to that of the control group (Fig. 1) and the inhibiting ratio was low (Table 1). Moreover, during the test period, the peak value of extracellular MCs in the 1.2 mg L−1 HTCC treated group was lowest in all groups. Therefore, to balance the inhibition efficiency of M. aeruginosa and the release of MCs, 1.2 mg L−1 was chosen as an appropriate dose for inhibiting the growth of M. aeruginosa and reducing the release of intracellular MCs in this study.
3.3 Physiological response of M. aeruginosa
Physiological indicators (MDA, intracellular protein contents, and SOD activity) are frequently utilized to analyze the M. aeruginosa physiological response to algicide.43–45 The effects of HTCC on MDA, protein, and SOD activity of M. aeruginosa are observed in Fig. 8a–c. As is well known, the cell membranes of alga, made of unsaturated phospholipids, are vulnerable to reactive oxygen species (ROS).32 MDA, one of significant decomposition products of this process, has been used as a biological marker for vital sign readings of cellular oxidative damage.45 As shown in Fig. 8a, MDA content in this study showed an increase with prolonged exposure time and increasing exposure concentration. However, for initial HTCC concentrations of 0.6 mg L−1 and 1.2 mg L−1, MDA content increased slowly with time. When the exposure time was extended to 3 d, MDA content in the algal cells exposed to 4.8 mg L−1 HTCC increased significantly compared to the 2.4 mg L−1 HTCC sample on the fourth day (Fig. 8a). Indeed, it indicated that abnormal lipid peroxidation in M. aeruginosa was motivated by HTCC.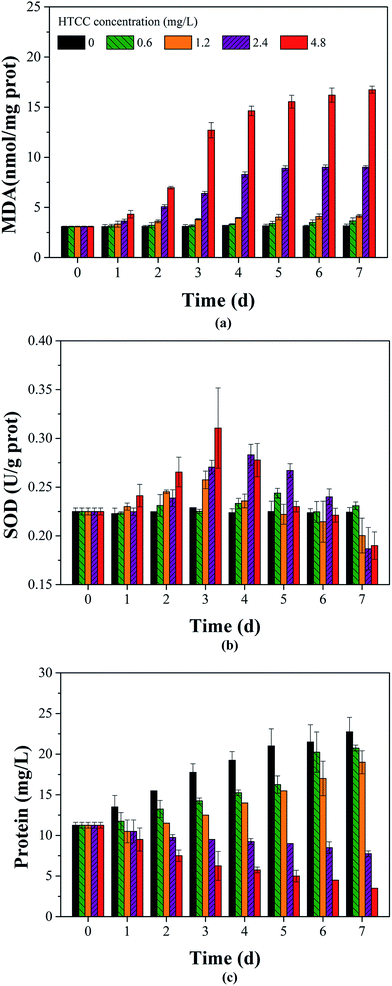 | ||
| Fig. 8 Effects of different HTCC concentrations on MDA (a), SOD activity (b) and intracellular proteins (c) in M. aeruginosa cells. | ||
SOD, one of the antioxidative defense mechanisms, can reflect cellular oxidative damage.46 Superoxide radicals and hydrogen can be used by SOD to produce hydrogen peroxide, oxygen, and resist against ROS.11,43 It can be seen in Fig. 8b, the SOD activity of M. aeruginosa increases observably within the first few days and then decreases. Moreover, when the exposure time was extended to 3 d, SOD activity of M. aeruginosa cells exposed to 4.8 mg L−1 HTCC was the highest compared to the 2.4 mg L−1 HTCC on the fourth day. This conclusion was consistent with the change of MDA content in the algal cells. This indicated that SOD was induced by HTCC in the preliminary stages as a response to the pressure. This was coincident with the effects on extracellular organic matter and toxins release in Section 3.2. It indicated that HTCC damaged the alga cell, and the damage degree was positive with dosage. MCs of M. aeruginosa cells exposed to 4.8 mg L−1 HTCC was highest on the 4th day, while the highest reading for 2.4 mg L−1 HTCC occurred on the 5th day. They implied that a large number of M. aeruginosa cell walls were cracked on the 3rd day exposed to 4.8 mg L−1 HTCC and this occurred on the 4th day in the 2.4 mg L−1 HTCC group. But the SOD decease with time was consistent with previous studies.43 This implied that HTCC could damage the antioxidant defense system and therefore, exhibit the inhibitive property.
From Fig. 8c, it can be seen that the intracellular protein content of alga cells were obviously decreased by HTCC, and the changes were consistent with that in chl-a (Fig. 1). Chl-a content reflects the photosynthetic rates while protein content reflects the activity of cell metabolism and cells density.11 The decrease of chl-a and protein content might explained by the inhibition of photosynthetic and protein synthesis by HTCC.
3.4 Comparison between HTCC and traditional chemicals
To explore the application prospect of HTCC in M. aeruginosa cells control further, we compared HTCC with some traditional chemical treatments. Copper sulfate is the most commonly used of the algaecides. As shown in Table 2, copper is known to be toxic to non-target organisms such as zooplankton, other invertebrates, and fish.28 There are some regulations to control the use of algaecides due to their adverse environmental impacts in many countries.47 Recently, a series of stable hydrogen peroxide compounds, as an alternative, have been developed to overcome the environmental issues associated with copper algicides.47 However, compared with other chemicals, it is less effective.48 A small number used potassium permanganate as an algaecide in reservoirs.49 Manganese ions will increase in the water bodies from the use of potassium permanganate, which influences the health of occupants. It can also cause coloration of the water and affect the coloration of the water body. Calcium hydroxide has been used as a method for algal control in Canada.50 As we know, it is a strong base and the pH will increase with more calcium hydroxide use, which may destroy the water body ecosystem. Furthermore, being unable to access light, sedimentary cells will become unhealthy, lyse, and eventually die, which will release MCs to water bodies.47| Chemical | Dose (mg L−1) | Degradability | Mechanism | Defect |
|---|---|---|---|---|
| CuSO4 | >0.1 | N | Disrupt cell function and cause cell lysis | Metal toxicity |
| H2O2 | 0.2–0.8 | Y | Oxidative damage to cell membranes | Less effective |
| KMnO4 | 1–8 | Y | Disrupt cell functions | Coloration of water |
| Ca(OH)2 | 250 | N | Precipitate the algae and phosphorus phosphorus | pH increases sedimentary cells may lyse and release MCs |
| HTCC | 1.2 | Y | Damage the antioxidant defense system | High cost |
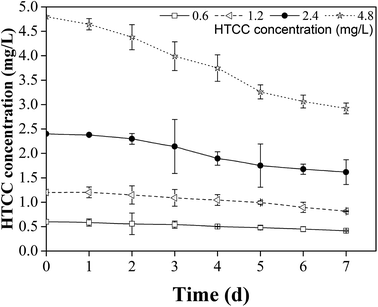
Compared with traditional inorganic compounds, HTCC has a greater efficiency and less environmental impact. Chitin is the second most abundant natural polymeric material. Furthermore, as the product of chitin deacetylation, chitosan is the only alkaline polysaccharide in nature.51 The chitosan molecule is converted to HTCC by one step, which is economical and efficient. In this study it has been shown that HTCC is effective at inhibiting M. aeruginosa growth and reducing the release of MCs. Furthermore, the powerful adsorptive capacity of HTCC also mitigates the harm of MCs. Additionally, HTCC had biodegradability to a certain extent and the degradation degree increases over time, which could be seen from Fig. 9. The maximal degradation rates of HTCC concentration in all treatment groups were achieved on the seventh day, and the difference between them was quite modest. It indicated that HTCC had certain stability during the experiments and resistance with the growth of M. aeruginosa. Therefore, HTCC has great potential application for the control of cyanobacterial blooms.
However, compared to other chemicals, HTCC has a high cost. Therefore, the actual additive dosage remains to be determined. For instance, Lake Taihu, as a potential drinking water source (volume 4.4 × 10¹³ L), is located in the east of China (30°05–32°08N, 119°08–122°55E). Microcystis was the predominant species in Lake Taihu in 2008 when the cyanobacterial abundance was close to the cell density in our study.52 It is predicted that approximately 5.28 × 10⁷ kg of HTCC would be needed when using the optimal dose (1.2 mg L−1) to inhibit Microcystis in Lake Taihu. In field applications, the use of HTCC at the early stages of proliferation may be the best approach to preemptively control cyanobacteria.53 According to the incident management plans on toxic cyanobacteria proposed by the International Guidance Manual for the Management of Toxic Cyanobacteria, when the cyanobacterial cell concentration exceeds 105 cells per mL, the main actions include treatment optimizations, continuation of the monitoring program, mouse test bioassays, and consideration of actions.47 Therefore, the actual requirement may be much less than estimated in this study. Moreover, further study on inhibitory characteristics will be done on the aquatic ecosystem before large-scale actual application is pursued.
4. Conclusions
In summary, the present work shows that HTCC has the potential ability to inhibit M. aeruginosa growth. The amount of extracellular microcystins in experimental groups was lower than that of the control group and 1.2 mg L−1 was the appropriate dose for inhibiting the growth of M. aeruginosa and reducing the release of MCs. The mechanism may be that HTCC destroys the photosynthesis-related structure of M. aeruginosa cells. As a water-soluble and biodegradable inhibitor, HTCC has great potential application for controlling cyanobacterial blooms. Inhibitory characteristics and inhibitory mechanisms will be further investigated in future studies.Acknowledgements
This work was supported by the International Science & Technology Cooperation Program of China (2010DFA91150), International Cooperation Research of Shandong Province (2011176), Science and Technology Development Project of Shandong Province (2012GHZ30020), National Science Fund for Excellent Young Scholars (51322811), The Program for New Century Excellent Talents in University of the Ministry of Education of China (NCET-12-0341), National Science Foundation of China (51478251).References
- E. S. Reichwaldt and A. Ghadouani, Water Res., 2012, 46, 1372–1393 CrossRef CAS PubMed.
- I. de Vicente, A. Merino-Martos, L. Cruz-Pizarro and J. de Vicente, J. Hazard. Mater., 2010, 181, 375–381 CrossRef CAS PubMed.
- L. Li and G. Pan, Environ. Sci. Technol., 2013, 47, 4555–4562 CrossRef CAS PubMed.
- S. Y. Liu, Y. P. Zhao, F. Ma, L. Y. Ma, K. O'shea, C. Zhao, X. H. Hu and M. H. Wu, RSC Adv., 2015, 5, 31292–31297 RSC.
- X. D. Wu, F. X. Kong, Y. W. Chen, X. Qian, L. J. Zhang, Y. Yu, M. Zhang and P. Xing, Limnologica, 2010, 40, 8–15 CrossRef CAS.
- B. Misson, M. Sabart, C. Amblard and D. Latour, Harmful Algae, 2012, 13, 20–25 CrossRef CAS.
- H. F. Qian, S. Q. Yu, Z. Q. Sun, X. C. Xie, W. P. Liu and Z. W. Fu, Aquat. Toxicol., 2010, 99, 405–412 CrossRef CAS PubMed.
- J. Rapala, K. Sivonen, C. Lyra and S. I. Niemelä, Appl. Environ. Microbiol., 1997, 63, 2206–2212 CAS.
- L. X. Ni, K. Acharya, X. Y. Hao and S. Y. Li, Chemosphere, 2012, 88, 1051–1057 CrossRef CAS PubMed.
- F. Sun, PhD thesis, Shandong University, 2013.
- C. Zhang, Y. L. Yi, K. Hao, G. L. Liu and G. X. Wang, Chemosphere, 2013, 93, 997–1004 CrossRef CAS PubMed.
- M. H. Park, I. M. Chung, A. Ahmad, B. H. Kim and S. J. Hwang, Aquat. Bot., 2009, 90, 309–314 CrossRef CAS.
- Y. H. Wu, S. Q. Zhang, H. J. Zhao and L. Z. Yang, Bioresour. Technol., 2010, 101, 9681–9687 CrossRef CAS PubMed.
- A. S. Ball, M. Williams, D. Vincent and J. Robinson, Bioresour. Technol., 2001, 77, 177–181 CrossRef CAS PubMed.
- S. S. Shalini, O. P. Karthikeyan and K. Joseph, Bioresour. Technol., 2010, 101, 845–852 CrossRef PubMed.
- F. Riske, J. Schroeder, J. Belliveau, X. Z. Kang, J. Kutzko and M. K. Menon, J. Biotechnol., 2007, 128, 813–823 CrossRef CAS PubMed.
- D. F. Zeng, J. J. Wu and J. F. Kennedy, Carbohydr. Polym., 2008, 71, 135–139 CrossRef CAS.
- Z. S. Cai, Z. Q. Song, C. S. Yang, S. B. Shang and Y. B. Yin, Polym. Bull., 2009, 62, 445–456 CrossRef CAS.
- V. A. Spinelli, M. C. M. Laranjeira and V. T. Favere, React. Funct. Polym., 2004, 61, 347–352 CrossRef CAS.
- R. A. A. Muzzarelli and F. Tanfani, Carbohydr. Polym., 1985, 5, 297–307 CrossRef CAS.
- R. Song, Z. H. Zhong and L. X. Lin, Int. J. Biol. Macromol., 2016, 85, 102–110 CrossRef CAS PubMed.
- Y. X. An, G. C. Jiang, Y. J. Ren, L. Y. Zhang, Y. R. Qi and Q. Y. Ge, J. Pet. Sci. Eng., 2015, 135, 253–260 CrossRef CAS.
- Z. S. Jia, D. F. Shen and W. L. Xu, Carbohydr. Res., 2001, 333, 1–6 CrossRef CAS PubMed.
- B. H. Yang, M. Li, Y. Wu, C. H. Deng, J. M. Cao and H. Zhang, Asian J. Chem., 2012, 24, 4022–4024 Search PubMed.
- K. N. Kalinov, M. G. Ignatova, N. E. Manolova, N. D. Markova, D. B. Karashanova and I. B. Rashkov, RSC Adv., 2015, 5, 54517–54526 RSC.
- G. Z. Gao, L. H. Ding, Q. C. Jiao, Y. L. Ding and L. Chen, Chin. J. Anal. Chem., 2003, 31, 1479–1481 CAS.
- C. W. K. Chow, M. Drikas, J. House, M. D. Burch and R. M. A. Velzeboer, Water Res., 1999, 33, 3253–3262 CrossRef CAS.
- I. Chorus and J. Bartram, Toxic cyanobacteria in water: a guide to their public health consequences, monitoring and management, E & FN Spon, London, 1999 Search PubMed.
- F. Sun, H. Y. Pei, W. R. Hu and C. X. Ma, Chem. Eng. J., 2012, 193, 196–202 CrossRef.
- H. K. Lichtenthaler, Methods Enzymol., 1987, 148, 350–382 CAS.
- L. Q. Jiang, H. Y. Pei, W. R. Hua, F. Han, L. J. Zhang and Q. J. Hou, Bioresour. Technol., 2015, 197, 178–184 CrossRef CAS PubMed.
- P. P. Meng, H. Y. Pei, W. R. Hu, Z. D. Liu, X. Q. Li and H. Z. Xu, Chemosphere, 2015, 141, 219–226 CrossRef CAS.
- C. Beauchamp and I. Fridovich, Anal. Biochem., 1971, 44, 276–287 CrossRef CAS.
- C. T. Shiu and T. M. Lee, J. Exp. Bot., 2005, 56, 2851–2865 CrossRef CAS.
- P. Li, Y. Song and S. Yu, Water Res., 2014, 62, 241–248 CrossRef CAS.
- R. I. Daly, L. Ho and J. D. Brookes, Environ. Sci. Technol., 2007, 41, 4447–4453 CrossRef CAS PubMed.
- L. Li, C. Shao, T. F. Lin, J. Y. Shen, S. L. Yu, R. Shang, D. Q. Yin, K. J. Zhang and N. Y. Gao, Environ. Sci. Technol., 2014, 48, 2885–2892 CrossRef CAS PubMed.
- C. Plaza, G. Brunetti, N. Senesi and A. Polo, Environ. Sci. Technol., 2006, 40, 917–923 CrossRef CAS.
- L. R. Dartnell, M. C. Storrie-Lombardi, C. W. Mullineaux, A. V. Ruban, G. Wright, A. D. Griffiths, J. P. Muller and J. M. Ward, Astrobiology, 2011, 11, 997–1016 CrossRef CAS.
- F. S. Qu, H. Liang, J. G. He, J. Ma, Z. Z. Wang, H. R. Yu and G. B. Li, Water Res., 2012, 46, 2881–2890 CrossRef CAS PubMed.
- Y. H. Wu, P. G. Kerr, Z. Y. Hu and L. Z. Yang, Bioresour. Technol., 2010, 101, 3903–3908 CrossRef CAS.
- M. S. Farid, A. Shariati, A. Badakhshan and B. Anvaripour, Bioresour. Technol., 2013, 131, 555–559 CrossRef CAS PubMed.
- Y. Hong, H. Y. Hu, X. Xie, A. Sakoda, M. Sagehashi and F. M. Li, Aquat. Toxicol., 2009, 91, 262–269 CrossRef CAS PubMed.
- X. Xiao, Y. X. Chen, X. Q. Liang, L. P. Lou and X. J. Tang, Chemosphere, 2010, 81, 1118–1123 CrossRef CAS PubMed.
- J. H. Shao, Y. Xu, Z. J. Wang, Y. G. Jiang, G. L. Yu, X. Peng and R. H. Li, Aquat. Toxicol., 2011, 104, 48–55 CrossRef CAS PubMed.
- C. H. Foyer and G. Noctor, Plant, Cell Environ., 2005, 28, 1056–1071 CrossRef CAS.
- G. Newcombe, International Guidance Manual for the Management of Toxic Cyanobacteria, Global Water Research Coalition, Australia, 2009 Search PubMed.
- W. H. Chen, Master degree thesis, Harbin Institute of Technology, 2010.
- G. P. Fitzgerald, J.–Am. Water Works Assoc., 1966, 58, 609–614 CAS.
- N. G. M. Schipper, S. Olsson, J. A. Hoogstraate, A. G. deBoer, K. M. Vårum and P. Artursson, Pharm. Res., 1997, 14, 923–929 CrossRef CAS.
- S. L. GU, F. Chen and J. L. Sun, Water Resour. Prot., 2011, 27, 28–32 Search PubMed.
- J. H. Shao, L. Peng, S. Luo, G. L. Yu, J. D. Gu, S. Lin and R. H. Li, J. Appl. Phycol., 2013, 25, 1567–1573 CrossRef.
- T. P. Murphy, E. E. Prepas, J. T. Lim, J. M. Crosby and D. T. Walty, Lake Reservoir Manage., 1990, 6, 101–108 CrossRef.
| This journal is © The Royal Society of Chemistry 2016 |

