Rashed H. Alremeithiab,
Mohammed A. Meetani*a,
Mu'ath K. Mousaa,
Na'il I. Saleha and
John Grahama
aChemistry Department, College of Science, United Arab Emirates University, P. O. Box 15551, Al-Ain, United Arab Emirates. E-mail: MMeetani@uaeu.ac.ae; Fax: +971 3 713 4928; Tel: +971 3 713 6136
bGeneral Department of Forensic Science and Criminology, Dubai Police, Dubai, United Arab Emirates
First published on 30th November 2016
Sensitive spectrofluorometric and liquid chromatography with fluorescence detection methods have been developed for detection and determination of para-aminohippuric acid (PAH), one of the commonly used markers for estimating effective renal plasma flow, in the presence of β-cyclodextrin (β-CD). Fluorescence signals have been enhanced with the addition of β-CD to the drug aqueous solution. The 1:
2 (host–guest) inclusion between PAH and cyclodextrin was evident by mass spectrometry and density functional theory (DFT) calculations supporting the formation of an excimer state at 355 nm. Factors that affect the PAH interaction with cyclodextrin have been investigated such as the size of the cyclodextrin cavity, the concentration of PAH, the concentration of cyclodextrin and pH effects. A calibration curve was established for the spectrofluorometric data of PAH with β-CD in the concentration range of 0.05–100 μM of PAH and the detection limit was 0.015 μM. HPLC with fluorescence detection was investigated in the presence of β-CD in the mobile phase. It was found that the calibration curve slope increased as the concentration of β-CD increased. Finally urine samples were spiked with 100 μM and 500 μM of PAH and showed recoveries in the range of 104–118% and 99.2–103%, respectively.
In the last two decades the macro cyclic oligosaccharides cyclodextrins, which consist of glucopyranose units attaching together, were reported to form enormous host–guest inclusion complexes, enhancing the analytical signal of the sequestrated guest molecules and therefore enhancing the sensitivity of their analytical detections in aqueous media. When the guest molecules are non-covalently encapsulated inside the cyclodextrin cavity, a modification of their chemical and physical properties always occurs due to the altered microenvironment, as well as confinement and isolation from the surrounding medium such as the enhancement in solubility and fluorescence emission.13–15 As a result, the use of cyclodextrins in improving drug solubility and stability and in particular in analytical sensing has increased in popularity.
Aimed at detection and determination of PAH utilizing the supramolecular approach of β-CD, a sensitive method is developed here using two techniques; spectrofluorometry and liquid chromatography with fluorescence detection. Fluorescence signals were enhanced with the addition of β-CD in aqueous solutions. The experimental conditions that gave the best results were investigated in terms of cyclodextrin cavity size, concentration of PAH, concentration of cyclodextrin, and pH effects. The interaction between PAH and cyclodextrin was investigated and considered as a host–guest inclusion which was evident by 1H-NMR, mass spectrometry and DFT calculations. A calibration curve was established from the spectrofluorometric HPLC with fluorescence detection data. Finally urine samples were spiked a known amount of PAH and recoveries were calculated.
Liquid chromatographic separation was conducted on Waters Symmetry C18 column (250 mm, 4.6 mm, 5 μm) at ambient temperature to achieve the chromatographic separations with isocratic elution. The mobile phase used was 90%, 0.1 M acetic acid in water, 10% acetonitrile and different concentrations of β-CD. The flow rate of the mobile phase was 1.0 ml min−1. The detection wavelengths were set at λex = 275 nm and λem = 355 nm.
1 mM PAH was prepared in deionized water as a stock solution and it was kept inside a dark vial in the refrigerator. The experimental samples (working) solutions were prepared fresh daily from that stock solution. A stock solution of β-CD was prepared in deionized water and it was kept at room temperature.
UV-visible measurements were conducted in order to know the right excitation wavelength of PAH for fluorescence measurements.
For the fluorescence measurements, the concentration of PAH was fixed and cyclodextrin concentration was varied. Different variables were tested in order to reach the best detection conditions. Cyclodextrin type, cyclodextrin concentration and pH were varied. pH was adjusted by adding aliquot amounts of HCl and KOH solutions and then measured using a WTW 330i pH meter with SenTix Mic glass electrode. The mobile phase composition was the same except the concentration of β-CD which was varied from 0–15 mM. The solution pH was adjusted to be 2.8 unless it was mentioned otherwise for specific experiment. The sample PAH was pure and no internal standard was thus needed for the spectrofluorometric measurements. On the other hand, analysis of PAH in urine samples was performed after the urine samples was diluted 1000 times without further sample processing. Calibration curve (1.0–500 μM) was prepared using urine as solvent matrix by spiking a known concentration of PAH and using a diluted urine solution to make the desired concentration.
ESI-MS measurement was done by direct infusion through a syringe pump for a mixture of 1 μM PAH and 0.1 mM β-CD at pH 7.
Proton NMR measurements were carried out using Varian, 400 MHz instrument. NMR spectra were collected for the β-CD and PAH separately in D2O solvent, then a mixture of 0.5 mM PAH and 10 mM β-CD in D2O was measured.
All calculations were performed using the Gaussian 09 program.16 The structures of free β-cyclodextrin and para-aminohippuric acid were optimized using the B3LYP functional17 and 6-31G(d) basis set. Initial structures of complexes between β-cyclodextrin and para-aminohippuric acid were optimized using the PM3 semiempirical method.18,19 Structures were optimized for binding of one PAH molecule outside and inside the β-CD ring. Additionally, a structure with two PAH molecules, aligned ‘head-to-tail’ within the β-cyclodextrin cavity was optimized. Resultant optimized structures were further optimized using B3LYP/3-21G followed by BYLYP/6-31G(d) density functional calculations. Binding energies for PAH with β-CD were calculated with single-point energy calculations on optimized structures, corrected for basis-set-superposition-error using the counterpoise method20,21 in Gaussian 09.
This investigation conforms to the UAE community guidelines for the use of humans in experiments. The Human Ethics committee at the Dubai police approves the study. Urine samples were collected at Dubai police with subjects consent.
![]() | ||
Fig. 1 UV-visible absorption spectra of 20 μM PAH in (1) water and (2) β-CD aqueous solution 5.5 μM at pH 4.06 (p-aminohipparic acid structure is shown at the top). |
![]() | ||
Fig. 2 Fluorescence spectra of 100 μM of PAH in water (pH 3.1) and hexane, excitation wavelength was 275 nm. |
Fig. 4 shows the fluorescence titration measurements of 10 μM PAH in aqueous solution of 0–3.57 mM of α, γ, and β-CD at pH 6.8. A clear fluorescence enhancement was observed at 355 nm in the presence of β-CD. In contrast, addition of α- and γ-CD enhances the peak at 305 nm.
The pH effect on the fluorescence behavior of PAH in the β-CD solution was also investigated. Fig. 5 shows the titration of 10 μM PAH with 4.09 mM β-CD in acidic, basic and neutral solutions. After the addition of the cyclodextrin, the fluorescence enhancement was more pronounced in the acidic over that in neutral or basic solutions (three vs. two times).
![]() | ||
Fig. 5 Titration of 10 μM PAH and 4.09 mM β-CD at: (A) acidic, pH 2.6, (B) basic, pH 10, and (C) neutral pH 6.8 solutions. |
Electrospray mass spectrometry (ESI-MS) has been used to investigate the interaction of the PAH with β-cyclodextrin. Fig. 6 shows the mass spectrum of [PAH–β-CD] complex, suggesting the formation of 2:
1 PAH
:
β-CD guest–host complex by showing a mass of 1524 Da.
Theoretical calculations of the guest–host interaction between the PAH and β-CD were conducted using Gaussian 09. The optimized structure of binding of PAH to β-CD outside the β-CD cavity is shown in ESI, Fig. 1S.† Four hydrogen bonding interactions between β-CD and PAH are predicted with bond lengths varying from 1.89 to 2.16 A. The total binding energy after basis set superposition error (BSSE) correction was calculated to be −18.2 kcal mol−1. The optimized structure for one PAH molecule encapsulated within the β-CD cavity is shown in ESI Fig. 2S.† The encapsulated PAH molecule is predicted to arrange within the β-CD cavity to maximize hydrogen-bonding between the carboxylic acid group and β-CD. Consequently, two hydrogen-bonding interactions are observed, with bond lengths of 1.71 and 1.92 A. These interactions occur on opposite sides of the cyclodextrin ring. Due to maximizing of these two interactions, the amino group of PAH appears to have little or no interaction with the β-CD ring. The calculated binding energy after BSSE correction is −15.3 kcal mol−1. Although this structure is calculated to have lower binding energy than that with the PAH molecule outside of the cavity, it may be preferred in aqueous solutions due to the displacement of water molecules from within the β-CD cavity. The optimized structure for two PAH molecules encapsulated within β-CD is show in Fig. 7. Hydrogen bonding interactions are predicted between the two PAH molecules, and between the PAH molecules and β-CD ring. The optimized structure shows 6 hydrogen-bonding interactions; two between the PAH molecules and four between PAH and β-CD. Bond lengths vary from 1.69 to 2.10 A. The calculated binding energy is =−34.0 kcal mol−1 after BSSE correction. Hence it appears that encapsulation of two PAH molecules is preferred over one, allowing for additional hydrogen-bonding interactions between the two PAH molecules, with subsequent enhancement in binding energy per molecule.
NMR measurements show that there was an inclusion of the PAH inside the cavity of the β-CD indicated by changes in the chemical shifts of the two protons on the ortho-position relative to amine group on the benzene ring, see Fig. 3S in the ESI.†
The observed enhancement in the fluorescence intensity at 355 nm could be used as a tool to develop a spectrofluorometric analytical method for detection and quantitation of PAH in aqueous media by the addition of β-CD. Fig. 8 shows the calibration curve of 0.05–100 μM solutions of PAH in the presence of 5 mM β-CD. The coefficient of determination shows a very good linearity over the tested concentration range. Moreover the limit of detection was calculated and found to be 0.015 μM according to IUPAC definition for the limit of detection in analysis.22
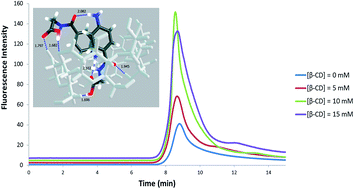
High performance liquid chromatography coupled with fluorescence detection was used to develop an analytical method for detection of PAH in urine samples. β-CD was added to the HPLC mobile phase at different concentrations in order to see its effect on the fluorescence detection (FLD) of PAH compound. Fig. 9 shows the HPLC-FLD chromatograms for 10 μM PAH in the presence β-CD at different concentrations (0–15 mM) in the mobile phase 0.1 M acetic acid in 90:
10 (water
:
acetonitrile). It was observed that the PAH peak area increased as the concentration of the β-CD is increased in the mobile phase.
![]() | ||
Fig. 9 HPLC-FLD chromatograms for 10 μM PAH in the presence of different concentrations of β-CD; mobile phase is 90% 0.1 M acetic acid in water, 10% acetonitrile. |
Fig. 10 shows the calibration curves of PAH (concentrations range 0.025–500 μM) at different concentrations of β-CD in the mobile phase. The correlation coefficients (R2) of these calibration curves show good linearity of the calibration results. Moreover, it was noted the slope of the calibration curves have shown an increase as the concentration of the β-CD increased which indicated its effect on the enhancement of the method sensitivity.
![]() | ||
Fig. 10 Calibration curves of PAH (conc range 0.025–500 μM) in aqueous solutions at different concentrations of β-CD in mobile phase. |
Fig. 11 shows the calibration curve of the PAH in urine matrix in the presence of 4-aminobenzoic acid as an internal standard and β-CD was added to the mobile phase. The curve was established over the concentration range of 1–500 μM. This curve was used to estimate the levels of PAH in urine after spiking it with two different concentrations of 100 μM and 500 μM.
![]() | ||
Fig. 11 Calibration curve of the HPLC-FLD data of PAH after dilution of urine sample in the presence of 15 mM β-CD in the mobile phase. |
Fluorescence measurements for PAH in aqueous and organic solutions are shown in Fig. 2, where two fluorescence peaks were observed in aqueous solution at 305 nm and 355 nm and one fluorescence peak at 395 nm was observed in hexane. These results indicate that the fluorescence behavior of PAH is affected by the solvent polarity in agreement with a previous report.2 This primary result encouraged us to study the effects of microenvironment by adding CD to the aqueous solution of PAH and see whether the PAH's fluorescence behavior would be affected or not. The effect of PAH concentration on the intensities of the fluorescence peaks at 305 nm and 355 nm with and without β-CD was obvious. Fig. 3 shows the fluorescence intensity is affected by changing the guest concentrations in the absence and presence of β-CD, supporting the assignment of the peak at 355 nm to the formation of excited dimer (excimer) at high concentration of PAH while the peak at low concentration is attributed to the monomer species. β-CD facilitates the excimer formation23,24 by sequestering two PAH molecules within its cavity (see theoretical modeling below). The results in Fig. 3 can be also explained by two scenarios depending on PAH concentration: at low concentration 1 μM, β-CD prevents aggregation and enhances the intensity of the monomer species over the dimer; at higher concentration of 10 μM, host–guest complexation does not compete with excimer formation and the macrocycle binds the dimer as a whole, enhancing its fluorescence intensity.
It was noticed that among the three types of the cyclodextrins tested, β-CD has shown an opposite trend to that observed upon the addition of other hosts, Fig. 4. This observation can be explained by the fact that only the larger β-CD cavity is capable of encapsulating two guest units when compared to the smaller cavity of α-CD. Moreover, the cavity size for the γ-CD cavity is very large compared to the size of the PAH molecule, leading to a weaker hydrophobic interaction with a singly encapsulated PAH molecule with a concomitant enhancement in the relevant intensity at 305 nm. We have selectively pursued the use of β-CD in the rest of this study since it shows the optimum size and produces the maximum enhancement of the PAH fluorescence.
The PAH contains an –NH2 group that can be protonated or remain neutral depending on the pH values, thus pH effects on the fluorescence behaviors of PAH in the absence and presence of β-CD solution in Fig. 5 were expected. In the absence of β-CD, the peak at 305 nm is comparable to that at 355 nm at low pH, but decreased relatively with the increase in pH. This is true, since protonation diminishes the extent of dimerization (in principle the dimer is between two neutral units). Thus in acidic media, the fluorescence intensity of the monomer is higher than that in basic and neutral solutions. The added β-CD thus enhanced much larger the already lower intensity of the dimer band at 355 nm in acidic media compared to that in neutral and basic media. It transpires that β-CD competes with the protonation of the –NH2 group in acidic media by virtue of the host–guest complexation, particularly when the concentration is above 10 μM (see Fig. 3 above).
Electrospray Tandem mass spectrometer (ESI-MS/MS) was used to ensure that the inclusion reaction is taking place between the PAH and β-CD, Fig. 6 shows the detection of m/z 1524 Da which correspond to the guest–host complex of (2:
1), where two PAH molecules are associated with one β-CD molecule. NMR data also confirm the guest–host interaction.
The theoretical calculations were performed in the gas phase and do not take into account interactions with solvent molecules. However, they do illustrate strong potential for binding of PAH to the rim of β-CD, and binding of PAH within β-CD. It is possible that binding within the β-CD ring is preferred, despite the lower calculated binding energy, due to the energetically favored displacement of water molecules from the β-CD cavity. The structure with two PAH molecules within the β-CD cavity appears to be even more favorable, introducing hydrogen-bonding between PAH molecules and between PAH and β-CD. The calculations indicate that such a complex is feasible with β-cyclodextrin and may promote the formation of an excimer upon excitation.
The observed enhancement in the fluorescence intensity at 355 nm could be used as a tool to develop a spectrofluorometric analytical method for detection and quantitation of PAH in aqueous media containing β-CD. Fig. 8 shows the calibration curve of 0.05–100 μM solutions of PAH in the presence of 5 mM β-CD. The coefficient of determination shows a very good linearity over the tested concentration range. Moreover, high performance liquid chromatography coupled with fluorescence detection was used to develop an analytical method for detection of PAH in urine samples. β-CD was added to the HPLC mobile phase at different concentrations in order to see its effect fluorescence detection of PAH compound. Fig. 9 shows the HPLC-FLD chromatograms for 10 μM PAH in the presence β-CD at different concentrations (0.0, 5.0, 10.0 and 15.0 mM) in the mobile phase which consist of 0.10 M acetic acid in 90:
10 (water
:
acetonitrile). It was observed that the PAH peak area of the 10 μM concentration has been increased as the concentration of the β-CD is increased in the mobile phase. Higher concentration of β-CD will raise the probability of host–guest inclusion interaction between β-CD and PAH, thus the complex formation will cause the changes that have been observed in spectral properties of PAH. This result agrees with scientific literature where it was reported that unmodified cyclodextrins can be used as fluorescence enhancing agent in analytical measurements.25
Analysis of the PAH in urine sample was conducted by spiking a diluted urine sample with a known concentrations of the PAH, 100 and 500 μM. The calibration curve (1–500 μM) shown in Fig. 11 was prepared in a urine matrix and was used to calculate the recovery of the spiked samples. Recovery ranges for 100 μM and 500 μM concentration were found to be in the ranges of 104–119% and 99–103%, respectively. It is possible to explain the high values of the recoveries above 100% by the fact that urine sample naturally contains some PAH that will show up even after the dilution that was used during the sample preparation. Comparing the limits of detection of the current method of HPLC-FLD in the presence of β-CD with those reported by other methods such as LC-MS/MS,11 the new method shows a comparable sensitivity (e.g. the limit of quantitation reported for LC-MS/MS was 0.2 mg L−1, while using the current method of HPLC-FLD limit of quantitation is 1 μM (equivalent to 0.195 mg L−1)).
Footnote |
† Electronic supplementary information (ESI) available. See DOI: 10.1039/c6ra11742b |
This journal is © The Royal Society of Chemistry 2016 |