Extracellular polymeric substances protect Escherichia coli from organic solvents†
Peng-Fei Xia,
Qian Li,
Lin-Rui Tan,
Xue-Fei Sun,
Chao Song and
Shu-Guang Wang*
School of Environmental Science and Engineering, Shandong University, 27 Shanda Nanlu, Jinan 250100, China. E-mail: wsg@sdu.edu.cn; Fax: +86-531-88364513; Tel: +86-531-88362802
First published on 17th June 2016
Abstract
The roles and functions of extracellular polymeric substances (EPS) have been intensively studied. Besides the significance of EPS in microbial multi-cellular structure formation, the interaction between EPS and external stressors was also investigated. However, seldom research studied how EPS response to organic solvents, a general type of chemicals in industry and potential pollutants in environments. In the present study, we found that EPS can response to n-butanol (n-BuOH) stress via excess secretion and varied composition, and EPS protect Escherichia coli from the n-BuOH stress. The extracellular proteins in EPS played a significant role in the protective effects via contributing to the surface hydrophobicity putatively by changing the secondary structure. We believe these findings would enable us to understand the functions of EPS in bacterial physiological activities better and benefit the EPS-related bioprocesses. This study would also provide us alternatives to utilize microorganisms with EPS excretion routine.
Introduction
Extracellular polymeric substances (EPS) are biomolecules secreted by microorganisms from cell lysis and the hydrolysis of macromolecules. EPS mainly consist of extracellular proteins (PN) and polysaccharides (PS), as well as extracellular DNA.1,2 These molecules provide abundant and various functional groups as binding sites, which promote the interaction between cells3–5 and facilitate the microbial functions in both natural geobiochemical processes and environmental bioprocesses.6–8 In particular, EPS are of grand importance in the multi-cellular structure formation of microbes, such as aggregates and biofilms. In the multi-cellular matrix, EPS usually serve as the scaffolds and maintain the EPS-and-microbe structures. It has been reported that microorganisms in aggregates and biofilms exhibit higher resistance to external stimuli and often have additional physiological properties compared with cells growing single-cellularly because of the unique structures formed by microbes and EPS.Despite the higher resistance and tolerance of cells in aggregates or biofilms toward external stress, EPS alone, as the most external layer of cells,9 work as biomolecular guards for microbes to defend the stressors in natural and engineered systems, such as antibiotics,10 heavy metals,11 disinfectants,12 and nanoparticles.13,14 Understanding the interactions between EPS and these stressors, which are usually environmental pollutants, would help with the development of novel environmental bioprocesses as well as benefit the potential application of microorganisms in the bio-remediation of contaminated water or soil ecosystems. Nevertheless, little information has been discovered about the interactions between EPS and organic solvents, a general type of chemicals in the industry and biosphere.15,16 Whether EPS also protect microorganisms from organic solvents is not clear.
Organic solvents are toxic to microorganisms.17 They bind to cells and destroy the membrane structure, then increase the membrane fluidity and permeability.18 Organic solvents cause accumulation of toxic metabolites, impairing vital cell functions, such as energy transduction, transport, and signaling,19 as well as disorder the translation initiation at the genetic level.20 Microorganisms have evolved a serial of strategies to recover from the organic solvent challenges,17,21,22 including structuring the membranes into a denser order and transforming chaperones to refold the denatured membrane proteins. If this envelope-associated mechanism cannot overcome the solvent stress, efflux pump systems will be activated to pump out the toxic stressors. Moreover, bacterial cell surface properties, which are largely influenced by EPS, also contribute to the tolerance of cells.23 Thus, we hypothesized that EPS also provide protection to microbes against organic solvents.
In the present study, we investigated the roles of EPS, especially the main components, PN and PS, in response to the organic solvent, n-butanol (n-BuOH), a promising gasoline alternative and additive.24 The Escherichia coli MG1655 was selected as the target microorganism. We evaluated the variation of PN and PS in the presence of n-BuOH and determined their protective effects. The interaction mechanisms underlying the protective roles of EPS were also discussed through surface analysis and fluorescence spectra.
Materials and methods
Strains, media, and reagents
E. coli MG1655 was obtained from CGSC (The Coli Genetic Stock Center, Yale University) and used for all experiments in the present study. Luria–Bertani (LB) media typically contained 10 g tryptone (Shangon Biotech, Shanghai, China), 5 g yeast extract (Shangon Biotech, Shanghai, China), and 10 g NaCl per liter of broth. All reagents, if not specified elsewhere, were bought from Sinopharm Chemical Reagent Co., Ltd (Beijing, China).Growth profiles
To assess the impact of n-BuOH on growth profiles, overnight culture were inoculated into the LB media containing 0, 0.25%, 0.50%, 0.75%, and 1.00% n-BuOH (all percentages were presented volumetrically), in a 500 mL flask at 37 °C, shaking at 220–230 rpm. The growth profiles under n-BuOH stress were recorded by measuring the optical density at 600 nm with a UV-2000 spectrophotometer (UNICO, USA) at different time intervals.EPS extraction and characterization
After the E. coli had been cultivated under different n-BuOH stress for 12 h, the EPS was extracted using the EDTA method at 4 °C to avoid the disturbance on PN and PS. The procedure was mainly followed by previous reports with minor revision.25,26 E. coli cells were harvested by centrifugation at 5000 rpm and 4 °C for 10 min and washed twice with PBS (pH 7.4). The cell pellets were then resuspended in PBS containing 2% EDTA and incubated at 4 °C for 3 h, followed by centrifugation at 10![[thin space (1/6-em)]](https://www.rsc.org/images/entities/char_2009.gif) 000 rpm for 60 min at 4 °C (3K15; Sigma, Germany). The supernatant was dialyzed for 24 h and filtered through 0.22 μm cellulose acetate membranes. This solution was considered as the EPS solution including PN and PS, while the pellets were considered as the E. coli cells without EPS.
000 rpm for 60 min at 4 °C (3K15; Sigma, Germany). The supernatant was dialyzed for 24 h and filtered through 0.22 μm cellulose acetate membranes. This solution was considered as the EPS solution including PN and PS, while the pellets were considered as the E. coli cells without EPS.
The PN content was determined by the Bradford method,27 using bovine serum albumin (BSA) as the standard, and the PS content was measured by the anthrone–sulphuric acid method,28 using glucose as the standard. The EPS solution was vacuum freeze-dried, and the precipitates were used for FTIR analysis.
Viability assessment
For viability assessment, the E. coli with and without EPS were washed with PBS, and, after resuspended, the initial CFU were measured. Then, 0.50% n-BuOH was added into the suspension and the CFU were measured after 2 h contacting. The loss of viability was recorded as the percentage of the CFU after impacted with n-BuOH into the initial ones.Hydrophobicity and zeta potential test
The hydrophobicity and zeta potentials were measured in both long-term test (n-BuOH added with cultivation) and short-term exposure (2 h contacting). In the long term test, E. coli cultivated under different n-BuOH stress for 12 h were prepared for hydrophobicity test. In short-term exposure tests, the hydrophobicity and zeta potential analysis were applied for cells before and after n-BuOH challenging for 2 h. The data of cells cultivated for 12 h in mere LB media were regarded as control. The hydrophobicity was measured using the microbial adhesion to hydrocarbons (MATH) test with n-dodecane.25,29 The cells were suspended in PBS, and the cell density (OD600) were adjusted to 0.50 ± 0.05. Four milliliters of the cell suspension was transferred to a test tube containing 1 mL n-dodecane. The test tube was vortexed for 2 min and then allowed to stand for 15 min for the separation between n-dodecane and saline phases. The OD600 in saline phase was measured, and the hydrophobicity was reported as the percentages of total cells partitioned into the n-dodecane phase. The zeta potentials were measured by a Zetasizer (3000HSA, Malvern, England) to characterizing the surface charge.In situ synchronous fluorescence analysis
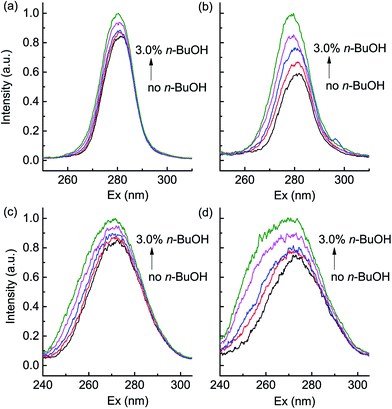
The EPS solution buffered with PBS (pH 7.4) was prepared as detailed above and different amount of n-BuOH was added into the solution to the final concentration of 0.5%, 1.0%, 2.0% or 3.0%. After stabilized at 37 °C for 30 min, the synchronous fluorescence spectra of EPS solution were collected by synchronously scanning the wavelength from 240 to 320 nm with a constant difference (Δλ = 15 nm for Tyr residues and Δλ = 60 nm for Trp residues) between excitation and emission wavelengths using a fluorescence spectroscopy (F-4600, Hitachi, Japan). The synchronous fluorescence spectra of BSA were also recorded to compare with the EPS data.Statistical analysis
All experiments were at least triplicated with similar results, and the error bars denote ±1 SD from the mean of independent experiments. The differences between data were evaluated using Student's t-tests with P ≤ 0.05 as significant differences.Results
EPS variation in the presence of n-BuOH
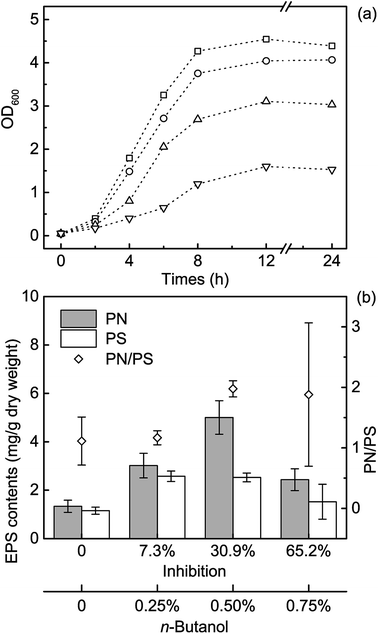
To assess the interactions between n-BuOH and the EPS secreted by microorganisms, we first investigated how E. coli respond to the n-BuOH stress. As reported, E. coli cannot survive in high n-BuOH stress, and E. coli will be seriously inhibited by 1% n-BuOH.30,31 Our experiments showed the similar results, and the results revealed that n-BuOH repressed the E. coli growth at all tested levels, especially when the concentration reached 0.75% (Fig. 1a). Thus, we assumed that, in the presence of ≤0.50% n-BuOH, the observed variation of EPS might represent the physiological responses of E. coli toward n-BuOH, and the interactions between EPS and n-BuOH at these levels were mainly investigated.The EPS contents were then measured under different testing levels of n-BuOH (Table S1†). To do so, E. coli cells were inoculated into LB media after overnight culture and cultivated for 12 h. Then the EPS were extracted and analyzed. As the results showed, the PN content was 1.34 ± 0.25 mg g−1 dry weight, and it increased when adding n-BuOH (Fig. 1b). Under 0.50% n-BuOH, the maximum of PN was obtained, which was 5.00 ± 0.69 mg g−1 dry weight. When the n-BuOH concentration continued to increase, however, the PN content decreased, implying the severe inhibition by 0.75% n-BuOH, which corresponded to the sharply decreased cell density and growth rate (Fig. 1a). The contents of PS shared the similar trends in a more gentle way. These differences increased the PN/PS ratio from 1.11 ± 0.40 to 1.96 ± 0.13 when n-BuOH reached 0.50%, suggesting an overwhelming fraction of PN (Fig. 1b).
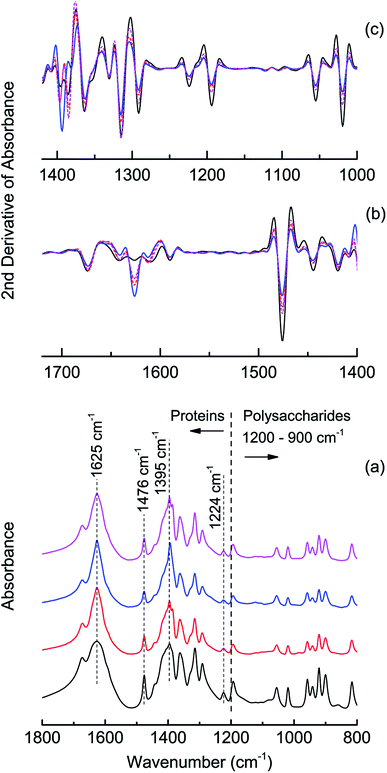
FTIR analysis further evidenced this variation (Fig. 2) and typical spectral bands (Table S2†) of the PN and PS were found in all spectra.5,12,32,33 From the 2nd-derivative-transformed spectra in the range of 1400–1000 cm−1 and 1700–1400 cm−1, changes were found in the range of 1590–1650 cm−1 after challenged with n-BuOH, indicating the structure variation in the amide I bands, and variation were identified from 1395 to 1500 cm−1, which included the bands implying deformations of CH2 and CH3 and the stretching of C![[double bond, length as m-dash]](https://www.rsc.org/images/entities/char_e001.gif) O of COO− groups in proteins. Corresponding to the changed amount of PS, differences could also be identified in 900–1200 cm−1 range which attributed to the functional groups in polysaccharides.
O of COO− groups in proteins. Corresponding to the changed amount of PS, differences could also be identified in 900–1200 cm−1 range which attributed to the functional groups in polysaccharides.
EPS protect the E. coli from n-BuOH
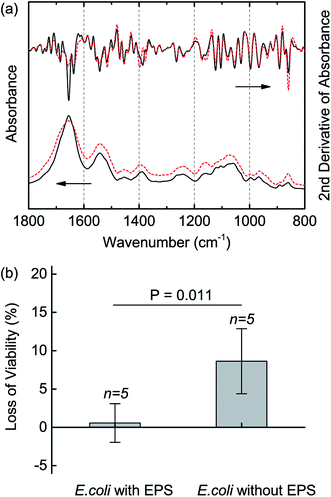
After discovered the varied EPS of E. coli in response to n-BuOH, we further evaluated whether the EPS protected E. coli when fighting n-BuOH. The EDTA method was used to extract the EPS and the loss of viability was compared between the cells with and without EPS in the presence of 0.50% n-BuOH. The FTIR spectra demonstrated the success of extraction of EPS in that both cells had typical bands assigned to proteins and polysaccharides, and differences, though slightly, can be identified in the region of 1600–1650 cm−1 and around 1400 cm−1 (Fig. 3a). The cells without EPS were then exposed to n-BuOH for 2 h and the survived cells were measured by CFU. The results showed that the E. coli without EPS lost about 8.63 ± 4.24% viability while the cells with EPS did not exhibit clear loss (Fig. 3b). The Student's t-test further verified the difference between viabilities of E. coli without and with EPS as significant. Thus, the evidence demonstrated that the EPS provided protection to E. coli against n-BuOH and the secretion of EPS would change in the presence of n-BuOH.EPS protect E. coli via mediating the cell surface hydrophobicity
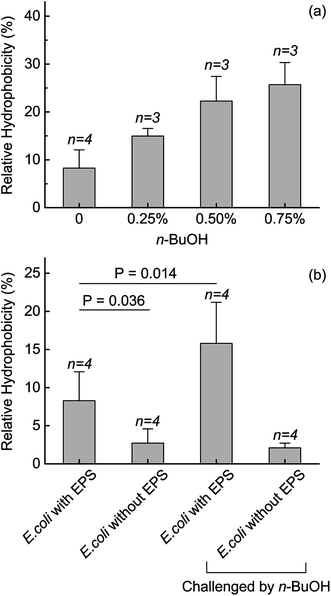
Unlike microbial toxins, such as antibiotics, which have specific targets to attack, organic solvents would induce multiple molecular, biochemical, and phenotypic variations. Thus, to elucidate the mechanisms underlying the protective roles of EPS, we assumed the surface properties as a direct reflect of the responses. The surface hydrophobicity of E. coli was measured after 12 h cultivated under n-BuOH stress. The data showed that the hydrophobicity rose from 8.27 ± 3.81% to 14.96 ± 1.58% and 22.28 ± 5.16% in the presence of 0.25% and 0.50% n-BuOH along with cultivation, respectively (Fig. 4a). This increase of hydrophobicity was correlated to the varied EPS contents in the same testing conditions. Also, we tested the surface hydrophobicity during a short-term exposure (2 h). When responding to n-BuOH, the surface hydrophobicity increased from 8.27 ± 3.81% to 15.80 ± 5.37% when contacted with 0.50% n-BuOH for 2 h. Nevertheless, after the EPS was extracted, the hydrophobicity decreased to 2.71 ± 1.58% and no clear difference can be identified under the same n-BuOH stress (Fig. 4b). These results indicated the dominant role of EPS participated in the variation of hydrophobicity, and interestingly, the variation of hydrophobicity, which mainly depended on the EPS, guaranteed the viability of E. coli in the presence of n-BuOH, thus further indicating the essential role of EPS. The zeta potential was also regulated by the EPS. In the short term exposure of 0.50% n-BuOH, the zeta potential of E. coli increased from −50.91 ± 2.95 mV to −48.41 ± 1.21 mV (Fig. S1†). After the EPS was extracted, the initial zeta potential was decreased to −47.61 ± 1.97 mV and contacting to n-BuOH did not change the zeta potential, indicating the importance of EPS in regulating the surface properties. Thus, we believe that the EPS protected the E. coli from n-BuOH via contributed to the variation of surface properties, especially in hydrophobicity.Dominant role of PN involved in the protective function of EPS
Considering the variation of PN and their contribution in surface hydrophobicity,34,35 it is reasonable to conclude that the varied hydrophobicity was regulated mainly by PN. The in situ synchronous fluorescence spectrum analysis reviewed that the secondary structure of proteins might contribute to the protective mechanism of PN involved in this response. To exam this assumption, the EPS was dissolved in PBS solution, and different amounts of n-BuOH, of which the concentrations were higher than the previous test, were added as a proof of idea analysis. After stabilized at 37 °C, the synchronous fluorescence spectra of EPS solution were collected by synchronously scanning the wavelength from 240 to 320 nm with a constant difference between the excitation wavelength and the emission wavelength. The spectra represented the characteristics of Tyr when the difference was 15 nm (Δλ = 15 nm), and it exhibited the properties of Trp when the difference was 60 nm (Δλ = 60 nm).36,37 The blue shifts were observed in both spectra of EPS from the E. coli ordinarily grown (Fig. 5a and c), plus, for the EPS extracted from the E. coli with 0.50% n-BuOH, there were also blue shifts in the spectra (Fig. 5b and d), indicating the increased hydrophobicity near the Trp and Tyr residues in PN. Also, the intensity of signals increased, which implied the two hydrophobic amino acids exposed more in the analytical environments. Interestingly, we could also read from the synchronous fluorescence spectra that the EPS from E. coli with 0.50% n-BuOH varied more sharply than that from the E. coli without n-BuOH. This difference could attribute to the changed PN content, and it provided information that the changed contents and composition of EPS from E. coli grew with n-BuOH responded more to the same n-BuOH stress. These findings demonstrated that the EPS, especially PN, was involved in the protective strategies when fighting n-BuOH.Discussion
EPS are secreted by microorganisms and usually contain proteins, polysaccharide, nucleic acids and lipopolysaccharides.1,38 In this study, we determined that EPS participate in the protective role because the E. coli would lose about 8.63% viability without EPS. Our results also suggested that, in response to n-BuOH stress, the bacteria altered the quantities and composition of EPS, preferably by increasing the amounts and proportion of PN, and the EPS would protect the E. coli cells from n-BuOH stress via regulating the surface properties.The toxicity of an organic solvent is highly related to its properties. Usually, this is expressed by log![[thin space (1/6-em)]](https://www.rsc.org/images/entities/char_2009.gif) Pow, where Pow denotes the octanol–water partition coefficient, and a solvent with a log
Pow, where Pow denotes the octanol–water partition coefficient, and a solvent with a log![[thin space (1/6-em)]](https://www.rsc.org/images/entities/char_2009.gif) Pow below 3.8 is considered toxic.18,22 However, unlike most hydrophobic solvents, such as toluene and hexanol, the log
Pow below 3.8 is considered toxic.18,22 However, unlike most hydrophobic solvents, such as toluene and hexanol, the log![[thin space (1/6-em)]](https://www.rsc.org/images/entities/char_2009.gif) Pow of n-BuOH is only 0.839, indicating a distinct interaction with the aqueous solution and the hydrophilic parts of biomolecules. As reported, the n-BuOH is a chaotropic solute,39,40 with the chaotropic activity of 37.4 kJ kg M−1. The high chaotropicity of n-BuOH would disturb the hydrophobic effects among the tails of the phospholipids as well as the structures of biomolecules maintained by the hydrophobic effects.40 Then, the cell physiology would be impacted. Additionally, as n-BuOH can travel through both the hydrophilic and hydrophobic parts of a biomolecule freely, some of the n-BuOH molecules might also insert between the hydrophobic parts and interfere the functions of the biomolecules. Thus, we assumed the inhibitory impacts of the n-BuOH attribute to both the chaotropicity and hydrophobicity.
Pow of n-BuOH is only 0.839, indicating a distinct interaction with the aqueous solution and the hydrophilic parts of biomolecules. As reported, the n-BuOH is a chaotropic solute,39,40 with the chaotropic activity of 37.4 kJ kg M−1. The high chaotropicity of n-BuOH would disturb the hydrophobic effects among the tails of the phospholipids as well as the structures of biomolecules maintained by the hydrophobic effects.40 Then, the cell physiology would be impacted. Additionally, as n-BuOH can travel through both the hydrophilic and hydrophobic parts of a biomolecule freely, some of the n-BuOH molecules might also insert between the hydrophobic parts and interfere the functions of the biomolecules. Thus, we assumed the inhibitory impacts of the n-BuOH attribute to both the chaotropicity and hydrophobicity.
Microorganisms evolved similar strategies to response to the inhibitory hydrophobicity and chaotropicity.41 Bacteria regulate the surface properties, especially the hydrophobicity, to direct response to the organic solvent with a specific log![[thin space (1/6-em)]](https://www.rsc.org/images/entities/char_2009.gif) Pow and chaotropicity. As the “outermost layer” of bacteria cells, EPS significantly influence the surface property and it might defense the cells from n-BuOH by contributing to the surface hydrophobicity.
Pow and chaotropicity. As the “outermost layer” of bacteria cells, EPS significantly influence the surface property and it might defense the cells from n-BuOH by contributing to the surface hydrophobicity.
We discovered that the surface hydrophobicity increased when n-BuOH was added along with cultivation. It was in agreement with previous report that Gram-negative bacteria, Pseudomonas putida DOT-T1E, would rise the surface hydrophobicity as an active response in the presence of organic solvent.23,42 This increase would probably facilitate the membrane to attract more solvents, helping the efflux pumps to pump out the stressors.42 Moreover, we discovered the increase of hydrophobicity was correlated with the increased secretion of EPS in the same cultivation conditions, especially PN (Fig. 1 and 4). In the short term exposure test of n-BuOH on E. coli with and without EPS, the results showed the significance of EPS participating in the variation of surface hydrophobicity. In this test, the surface hydrophobicity would increase only when EPS existed, while, after the EPS was extracted, no clear difference of hydrophobicity can be identified. A clear correlation between the variation of surface hydrophobicity and loss of viability can be identified then, in that the change of hydrophobicity guaranteed the viability. Together with the contribution of EPS to hydrophobicity, these results evidenced the protective role of EPS toward n-BuOH was mainly contributing to regulating the hydrophobicity.
Previous works discovered that approximately 7% of the EPS were hydrophobic and mainly comprised of PN, whereas the PS mainly contributes to the hydrophilicity,34 and the analysis of amino acid contents exhibited that nearly 24% were hydrophobic.35 These findings implied that PN participated more in the variation of surface hydrophobicity, which was in agreement with the most obvious change of PN when E. coli were challenged by n-BuOH (Fig. 1). It is reasonable to conclude that the varied hydrophobicity was regulated mainly by PN.
The hydrophobicity of the microenvironments around residues was of great importance for the secondary structure of proteins.43 When a protein folds, the hydrophobic parts tend to bury into the core of protein due to the hydrophobic effect.44 So, the increase of hydrophobicity of Tyr and Trp displayed in the in situ fluorescence spectroscopy putatively indicate an undesired-folded status of PN when n-BuOH attacked, and the varied structure would lead to extra exposure of hydrophobic residues, thus raising the hydrophobicity. The BSA exhibited the similar results in the presence of n-BuOH (Fig. S2†), and the changed synchronous fluorescence spectra suggested the larger Trp residue (Trp 214), the one located inside, regulated the conformation.44–47 Because of the chaotropicity and hydrophobicity of n-BuOH, we hypothesized that the n-BuOH might accumulate in both the hydrophobic and hydrophilic domains of the PN encountered, thus resulting the variations of the protein conformation. In the meanwhile, the accumulated n-BuOH could be considered being trapped in the PN and the inhibitory effects of n-BuOH were alleviated.
Conclusions
In the present study, we hypothesized and demonstrated that EPS offer protection to E. coli against n-BuOH. We reported that: (I) in the presence of n-BuOH, the secretion of EPS wound be induced and the components of EPS would change when E. coli encountered n-BuOH stress in the media, (II) the EPS protected E. coli from n-BuOH stress mainly through the cell surface properties, especially hydrophobicity, and (III) the PN in EPS played the most important role in the protection via changing the conformations, and putatively PN with varied structure trapped parts of the n-BuOH thus alleviating the stress. We believe these findings would enable us to understand the roles of EPS in bacterial physiological activities better, benefit the EPS-related bioprocesses and provide us alternatives to engineer microorganisms with EPS excretion routine.Conflict of interest
The authors declare that they have no conflict of interest.Acknowledgements
This research was supported by the National Natural Science Foundation of China (21476130).References
- G.-P. Sheng, H.-Q. Yu and X.-Y. Li, Biotechnol. Adv., 2010, 28, 882–894 CrossRef CAS PubMed.
- H. Lin, M. Zhang, F. Wang, F. Meng, B.-Q. Liao, H. Hong, J. Chen and W. Gao, J. Membr. Sci., 2014, 460, 110–125 CrossRef CAS.
- L. Hall-Stoodley, J. W. Costerton and P. Stoodley, Nat. Rev. Microbiol., 2004, 2, 95–108 CrossRef CAS PubMed.
- J. Wingender, T. R. Neu and H. C. Flemming, Microbial Extracellular Polymeric Substances: Characterization, Structure, and Function, Springer, 1999 Search PubMed.
- K. Eboigbodin and C. Biggs, Biomacromolecules, 2008, 9, 686–695 CrossRef CAS PubMed.
- W. Zhang, S. Peng, P. Xiao, J. He, P. Yang, S. Xu and D. Wang, RSC Adv., 2015, 5, 1282–1294 RSC.
- T. Zhang, Q. Wang, J. Khan and Z. Yuan, RSC Adv., 2015, 5, 43312–43318 RSC.
- T. Zhu and M. Dittrich, Front. Bioeng. Biotechnol., 2016, 4, 4 CrossRef PubMed.
- S. Zhang, Y. Jiang, C.-S. Chen, J. Spurgin, K. Schwehr, A. Quigg, W.-C. Chin and P. Santschi, Environ. Sci. Technol., 2012, 46, 8764–8772 CrossRef CAS PubMed.
- Y. Shi, S. Xing, X. Wang and S. Wang, Bioresour. Technol., 2013, 139, 170–175 CrossRef CAS PubMed.
- G. Teitzel and M. Parsek, Appl. Environ. Microbiol., 2003, 69, 2313–2320 CrossRef CAS PubMed.
- Z. Xue, C. Hessler, W. Panmanee, D. Hassett and Y. Seo, FEMS Microbiol. Ecol., 2013, 83, 101–111 CrossRef CAS PubMed.
- C. M. Hessler, M.-Y. Wu, Z. Xue, H. Choi and Y. Seo, Water Res., 2012, 46, 4687–4696 CrossRef CAS PubMed.
- N. Joshi, B. T. Ngwenya and C. E. French, J. Hazard. Mater., 2012, 241–242, 363–370 CrossRef CAS PubMed.
- A. Putthividhya, J. J. Kukor and L. M. Abriola, Environ. Earth Sci., 2016, 75, 1–11 CrossRef CAS.
- N. Iwabuchi, in Biodegradative Bacteria, Springer, 2014, pp. 313–333 Search PubMed.
- A. Segura, L. Molina, S. Fillet, T. Krell, P. Bernal, J. Muñoz-Rojas and J.-L. Ramos, Curr. Opin. Biotechnol., 2012, 23, 415–421 CrossRef CAS PubMed.
- A. Segura, E. Duque, G. Mosqueda, J. L. Ramos and F. Junker, Environ. Microbiol., 1999, 1, 191–198 CrossRef CAS PubMed.
- H. Oh, J. Lee and O. Kim, Appl. Microbiol. Biotechnol., 2012, 96, 1619–1627 CrossRef CAS PubMed.
- P. Ghiaci, J. Norbeck and C. Larsson, Biotechnology for Biofuels, 2013, 6, 101 CrossRef CAS PubMed.
- J. Ramos, T. Krell, C. Daniels, A. Segura and E. Duque, Curr. Opin. Microbiol., 2009, 12, 215–220 CrossRef CAS PubMed.
- M. J. Dunlop, Biotechnology for Biofuels, 2011, 4, 32 CrossRef CAS PubMed.
- T. Baumgarten, J. Vazquez, C. Bastisch, W. Veron, M. Feuilloley, S. Nietzsche, L. Wick and H. Heipieper, Appl. Microbiol. Biotechnol., 2012, 93, 837–845 CrossRef CAS PubMed.
- S. Atsumi, T. Hanai and J. Liao, Nature, 2008, 451, 86–89 CrossRef CAS PubMed.
- S. Walker, J. Hill, J. Redman and M. Elimelech, Appl. Environ. Microbiol., 2005, 71, 3093–3099 CrossRef CAS PubMed.
- G.-P. Sheng, H.-Q. Yu and Z. Yu, Appl. Microbiol. Biotechnol., 2005, 67, 125–130 CrossRef CAS PubMed.
- M. M. Bradford, Anal. Biochem., 1976, 72, 248–254 CrossRef CAS PubMed.
- F. R. A. N. K. A. Loewus, Anal. Chem., 1952, 24, 219 CrossRef CAS.
- R. Aono and H. Kobayashi, Appl. Environ. Microbiol., 1997, 63, 3637–3642 CAS.
- J. Lee, K. Yang, S. Jang, B. Sung and S. Kim, Biotechnol. Bioeng., 2011, 108, 742–749 CrossRef CAS PubMed.
- D. T. Jones and D. R. Woods, Microbiol. Rev., 1986, 50, 484–524 CAS.
- S.-J. Yuan, M. Sun, G.-P. Sheng, Y. Li, W.-W. Li, R.-S. Yao and H.-Q. Yu, Environ. Sci. Technol., 2011, 45, 1152–1157 CrossRef CAS PubMed.
- K. Eboigbodin, J. Ojeda and C. Biggs, Langmuir, 2007, 23, 6691–6697 CrossRef CAS PubMed.
- F. Jorand, F. Boue-Bigne, J. C. Block and V. Urbain, Water Sci. Technol., 1998, 37, 307–315 CAS.
- M.-F. Dignac, V. Urbain, D. Rybacki, A. Bruchet, D. Snidaro and P. Scribe, Water Sci. Technol., 1998, 38, 45–53 CAS.
- Z. Wang, J. Chen, S. Wang and Z. Chen, J. Lumin., 2013, 134, 863–869 CrossRef CAS.
- Z. Chi, R. Liu and H. Zhang, Biomacromolecules, 2010, 11, 2454–2459 CrossRef CAS PubMed.
- H.-C. Flemming and J. Wingender, Nat. Rev. Microbiol., 2010, 8, 623–633 CrossRef CAS PubMed.
- J. A. Cray, J. T. Russell, D. J. Timson, R. S. Sinhal and J. E. Hallsworth, Environ. Microbiol., 2013, 15, 287–296 CrossRef CAS PubMed.
- J. A. Cray, A. Stevenson, P. Ball, S. B. Bankar, E. C. A. Eleutherio, T. C. Ezeji, R. S. Singhal, J. M. Thevelein, D. J. Timson and J. E. Hallsworh, Curr. Opin. Biotechnol., 2015, 33, 228–259 CrossRef CAS PubMed.
- P. Bhaganna, R. J. M. Volkers, A. N. W. Bell, K. Kluge, D. J. Timson, J. W. McGrath, H. J. Ruijssenaars and J. E. Hallsworth, Microb. Biotechnol., 2010, 3, 701–715 CrossRef CAS PubMed.
- G. Neumann, S. Cornelissen, F. van Breukelen, S. Hunger, H. Lippold, N. Loffhagen, L. Y. Wick and H. J. Heipieper, Appl. Environ. Microbiol., 2006, 72, 4232–4238 CrossRef CAS PubMed.
- E. Sandelin, Biophys. J., 2004, 86, 23–30 CrossRef CAS PubMed.
- K. A. Dill and J. L. MacCallum, Science, 2012, 338, 1042–1046 CrossRef CAS PubMed.
- T. Zhou, M. Ao, G. Xu, T. Liu and J. Zhang, J. Colloid Interface Sci., 2013, 389, 175–181 CrossRef CAS PubMed.
- Y.-J. Hu, Y. Liu, R.-M. Zhao, J.-X. Dong and S.-S. Qu, J. Photochem. Photobiol., A, 2006, 179, 324–329 CrossRef CAS.
- Z. Chi and R. Liu, Biomacromolecules, 2010, 12, 203–209 CrossRef PubMed.
Footnote |
| † Electronic supplementary information (ESI) available. See DOI: 10.1039/c6ra11707d |
| This journal is © The Royal Society of Chemistry 2016 |

