Micro-viscosity induced conformational transitions in poly-L-lysine

Kamatchi Sankaranarayanan*a and N. Meenakshisundaramb
aDepartment of Energy and Environment, NIT, Tiruchirapalli 620015, India. E-mail: kamatchi.sankaran@gmail.com; kamatchi@nitt.edu; Tel: +91-9790801563
bSchool of Electrical and Electronics Engineering, SASTRA University, Thanjavur 613401, India

Received 5th May 2016 , Accepted 28th July 2016

First published on 29th July 2016


Abstract

Protein aggregation triggered by conformational changes is considered to be one of the major reasons for neuro-degenerative diseases like Alzheimer's and Parkinson's. Poly-L-lysine (PLL) undergoes the α-helix-to-β-sheet transition which is considered as characteristic of protein aggregation. Understanding the role of viscosity in triggering these transitions is the main objective of this paper, and we have found out the ionic liquid 1-ethyl-3-methylimidazolium ethyl sulfate (IL-emes) and Ficoll induce such transitions in PLL, by using various techniques including circular dichroism, quartz crystal microbalance (QCM), tensiometry and Transmission Electron Microscopy (TEM). Irrespective of pH, viscosity tunes the native conformations of PLL to beta sheet conformations. Thioflavin T binding to PLL shows that these β-sheets are amyloidogenic. At the liquid/air interface, due to destabilization of the α-helical conformation of PLL at pH 10 with increasing concentrations of ionic liquid, an increase in surface activity is observed. TEM analysis shows macromolecular assemblies of PLL in ionic liquid and Ficoll. This work is an attempt to give an analogy between viscosity and conformational changes of PLL and thus can serve as a guide for protein aggregation in neuro-degenerative diseases. Taking PLL as a model, correlation between molecular properties like conformation and viscosity, a macroscopic property has been made.

1. Introduction

Protein aggregation is the driving phenomenon behind the transformation of native proteins into dysfunctional β-sheet rich agglomerates which are seen in diseased cases like Alzheimer's and Parkinson's. Poly-L-lysine (PLL) is the most successfully studied model polypeptide, that undergoes α-helix-to-β-sheet transition which is considered as one of the characteristics in protein aggregation.1 pH induced conformational changes in PLL have been studied by many groups using CD spectra.2–5 Studies have shown that dehydrating media like lipid bilayers and hydrophobic anesthetics promote formation of extended conformation in PLL, while a reverse effect is observed upon hydration.6–8 Studies show PLL binds to Congo Red, a highly specific molecular marker of amyloids,9 and forms fibrils with an amyloid-like appearance.10–12 Dobson et al., using transmission electron microscopy, have shown that β aggregates of PLL have an amyloid-like morphology.13

Surface/interface properties of protein aggregates or fibrils can influence the bulk behavior in foods, pharmaceuticals, and other technological applications.14–16 Even though efforts have been made to study the aggregation process, comprehensive understanding is lacking. The role of viscosity has been an important factor in determining the conformational changes in proteins leading to protein aggregation and macromolecular assemblies at interfaces.17,18 Recent work by Inoue et al. have shown that the translational diffusion coefficient which is proportional to the viscosity, is useful for monitoring the extent of intermolecular interactions, in particular hydrogen bonding of different conformations. They have detailed a new photoreactive probe molecule to study the relationship between the diffusion and the secondary structure, in particular the α-helix content of a polymer poly-L-glutamic acid.19 Yet the relationship between viscosity and conformational changes of poly aminoacids are not clearly understood so far.

In this paper, viscosity arising due to two agents IL-emes and Ficoll are discussed. IL-emes was chosen as an ionic liquid for these experiments because it has a high dielectric constant, a moderate bulk viscosity, and is a common room temperature IL. Perkin et al. have studied the shear characteristics of the films of IL-emes as a function of their thickness, down to a single ion layer. It has been shown that the IL-emes films show a low shear viscosity when molecular separations are lower than 2 nm range, making them ideal for lubrication.20 The strong H-bonding network between water and IL21 limits individual ion motion and thereby slows the diffusion controlled friction of PLL. Ficoll is a highly branched polymer formed by the copolymerization of sucrose and epichlorohydrin. Because of the abundance of hydroxyl groups, it is highly hydrophilic and extremely water-soluble. Ficoll®400 is completely non-ionic and has high density and viscosity in aqueous solutions and is used as molecular crowder in protein folding studies. For clarity, the structures of PLL, Ficoll and IL-emes are shown in Fig. 1.


image file: c6ra11626d-f1.tif
Fig. 1 Structures of PLL, Ficoll and IL-emes.

PLL at pH 7.5 is 98% random coil, and at pH 10 shows a mixture of α-helix (48.2%) and random coil (51.8%) conformations and thus can be used as a model system for analyzing conformational transitions in proteins. Here, using PLL we have attempted to correlate viscosity to their conformations and their adsorption near interfaces by combining various techniques including circular dichroism spectroscopy, tensiometry, quartz crystal microbalance and TEM. Changes in pH and viscosity of the PLL leads to drastic changes in the interfacial properties leading to conformational transitions and macromolecular assemblies of PLL.

PLL with varying concentrations of IL-emes and Ficoll were analyzed using CD spectroscopy and the corresponding % secondary structures were calculated using the method established by Reed et al. This method is specifically developed for polypeptides and thus serves a valid model for PLL.22 The stability of PLL at liquid/air and solid/liquid interfaces have been studied using surface tension and quartz crystal microbalance measurements. High resolution transmission electron microscopy analysis has been carried out to study the morphology of the PLL in different pH and in the presence of IL-emes.

2. Experimental section

PLL with molecular weight in the range 15[thin space (1/6-em)]000–30[thin space (1/6-em)]000 was obtained from Sigma (99% purity) and used as received. All aqueous solutions were prepared with deionized water further purified with a four-stage Milli-Q water system (Millipore, resistivity ≥ 18.2 MΩ). 10 mM phosphate buffer of pH 7.5 was prepared as described in the buffer recipe. pH 10 was prepared using sodium bicarbonate and adjusted using NaOH. Ficoll®400, trehalose and IL-emes, were obtained from Sigma with >98% purity. Concentration of IL-emes was varied between 10−6 M, 10−5 M, 10−4 M, 10−3 M and 5 × 10⁻³ M. Ficoll concentration was varied between 1%, 2%, 5%, 7.5%, 10% and 12.5% (w/v) (which corresponds to 25, 50, 125, 187.5, 250 and 312.5 μM taking 400 kDa as molecular weight of Ficoll).

UV-visible spectroscopy

The samples were analyzed using UV-1800-Shimadzu spectrophotometer with quartz cells of 1 cm path length. The corresponding samples (Ficoll, IL-emes) with matching concentrations were used as reference for the measurements.

Fluorescence spectroscopy

Thioflavin T assay. The steady state fluorescence spectroscopy was performed using Cary Eclipse Spectrometer. Thioflavin T (ThT) from Sigma Chemicals, USA was used to study PLL in the presence of highest concentrations of IL-emes and Ficoll, by measuring the fluorescence intensity of the samples. Fluorescence was recorded with λex and λem wavelengths at 440 nm and 485 nm (slit width 5 nm). Corresponding correction for background signals without ThT was also carried out. A 5 μM ThT was incubated with the samples for 1 hour prior to the measurements. The same experiments were repeated three times and the errors are plotted.

CD spectroscopy

CD spectra of PLL at pH 7.5 and 10 with Ficoll and IL-emes were carried out using a JASCO J-715 spectropolarimeter (JASCO Corp., Tokyo). The far-UV (240–190 nm) spectra of PLL in different concentrations of additives obtained using 0.1 cm path length quartz cells, were analyzed using the procedure of Reed et al.22 and fitted to three structural parameters: α-helix, β-sheet and random coil. All measurements were done a minimum of three times to ensure reproducibility.

FTIR spectroscopy

PLL solution was adsorbed onto low-e glass microscope slides and kept for drying in a vacuum desiccator. The dried film was investigated by reflectance infrared spectroscopy (ABB MB 3000 Instruments, Pike Technologies, USA) using an average of 80 scans at a resolution of 4 cm−1 at 25 °C. The infrared spectra of polyaminoacids are characterized by a set of absorption regions in the absorption/transmission spectrum known respectively as the amide region and the CH region. The information from the spectra obtained comes primarily from the amide I region, 1700 to 1600 cm−1, and the amide II region, 1600 to 1500 cm−1. The amide I region reflects mainly the C[double bond, length as m-dash]O stretching vibration of the peptide group, which consequently gives information on the proteins secondary structure whereas the amide II region results from the N–H bending vibration and C–N stretching vibration.23 In this paper, the amide I region is considered as they refer to the changes in the secondary structure.

QCM measurements

Plasma cleaned (exposed to UV/ozone for 10 min) gold-coated quartz substrates were used for all QCM measurements. Measurements were performed with 10 μL of temperature-stabilized and degassed sample liquid which was delivered to the chamber containing the sensor crystal to ensure a complete exchange of the liquid. This ensures that processes of adsorption and surface adlayer changes can be followed in situ while subsequently exposing different solutions to the surface. All measurements were performed at a temperature of 24–25 °C. QCM sensors, crystal holders, and polished gold AT cut 5 MHz gold crystals of 25 mm diameter crystals from SRS were used for the study. The oscillation frequency was measured using a SRS QCM with phase lock oscillator with independent crystal measurement channel. Data acquisition was performed using the SRS Data Logging software on a PC connected through an RS 232 serial interface. A sampling rate of 1/60 Hz was employed for all experiments. Any baseline drift was regulated using the coarse and fine capacitance adjustments. Upon interaction of PLL with the surface of a sensor crystal, changes in the resonance frequency, Δf, are related to attached mass governed by the Sauerbray's equation
 
Δm = −(μρ)1/2f)/(2f0)2 (1)
f0 is the resonance frequency of the crystal (5 MHz at 25 °C), μ is the shear modulus of the quartz crystal (2.947 × 10¹¹ g s−2 cm−1 at room temperature), and ρ is the density of quartz (2.648 g cm−3).

Shear viscosity is then given by the equation

 
η = (19.627 × (Δf)2 × 10⁻⁷)/ρ (2)

Surface tension measurements

Surface tension (γlv) has been measured using a Wilhelmy plate technique in a NIMA Tensiometer (UK) at T = 25 °C. In a separate experiment, on reaching equilibrium surface tension, the films have been horizontally transferred onto copper grids and characterized using transmission electron microscopy (TEM).

Zeta potential measurements

The zeta potential of the capsules has been measured using the Malvern Nano ZS-Nano series model.

Transmission electron microscopy (TEM)

TEM studies were carried out by transferring PLL on Formvar/carbon-coated copper grids (200 mesh size) using a TECNAI FE12 TEM instrument operating at 120 kV. The images were viewed by SIS imaging software.

3. Results and discussion

PLL solutions with Ficoll and IL-emes were first analyzed for their changes in the secondary structure. Fig. 2 shows the CD spectra of PLL in (a) pH 7.5 and (b) pH 10 in the presence of Ficoll and IL-emes. For the sake of clarity only the highest concentrations of Ficoll (12%) and IL-emes (5 mM) are presented in Fig. 2. The control samples are in accordance with the reported spectra.1 % secondary structures were calculated using the method of Reed et al. and found to be the same for our control samples at both pHs 7.5 and 10. PLL transforms to beta sheet conformation irrespective of pH for the highest concentration of IL-emes and Ficoll. Fig. 3 presents the % secondary structures of PLL with increasing concentrations of Ficoll at (a) pH 7.5 and (b) 10. The unordered conformation of PLL at pH 7.5 with increasing concentration of Ficoll shows more β sheet. At pH 10, destabilization of the helix occurs leading to an increase in the β sheet. This may be due to the partial stability of PLL in helical form at pH 10 in the presence of Ficoll. These samples were aged for a week under stable temperature and no variations in the % secondary structures from the fresh samples were observed.
image file: c6ra11626d-f2.tif
Fig. 2 CD spectra of PLL in (a) pH 10 and (b) 7.5 with highest concentrations of Ficoll and IL-emes.

image file: c6ra11626d-f3.tif
Fig. 3 % secondary structures of PLL in Ficoll 400 at pH (a) 7.5 and (b) 10 (the connecting lines in secondary structures are only a guide to eyes).

The % secondary structures of PLL in varying concentrations of IL-emes at pH (a) 7.5 and (b) 10 are shown in Fig. 4. Higher concentrations of IL-emes destabilizes PLL and more beta sheet structures are formed. The conformational changes occur without any external heat input by only varying the pH and viscosity of the solvent. These type of shifts in conformations from unordered or helical conformation to beta sheet in PLL in the presence of various organic solvents and temperature have been observed. PLL at pH 11.5, upon heating to 51 °C followed by slow cooling to room temperature, transforms from α-helix to β-sheet conformation.24 Organic solvents such as 2-chloroethanol induces helical conformation in homopolypeptides including PLL.25 Arunkumar et al. have shown that at pH 7.2 and at concentrations greater than 80% (v/v), acetonitrile transforms the backbone of PLL from unordered conformation to α-helix. At pH 11.5, acetonitrile destabilizes the helical conformation in PLL and shifts to unordered conformation. When the heat-induced β-sheet conformation is titrated with acetonitrile, at concentrations lower than 50% (v/v), acetonitrile induces/stabilizes the β-sheet conformation.26 In this paper, without using any external heat or organic solvents, only by tuning viscosity we could observe conformational changes in PLL. Such transitions are important and could be useful in modelling crowding induced aggregation in proteins.


image file: c6ra11626d-f4.tif
Fig. 4 % secondary structures of PLL in IL-emes at pH (a) 7.5 and (b) 10 (the connecting lines in secondary structures are only a guide to eyes).

To verify the transitions in secondary structures obtained using CD spectroscopy, we carried out IR measurements of PLL in pH 10 and 7.5 and in the presence of highest concentration of IL-emes and Ficoll and presented in Fig. 5.


image file: c6ra11626d-f5.tif
Fig. 5 FTIR spectroscopy of PLL in (a) pH 7.5 (b) pH 10 in IL-emes and Ficoll.

It can be seen that at pH 7.5 presence of negative minima at 1659 cm−1 is assigned to the random coil conformation. In addition the band at 1651 cm−1 at pH 10 is assigned to the α-helical conformation.23 In the presence of Ficoll and IL-emes, irrespective of the pH the bands are shifted to 1639–1643 cm−1 which is assigned to β-sheet conformation in accordance with the CD results.

It is shown that α-helical peptides are hypochromic and β-sheet rich peptides are hyperchromic.27 To verify this, PLL at pH 10 in the presence of highest concentration of Ficoll (12.5%) and IL-emes (5 mM) was studied using UV-visible spectroscopy, presented in Fig. 6. IL-emes and Ficoll not only induce conformational changes to PLL but also other aggregates are formed as suggested by the shoulder peak near 266 nm.


image file: c6ra11626d-f6.tif
Fig. 6 UV-Vis spectra of PLL in pH 10 and IL-emes (5 mM).

To confirm the viscosity induced conformational transitions in PLL, ThT binding assay was carried out. ThT is a biomarker specific for amyloid aggregates rich in β sheets and on binding to β sheet shows enhancement in the fluorescence intensity. Fig. 7 shows the fluorescence intensity of ThT on binding to PLL. Since PLL in pH 10 has about 50% helical conformation, an enhanced fluorescence is observed compared to PLL in pH 7.5. Such enhancements in ThT emission on binding to helical conformations are observed earlier by Harel et al.28 As the viscosity increases, a higher emission intensity is observed for PLL indicating the conformational transitions to β sheet.


image file: c6ra11626d-f7.tif
Fig. 7 ThT emission intensities for PLL in IL-emes and Ficoll.

To further confirm the role of viscogens, PLL in varying concentrations of trehalose (1 μM to 5 mM) was analyzed for % secondary structures and no variation in both pH was observed. This may be due to the fact that trehalose may not alter the viscosity and would simply stabilize the conformations in the respective pH. Such stabilizations of proteins by trehalose and its ability to inhibit protein aggregation have been reported in literature.29–31

The adsorption of PLL of different conformation (α-helix, β-sheet and random coil) at the water/dodecane interface using interfacial tension measurements had been recorded by Miller et al. and shown that differences in PLL states significantly affect the structure of the interfacial layers.32 They have shown that PLL solutions form viscoelastic films at the interfaces due to their interaction between nearby molecules. These films at the interface further lead to differences in adsorption layers measured by the reduction in surface tension. Hence to verify the changes in conformation arising in PLL due to IL-emes and Ficoll, interfacial measurements at solid/liquid and liquid/air interfaces were carried out using QCM and tensiometry. Fig. 8 shows the shear viscosity of PLL in the presence of various concentrations of (a) Ficoll and (b) IL-emes. PLL in the presence of Ficoll and IL-emes showed a higher shear viscosity compared to the control. Strong H-bonding network formed by IL-emes should have increased the viscosity of PLL in both pH. Shear viscosity of PLL in the highest concentration of IL-emes and Ficoll are higher and correspond to large population of β-sheet. Since QCM measurements are based on the amount of adsorbed mass, the changes in conformations should have led to higher adsorption leading to high viscosity. Such microenvironment changes resulting due to viscosity may bring the lysine residues in PLL closer, thereby promoting increased inter- and intra-molecular interactions within PLL.


image file: c6ra11626d-f8.tif
Fig. 8 Shear viscosity of PLL in (a) Ficoll (b) IL-emes.

In order to analyze the surface activity arising due to various conformations of the samples surface tension at liquid/air interface was carried out. Since Ficoll is a completely water soluble polymer the control solutions showed values close to water (72.3 mN m−1). Whereas PLL in the presence of Ficoll showed minimal surface activity and the values of the surface tension are presented in Table 1.

Table 1 Surface tension of PLL in Ficoll at pH 10, 7.5
Samples Surface tension at pH 10 (mN m−1) Surface tension at pH 7.5 (mN m−1)
PLL 66.5 69.5
PLL Ficoll 1% 53.1 66.2
PLL Ficoll 12.5% 50.2 58.3


The surface activity of PLL in IL-emes at pH 10 and 7.5 is shown in Fig. 9. Unordered conformation is stabilized at the air/water interface and does not show any surface activity for increasing concentrations of IL-emes. On the other hand at pH 10 due to destabilization of the helix there is an increase in the surface activity with increasing concentrations of IL-emes. More studies need to be done from theoretical point of view to further validate the energies associated with the destabilization of helical conformations using viscosity and work along that line is under progress. IL-emes could form viscoelastic films at the interface and together with the changes in the conformation lead to drastic reduction in the surface tension.


image file: c6ra11626d-f9.tif
Fig. 9 Surface tension of PLL in IL-emes.

PLL is a cationic polymer and thus the role of charges in these conformational transitions are of great interest. Since zeta potential is associated with the interfacial charge density, measurements of PLL at pH 7.5, 10 and in the presence of highest concentration of IL-emes (5 mM), Ficoll (12.5%) were carried out. Fig. 10 shows the zeta potential of PLL in buffer, IL-emes and Ficoll. For most of the cationic polymers the zeta potential values should be in the positive domain. Here we observe at pH 7.5, PLL in the presence of IL-emes shows a positive zeta potential. At pH 10, the zeta potential of PLL is negative but with IL-emes and Ficoll tends to move towards positive. The conformational changes leading to macromolecular assemblies and the charge compensation with the IL-emes molecules must have led to changes in the zeta potential. In the presence of Ficoll, for both pH, zeta potential is close to zero, indicating that increase in viscosity had lead to less stability of PLL with increased coagulation. The increase in viscosity of PLL in Ficoll is in accordance with the QCM measurements. This kind of changes in zeta potential arising due to changes in conformation and size for polymers of L-aspartic acid and L-glutamic acid has been observed.33


image file: c6ra11626d-f10.tif
Fig. 10 Zeta potential of PLL with IL and Ficoll in pH 7.5 and pH 10.

The samples after attaining equilibrium surface tension were transferred to the TEM grids to analyze the morphological nature of PLL in both pH 10 and 7.5 in the presence of highest concentration of IL-emes. The control samples at both pH showed linear assemblies (Fig. 11(a) and (c)) with sizes of about 100 nm in case of pH 10 and 20 nm in case of pH 7.5. Such tubular assemblies in PLL have been reported earlier by Dobson et al.13 Since pH 7.5 is close to physiological pH, TEM analysis of PLL at this pH was carried out. At pH 7.5, Ficoll drives PLL to form spherical aggregates (Fig. 11(b)) of about 0.2–0.5 μm size whereas IL-emes facilitates a networked structure (Fig. 11(d)). This could be due to Ficoll changing the local viscosity of PLL leading to slower diffusion and ultimately forming spherical aggregates. Due to increase in inter- and intra-molecular interactions within PLL due to IL-emes could have lead to such disorganized networked structures at the interface.


image file: c6ra11626d-f11.tif
Fig. 11 Transmission electron micrographs of PLL at (a) pH 10 (c) 7.5 and in (b) Ficoll and (d) IL-emes at pH 7.5.

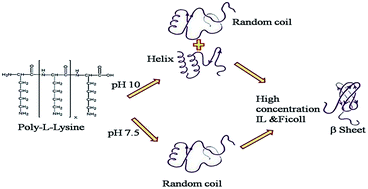
A schematic representation of the various conformations of PLL in pH 10 and 7.5 and in the presence of IL-emes is given in Fig. 12. The presence of the high concentrations of IL-emes leads to formation of β-sheet.


image file: c6ra11626d-f12.tif
Fig. 12 Schematic representation of different conformations of PLL in IL-emes and Ficoll.

4. Conclusion

This study reports on the role of viscogens on the conformational changes and macromolecular assemblies of PLL. CD spectra reveals that IL-emes and Ficoll drive PLL at pH 10 and 7.5 with 50%[thin space (1/6-em)]:[thin space (1/6-em)]50% helical–random coil and 100% random coil conformations respectively, to form ordered β-sheet conformation. Thioflavin T binding reveals that these β-sheets are amyloidogenic. Role of viscosity on peptides containing only α-helixes and only β-sheets will give more clear understanding on their pathways, leading to a global picture. Also any inhibitors for reversal of these conformational transitions will be of great interest. PLL as a model system, thus can pave ways for many conformation related diseases triggered due to increased viscosity, as observed inside the cells.

Acknowledgements

Author K. S thanks Department of Science and Technology, Govt. of India for the Inspire Faculty Award (Dy. no. 108 Dt. 8.1.2014). K. S. thanks CSIR-CLRI for extending the facilities for carrying out this work. Authors thank SASTRA university for Zeta Potential measurements.

References

  1. A. L. Fink, Folding Des., 1998, 3, R9 CrossRef CAS PubMed .
  2. R. Townend, T. F. Kumosinski, S. N. Timasheff, G. D. Fasman and B. Davidson, Biochem. Biophys. Res. Commun., 1966, 23, 163 CrossRef CAS PubMed .
  3. Y. P. Myer, Macromolecules, 1969, 2, 624 CrossRef CAS .
  4. M. L. Tiffany and S. Krimm, Biopolymers, 1969, 8, 347 CrossRef CAS .
  5. R. M. Epand, G. E. Wheeler and R. M. Moscarello, Biopolymers, 1974, 13, 359 CrossRef CAS PubMed .
  6. D. Carrier, H. H. Mantsch and P. T. T. Wong, Biochemistry, 1990, 29, 254 CrossRef CAS PubMed .
  7. J. S. Chiou, T. Tatara, S. Sawamura, Y. Kaminoh, H. Kamaya, A. Shibata and I. Ueda, Biochim. Biophys. Acta, 1992, 1119, 211 CrossRef CAS .
  8. D. Carrier, H. H. Mantsch and P. T. T. Wong, Biopolymers, 1990, 29, 837 CrossRef CAS .
  9. K. A. Dill, S. Banu Ozkan, M. Scott Shell and T. R. Weikl, Annu. Rev. Biophys., 2008, 37, 289 CrossRef CAS PubMed .
  10. J. Rumbley, L. Hoang, L. Mayne and S. W. Englander, Proc. Natl. Acad. Sci. U. S. A., 2001, 98, 105 CrossRef CAS PubMed .
  11. E. Pigorsch, A. Elhaddaoui and S. Turrell, J. Mol. Struct., 1995, 348, 61 CrossRef CAS .
  12. W. E. Klunk, J. W. Pettegrew and D. J. Abraham, J. Histochem. Cytochem., 1989, 37, 127 CrossRef .
  13. M. Fandrich and C. M. Dobson, EMBO J., 2002, 21, 5682 CrossRef PubMed .
  14. J. P. Ayyappan, H. Sami, D. C. Rajalekshmi, S. Sivakumar and A. Abraham, Chem. Biol. Drug Des., 2014, 84, 292 CAS .
  15. M. Naruszewicz, A. Busiakiewicz, W. Olejniczak, S. Pawlowski, K. Gwozdzinski and G. Grabowski, Biointerphases, 2015, 10, 031001 CrossRef PubMed .
  16. S. Jordens, P. A. Rühs, C. Sieber, L. Isa, P. Fischer and R. Mezzenga, Langmuir, 2014, 30, 10090 CrossRef CAS PubMed .
  17. K. Sankaranarayanan, A. Dhathathreyan, J. Krägel and R. Miller, J. Phys. Chem. B, 2012, 116, 895 CrossRef CAS PubMed .
  18. K. Sankaranarayanan, Biointerphases, 2015, 10, 021009 CrossRef PubMed .
  19. K. Inoue, N. Baden and M. Terazima, J. Phys. Chem. B, 2005, 109, 22623 CrossRef CAS PubMed .
  20. S. Perkin, T. Albrecht and J. Klein, Phys. Chem. Chem. Phys., 2010, 12, 1243 RSC .
  21. Q. G. Zhang, N. N. Wang and Z. W. Yu, J. Phys. Chem. B, 2010, 114, 4747 CrossRef CAS PubMed .
  22. J. Reed and T. A. Reed, Anal. Biochem., 1997, 254, 36 CrossRef CAS PubMed .
  23. A. Barth, Biochim. Biophys. Acta, 2007, 1767, 1073 CrossRef CAS PubMed .
  24. N. Greenfield and G. D. Fasman, Biochemistry, 1969, 8, 1841 CrossRef .
  25. M. Jackson and H. H. Mantsch, Biochim. Biophys. Acta, 1992, 1118, 139 CrossRef CAS .
  26. A. I. Arunkumar, T. K. S. Kumar, T. Sivaraman and C. Yu, Int. J. Biol. Macromol., 1997, 21, 299 CrossRef CAS PubMed .
  27. S. Song and S. A. Asher, J. Am. Chem. Soc., 1989, 111, 4295 CrossRef CAS .
  28. M. Harel, L. K. Sonoda, I. Silman, J. L. Sussman and T. L. Rosenberry, J. Am. Chem. Soc., 2008, 130, 7856 CrossRef CAS PubMed .
  29. J. K. Kaushik and R. Bhat, J. Biol. Chem., 2003, 278, 26458 CrossRef CAS PubMed .
  30. N. K. Jain and I. Roy, Current Protocols in Protein Science, 2010, 59, 491 Search PubMed .
  31. R. J. Mancini, J. Lee and H. D. Maynard, J. Am. Chem. Soc., 2012, 134, 8474 CrossRef CAS PubMed .
  32. H. Hermel and R. Miller, Colloid Polym. Sci., 1995, 273, 387 CAS .
  33. S. Anantharaj and M. Jayakannan, Biomacromolecules, 2015, 16, 1009 CrossRef CAS PubMed .

This journal is © The Royal Society of Chemistry 2016
Click here to see how this site uses Cookies. View our privacy policy here.