DOI:
10.1039/C6RA11456C
(Paper)
RSC Adv., 2016,
6, 90701-90710
Development and evaluation of UHMWPE/woven fabric composite microfiltration membranes via thermally induced phase separation
Received
4th May 2016
, Accepted 5th September 2016
First published on 5th September 2016
Abstract
We demonstrate a new kind of ultra-high molecular weight polyethylene (UHMWPE)/woven fabric composite microporous membrane via a thermally induced phase separation (TIPS) method. A dilute UHMWPE/liquid paraffin (LP) solution with a concentration lower than 8 wt% was used in the preparation of the composite membrane. The polyester-cotton (P-C) blended woven fabric was pretreated to remove the polyester component and then the UHMWPE/LP solution was pressed into the interstices of the pretreated woven fabric and wrapped the cotton fibers, then the composite membrane was prepared via the TIPS method. The cloud points and dynamic crystallization temperatures of the UHMWPE/LP solution were determined by optical microscopy and differential scanning calorimetry (DSC), respectively. The results show that the cloud points were similar to the crystallization temperatures, indicating that only solid–liquid (S–L) phase separation occurred during the thermally induced phase separation (TIPS) method of the UHMWPE/LP solution. The mechanical properties and thermal stability of composite membranes were also tested. The parameters such as the concentration and the viscosity molecular weight (Mη) of UHMWPE were optimized and a type of composite microporous membrane was prepared with good penetrating pore flow, dramatically high water flux and excellent bovine serum albumin (BSA) rejection. The composite membrane prepared from 5 wt% UHMWPE with a Mη of 4![[thin space (1/6-em)]](https://www.rsc.org/images/entities/char_2009.gif) 000000 had the largest BSA rejection of 76% and extremely high water flux of 621 L m−2 h−1. The antifouling effect of the composite membrane was also assessed in bovine serum albumin (BSA) aqueous solution.
000000 had the largest BSA rejection of 76% and extremely high water flux of 621 L m−2 h−1. The antifouling effect of the composite membrane was also assessed in bovine serum albumin (BSA) aqueous solution.
1. Introduction
Since the thermally induced phase separation (TIPS) method was first investigated by Castro in the 1980s, it has become one of the most remarkable techniques to prepare polymer microporous membranes.1–3 The membrane materials prepared using this method were mainly semi-crystalline polymers, including polypropylene, polyethylene, and poly(vinylidene fluoride), which could not be used to prepare membranes by the nonsolvent induced phase separation (NIPS) method. Among the semi-crystalline polymers, UHMWPE, an ultra-high molecular weight polyethylene with a molecular weight range from about 1000000 to 4500000, has been widely used to prepare microfiltration membranes.4–6 UHMWPE has not only good impact resistance, abrasion performance, and chemical resistance but also excellent low-temperature resistance.7 UHMWPE microfiltration membrane has become a new type of functional separation membrane material that can be widely used in wastewater reclamation, water separation, battery separators, the medicine industry, and so on.8–11
During the TIPS process, a homogeneous polymer and diluents blends are prepared by melt blending at a relative high temperature. With decreasing temperature, the solubility of polymer decreases with the decrease of temperature, at a certain temperature the polymer is no longer soluble, and phase separation is induced. At last the residual diluents can be extracted and a honeycomb microporous structure is formed.12,13 However, the commercial use of the UHMWPE microporous membrane is disturbed by its poor permeation performance with low water flux due to the disconnected honeycomb structure formed in the TIPS process. Li et al.14 prepared a UHMWPE hollow fiber membrane by melt blending the ternary mixture of UHMWPE/SiO2/PEO/mineral oil, and found that when the membrane thickness was 200 μm, the water permeability of the membrane reached a maximum (pure water flux 180 L m−2 h−1) at the PEO content 10% and UHMWPE concentration 8%. Li et al.15 prepared a PE hollow fiber membrane with antibacterial layer by plasma irradiation graft polymerization, and found that the water permeability of the membrane reached 120 L m−2 h−1 at the concentration of 8% UHMWPE and the membrane thickness of 230 μm. Zhu et al.16 prepared UHMWPE microporous membranes via TIPS method, they found that the water flux and pore size of the membrane increased when UHMWPE molecular weight, concentration or membrane thickness decreased, and the water permeability of the membrane reached a maximum (pure water flux 175 L m−2 h−1) when the membrane thickness was 100 μm and UHMWPE (Mη = 2000000) concentration was 25%.
Recently, many researchers tried to tune the membrane structure by controlling polymer concentration, cooling rate, quenching temperature or annealing time. Such as, Lloyd et al.17–20 investigated membrane formation by the TIPS method with different influential factors and control porous structure in different systems. In addition, efforts have also been paid to adjust the microstructures by a third component that may affect the process of TIPS. For example, Cui et al.21 prepared poly(vinylidene fluoride) (PVDF) membrane by melt blending the ternary mixture of PVDF/SiO2/dibutyl phthalate (DBP), and found that water permeability and tensile strength of the membrane would reach a maximum at certain SiO2 content. Meanwhile, the application of woven/non-woven fabric filtration has also been studied in recent years. Mecha et al.22 explored combining the woven fabric microfiltration membranes with silver nanoparticles using a modified chemical reduction method, the coated membranes were more hydrophilic and had higher water permeability. Wang et al.23 prepared a composite membrane by coating chitosan on both internal and outer surface of a non-woven fabric, they found that chitosan coating improved filtration performance and made fouling less troublesome and membrane regeneration efficient. Aluru et al.24 studied the preparation and filtration properties of hemp-based composite nonwovens, they found that the composite nonwoven which contained a two-layer structure of hemp/viscose spunlaced nonwoven layer and PA6 nanofiber layer had better filtration properties for practical application. To the best of our knowledge, few have reported the preparation of UHMWPE/woven fabric composite membrane to obtain connected pore structure tuning filtration performance.
In this work, we report an efficient and simple approach to prepare a composite membrane with excellent filtration properties from the composite of pretreated woven fabric and UHMWPE/LP solution via TIPS process. In the composites, the pretreated woven fabric was used as the intermediate, the UHMWPE/LP solution wrapped and immersed into the pretreated woven fabric. The composite microfiltration membrane was evaluated by the filtration test. The UHMWPE/woven fabric composite microporous membrane possessed a unique structure with connect pore structure, thin compact barrier layer and short pore flow distance. These characteristics endow the membrane with excellent properties of dramatic high water flux and high BSA rejection.
2. Experimental
2.1 Materials
UHMWPE with Mη of 2500000, 3000000 and 4000000 were supplied by Beijing Eastern Petrochemical Co., LTD. Liquid paraffin, which was saturated hydrocarbon with the structure (–CH2–CH2–)n and the average molecular weight is about 250–450, used as a diluent, were purchased from Hangzhou Refinery, China. Bovine serum albumin (BSA), xylene, dimethylsulfoxide (DMSO) and ethanol, all chemically pure, were purchased from Sinopharm Chemical Reagent Co., Ltd, China. Polyester-cotton blended woven Fabric was purchased from the market, the linear density of the polyester-cotton yarn was 120 dtex, and the weight ratio of polyester fibers and cotton fibers was 50/50.
2.2 The pretreatment of polyester-cotton blended woven fabric
The P-C woven fabric was immersed in DMSO with the bath ratio of 10 mL g−1 and then heated to 180–190 °C and kept for 20 min until the polyester fibers in the fabric was totally dissolved in DMSO.25 After that, the fabric was washed in the water several times to completely remove the dissolved polyester and then the fabric was dried under 80 °C for 4 h.
2.3 Preparation of the UHMWPE/LP film
The predetermined amounts of UHMWPE and LP were manually stirred with a glass bar for several minutes, followed by melt-mixed in a Batch mixer (XSS-300, Shanghai Kechang Rubber & Plastic Equipment Co, China) at 200 °C for 20 min with the rotor speed of 60 rpm. In order to stabilize the products, 0.7 wt% Irganox 1076 (Ciba, Switzerland), which was the mass percent of UHMWPE, was added into premixed UHMWPE/LP blends as the antioxidant. After that, the homogeneous UHMWPE/LP mixture was compressed into a film with the thickness of 100 μm at 190 °C.
2.4 Preparation of the UHMWPE/woven fabric composite membranes
UHMWPE/LP film was cut into a rectangle of 140 mm in width and 160 mm in length. One piece of same size pretreated woven fabric was sandwiched between two pieces of UHMWPE/LP film, then put those three pieces into a self-made mold separated by a 240 μm thick polyimide film spacer with a rectangular opening in the center, as shown in Fig. 1. The spacer was used to control the thickness of the composite film. Then the mold was heated in a plate vulcanizing machine (YX-25, Shanghai Xima Rubber & Plastic Equipment Co, China) to 190 °C under the pressure of 2 MPa and kept for 20 min to ensure the UHMWPE/LP solution wrapped and immersed into the pretreated woven fabric. Then the UHMWPE/LP/woven fabric composite film with the uniform thickness of 240 μm was prepared and the extra UHMWPE/LP solution was pressed out of the mold. Finally the composite film was taken out and solidified in cold water to induce phase separation. The LP in the composite membrane was extracted with xylene for 10 min at the bath ratio of 10 mL g−1, and the extraction was repeated three times to ensure complete LP removal. Finally, the composite membrane was put into ethanol to extract xylene. Then the wet membrane was placed in vacuum oven at 40 °C for 8 h, and the dry UHMWPE/woven fabric composite microporous membrane was obtained.
 |
| | Fig. 1 Schematic diagrams of the composite membrane. | |
2.5 Optical microscopy
Five different UHMWPE concentrations (3 wt%, 4 wt%, 5 wt%, 6 wt% and 8 wt%) of UHMWPE/LP/woven fabric systems for every UHMWPE samples (Mη = 2500000/3000000/4000000) have been used to obtain cloud points in the cooling process. The cloud points of UHMWPE/LP/woven fabric systems were observed by optical microscopy (BX51-P, OLYMPUS, Japan). The UHMWPE/LP/woven fabric film, sealed in two slides, was first heated on a hot stage at 200 °C for 10 min and then cooled with a cooling rate of 10 °C min−1. When the UHMWPE/LP solution cooled to the cloud point at which phase separation occurred, the transparent solution turned out to be turbid. The morphology of P-C blended woven fabric and DMSO treated fabric was also observed by the optical microscopy and the images were captured using a Sony video camera.
2.6 Differential scanning calorimetry
The dynamic crystallization temperature of different UHMWPE/LP/woven fabric systems was determined with a differential scanning calorimetry (TA DSC instrument, USA). The sample was sealed in an aluminum DSC pan, melted at 170 °C and kept for 10 min to completely eliminate its thermal history, and then cooled to room temperature at the cooling rate of 10 °C min−1 with nitrogen flow of 40 mL min−1. Then the beginning crystallization temperature of UHMWPE was got.
2.7 Thermogravimetric analysis and tensile measurements
The thermal stability of the membranes was determined by thermogravimetric analysis (TG 209 F1, Netzsch) from 30 to 900 °C in a nitrogen atmosphere with a heating rate of 10 °C min−1. All membranes samples were vacuum dried for 24 h before test. Tensile measurements were performed with an Instron 4465 instrument at a cross-head speed of 40 mm min−1. The initial gauge length and width were 60 and 4 mm, respectively.
2.8 Membrane morphology
The dried composite membrane was difficult to be fractured in liquid nitrogen because it contains cotton woven fabric. In order to observe the distribution of UHMWPE in the pretreated fabric, we prepared a thicker composite membrane with a thick layer of UHMWPE on the pretreated fabric. The UHMWPE layer was first fractured in liquid nitrogen and then a sharp knife was used to cut the fabric off in the liquid nitrogen. The cross-section and surface of all membrane samples were coated with 5–10 nm of gold in vacuo. The morphology of the membranes was examined with scanning electron microscopy (FE-SEM, S-4800, Hitachi, Japan).
2.9 Separation performance
The separation properties of all membranes were measured using a cross flow filtration equipment with an effective filtration area of 11.3 cm2, the pressure of filtration cell was supplied by a water pump and all the filtration experiments were carried out at the pressure of 0.1 MPa.26 The volume of the water permeation was collected for a certain time and the stable flux was calculated by the following eqn (1). The rejection efficiency of the prepared membranes was measured using BSA protein (0.5 g L−1, pH 7.4) as model foulant, and was calculated from the feed and the permeate concentrations measured via UV-spectrophotometer (UV-9100 D, LabTech, Beijing) according to the following eqn (2). In addition, the different pressures of 0.05 MPa, 0.1 MPa and 0.15 MPa were used to investigate the effect of operating pressure on flux and rejection for BSA rejection.| |
 | (1) |
where Q is the flux per unit time (L h−1), A is the effective area of the membrane (m2).| |
 | (2) |
where cp and cf are the concentration of foulant in permeate and feed solutions, respectively.
2.10 Fouling test
The adsorption fouling and filtration fouling were used to investigate the antifouling properties of composite membranes. For the adsorption fouling, we choose three samples (UHMWPE Mη = 4000000, concentration = 4/5/6 wt%), and all the tested membranes were cut into regular shape which were immersed into BSA phosphate buffer solution (0.5 g L−1, pH 7.4). After the adsorption–desorption equilibrium to reach equilibrium for 12 h at room temperature, the concentrations of BSA solution before and after adsorption were measured with UV-spectrophotometer (UV-9100 D, LabTech, Beijing) and the adsorption mass was calculated.27,28
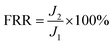
The dynamic fouling experiments were executed using alternate feed solution of pure water and BSA phosphate buffer solution (0.5 g L−1, pH 7.4). Firstly, stable water flux was recorded as J1, then the feed was replaced with pollutants solution and stable flux was recorded as Jp, after that, the tested membranes was taken out from the filter system to wash with pure water for 20 min and secondary pure water flux was obtained as J2. And it was notice that the higher FRR values or the lower IFR values of membranes indicate the better antifouling properties.29–32
| |
 | (3) |
| |
 | (4) |
3. Results and discussion
3.1 The phase diagram of UHMWPE/LP/woven fabric system
The phase diagram of the UHMWPE/LP system could be drawn with the changes of cloud points and crystallization temperatures as a function of UHMWPE concentration. The phase separation of UHMWPE–diluents system with concentration higher than 8 wt% via TIPS process has been studied by many researchers.33 The TIPS mechanism of crystalline polymer–diluents systems was determined by the competition between liquid–liquid phase separation and crystallization (i.e. S–L phase separation). Below the melting point, crystallization was the favorable process unless the nucleation barrier associated with polymer crystallization existed.
The cloud points of different UHMWPE/LP/woven fabric systems were observed by optical microscopy. Fig. 2 shows the images of UHMWPE/LP/woven fabric system under melt and crystallized state. When the system was cooled from melt state to the cloud point at which phase separation occurred, the image of UHMWPE/LP solution changed from transparent to turbid state, and then large proportion of UHMWPE crystals were observed.
 |
| | Fig. 2 The optical microscopy images of the UHMWPE/LP/woven fabric system at 140 °C (A) and room temperature (B). | |
Fig. 3 presents the phase separation temperatures obtained by optical microscopy and the dynamic crystallization temperatures obtained by DSC analysis of the UHMWPE/LP mixtures at various UHMWPE molecular weight and concentrations. It is shown that with the increase of UHMWPE concentration, both the phase separation temperature and the crystallization temperature of the system increase. Same phenomenon has also been observed for the UHMWPE/LP/woven fabric mixtures with different UHMWPE molecular weight. The mixtures of higher UHMWPE molecular weight show higher phase separation temperature and higher crystallization temperature. More important, for all the samples, no significant difference between the phase separation temperatures and the dynamic crystallization temperatures is observed. This indicates that the observed cloud points are in fact resulted from the crystallization of UHMWPE and so a solid–liquid TIPS rather than a liquid–liquid phase separation during the cooling process.
 |
| | Fig. 3 Comparison of cloud points and the dynamic crystallization temperatures in UHMWPE/LP/woven fabric systems with different UHMWPE concentrations. | |
3.2 Thermal and mechanical properties of UHMWPE/woven fabric membrane
The thermal stability of UHMWPE/woven fabric composite membranes were evaluated by thermogravimetric analysis (TGA). TGA and its derivative thermograms for different kinds of membranes are shown in Fig. 4A and B, it can be clearly seen that the differences between pure UHMWPE membrane, composite membrane and woven fabric, the thermogram of composite membrane undergone two-step degradation process, and the derivative thermogram also shown that. Totally, the composite membrane exhibits the onset decomposition stage starting about 337 °C, which is relative lower than pure UHMWPE membrane and same to woven fabric, that due to the loss of fabric present in the composite membrane. And the second thermal degradation process of composite membrane is occurred at the temperature 444–478 °C, which due to loss of polyethylene in the composite membrane.
 |
| | Fig. 4 TG curves of UHMWPE/woven fabric composite membrane compared with pure UHMWPE membrane and treated woven fabric (UHMWPE Mη = 4000000, concentration = 5 wt%). | |
As shown in Fig. 5, these results clearly demonstrate the improved mechanical properties of the UHMWPE composite with woven fabric compared with pure UHMWPE membrane. The improvement in the mechanical properties of composite membrane in this work can mainly be attributed to a combination of the UHMWPE/LP solution and woven fabric, the UHMWPE/LP solution wrapped and immersed into the pretreated woven fabric. So the debonding between fiber and polymer matrix and fiber pull-out counteract partial effect of the force which made the improvement of mechanical properties. Microfiltration membrane operation pressure was: 0.03 to 0.7 MPa, hence the UHMWPE/woven fabric composite membrane could satisfy the requirements of practical applications.
 |
| | Fig. 5 Tensile strength curves of UHMWPE/woven fabric composite membrane compared with pure UHMWPE membrane (UHMWPE Mη = 4000000, concentration = 4/56/8 wt%). | |
3.3 The formation of microporous structure of UHMWPE/woven fabric membrane
Fig. 6 shows the optical microphotographs of P-C blended woven fabric before and after DMSO treatment. From Fig. 6A, it can be seen that although the original fabric has regular large pore structure with the pore size of about 200 × 60 μm between adjacent warp and weft, the warp and weft yarn both have tight close structure which against the composite of UHMWPE solution. And the Fig. 6B shows that, after pretreated, the yarn structure become loose, many large interstices occur in the yarn because the polyester fibers have been removed. The loose structure of the pretreated woven fabric allows the UHMWPE solution going into the interstices of the fabric during compressing process.
 |
| | Fig. 6 The optical microphotograph of P-C blended woven fabric (A) and the pretreated polyester-cotton blended woven fabric (B). | |
And from Fig. 2 it can be clearly observed that after pretreated, the distance between adjacent cotton fibers in the pretreated woven fabric was about 10–30 μm, and UHMWPE solution had been pressed into the interstices in the yarn and uniformly wrapped the cotton fibers.
Fig. 7 shows the schematic description of bicomponent structure of UHMWPE/woven fabric composite membrane and its actual surface and cross-sectional structure. The fabric texture could be clearly seen from the surface view, and the enlarged surface view indicated the existence of UHMWPE layer. From the cross-sectional view of the composite membrane one can see that UHMWPE uniformly wraps the cotton fibers and microporous structure of UHMWPE/woven fabric composite membrane has been formed after the UHMWPE/LP/woven fabric composite film was solidified in cold water and then extracted to remove LP. It seems that the pore structure formed is connective because the distance between adjacent cotton fibers is short. The unique structure of the composite membrane will endow it with higher water flow than that of pure UHMWPE membranes.
 |
| | Fig. 7 Schematic description of the UHMWPE/woven fabric composite membrane. | |
3.4 The effect of UHMWPE concentration and molecular weight on the membrane morphology
In this study, during the preparing process of UHMWPE/woven fabric composite membrane, it's found that the fabrication of uniform membrane became difficult when the UHMWPE concentration was too low or too high. The proper UHMWPE concentration ranges were 3–8%. The higher UHMWPE concentration reduced the mobility of UHMWPE molecules, thus the solution became dramatically hard to be pressed into the interstices of the fabric and wrapped the cotton fibers. So the composite membrane was fabricated from UHMWPE/LP solution with lower concentrations. The morphology of the UHMWPE/woven fabric composite microporous membrane made from different concentration of UHMWPE/LP solution was observed with SEM.
Fig. 8 shows the surface SEM micrographs of the composite membranes prepared from different concentration of UHMWPE. It's clearly that with increased UHMWPE concentration, the pore size decreased on the surface. In the previous section, it has been proved that the phase transition in UHMWPE/LP/woven fabric system was resulted from a solid–liquid TIPS rather than a liquid–liquid phase separation during the cooling process. During the S–L TIPS, the polymer crystallization induced the phase separation, and polymer-rich phase constructed the membrane matrix and a liquid, polymer-poor phase formed the membrane pores. The system's viscosity was affected by the polymer concentration. The polymer chain density in the solution increased with increased solution concentration, so the entangled polymer networks relaxed more slowly, and the resulting porosity and the pore sizes are decreased.34–36 From Fig. 8 one can clearly see that some large pores occurred on the membrane surface when the UHMWPE concentration was decreased to 3 wt%. These large pores will affect the filtration properties of the composite membrane.
 |
| | Fig. 8 Surface morphology of the UHMWPE/woven fabric composite microporous membrane prepared from UHMWPE/LP mixtures with different concentrations (UHMWPE Mη = 4000000): (A–E), the surface view of 2000× SEM images of the membrane from 3 wt%, 4 wt%, 5 wt%, 6 wt% and 8 wt% solution, (a–e), the view of 50× SEM images from 3 wt%, 4 wt%, 5 wt%, 6 wt%, and 8 wt% solution. | |
The effect of the UHMWPE molecular weight was also discussed in this study. Fig. 9 shows the surface SEM micrographs of the composite membrane prepared from different molecular weight of UHMWPE. It indicates that the influence of molecular weight on the pore size is significant. With the increased UHMWPE molecular weight, the pore size decreased on the surface. This resulted from the polymer chain entanglement increased with the increased molecular weight. During the S–L phase separation process under the same polymer concentration, the increased UHMWPE molecular weight led to higher chain entanglement and higher solution viscosity, which reduced the mobility of the solution. Hence, the crystal growth stage is significantly hindered and the S–L phase separation slowed. Thus the pore size of the composite membrane decreased with increased UHMWPE molecular weight. The changes in the pore sizes of the UHMWPE/woven fabric composite membrane as a function of UHMWPE concentration and molecular weight are coincident with that of pure UHMWPE membrane.17,37
 |
| | Fig. 9 Surface morphology of the UHMWPE/woven fabric composite microporous membrane prepared with different UHMWPE Mη of (A) 2500000, (B) 3000000, and (C) 4000000 (UHMWPE concentration = 5 wt%). | |
Fig. 10 shows the typical morphology of the top, bottom and cross-sectional view of the composite UHMWPE/woven fabric membrane. It's shown that no significant difference could be observed between the top and bottom of the composite membrane. It is necessary to note that the cross-sectional SEM micrograph in Fig. 10 was obtained from a composite membrane with a much thicker UHMWPE layer on membrane surface. It is because that 240 μm thick composite membrane was difficult to be fractured in liquid nitrogen due to the toughness of cotton woven fabric in it. Here the UHMWPE layer was first fractured in liquid nitrogen and then the fabric was cut off in the liquid nitrogen with a sharp knife. From the cross-sectional view one can see that the UHMWPE/LP solution has totally wrapped and immersed into the pretreated woven fabric during the compressing process. The partial enlarged cross-sectional SEM micrographs show that the TIPS generated pore structure in pure UHMWPE layer (marked with circle) is quite different from that in the composite membrane (marked with square). The pure UHMWPE part show disconnected honeycomb structure, while the composite membrane possesses a unique connected pore structure. The unique pore structure in the composite membrane maybe formed due to the thin compact barrier layer between adjacent cotton fibers with the distance of 10–30 μm (shown in Fig. 2). The short pore flow distance and better porous connection exited in the UHMWPE/woven fabric composite membrane endow it with reduced permeation resistance. Thus, the porosity and pure water flux of the composite membrane will be increased significantly.
 |
| | Fig. 10 The typical morphology of the UHMWPE/woven fabric composite microporous membrane: (A) top view, (B) bottom view, (C) cross-section and its partial enlargement (c1, c2, c3) (UHMWPE Mη = 4000000, concentration = 5 wt%). | |
3.5 Filtration evaluation
The UHMWPE/woven fabric composite microporous membrane prepared in this study possesses the unique connected pore structure with short flow distance, and the UHMWPE/LP solution with concentration lower than 8 wt% yields much larger pore sizes. They both endow the membrane with excellent properties of dramatically high water flux.
The permeation efficiency of different UHMWPE/woven fabric composite membranes were examined by measuring the pure water flux and BSA rejection through these membranes, and the obtained data are presented in Fig. 11. The composite membranes showed an extremely high water flux of 1169 L m−2 h−1 when the UHMWPE concentration was 3% and the Mη was 2500000, however, the BSA rejection of the membrane was lower than 16%. It's because the UHMWPE concentration was too low, the thick UHMWPE/LP/woven fabric composite membrane contained much less UHMWPE and so produced much larger pore size, which meant that the UHMWPE was insufficient for microfiltration. It's seen from Fig. 11 that the water flux decreases with the increased UHMWPE concentration or molecular weight, while the changes in the BSA rejection show a contrary trend. These findings are also supported by SEM results (Fig. 8 and 9). Fig. 10 shows that the composite membrane produced a connected pore structure with short flow distance. That's the main reason for the extremely high water flux of the composite membrane. Meanwhile, with the increased UHMWPE concentration or molecular weight, the pore size decreased on the membrane surface. This resulted from the polymer chain increased with the increased polymer concentration or molecular weight, which led to a higher solution viscosity and so reduced the mobility of UHMWPE solution. Hence, the crystal growth stage is significantly hindered and the S–L phase separations slowed. This slowed S–L phase separations made the pore size decreased. As the UHMWPE (Mη = 4000000) concentration was 5 wt%, the BSA rejection of the composite membrane reaches 76% with a high water flux of about 621 L m−2 h−1. Compared with the published permeation efficiency data, the UHMWPE/woven fabric composite membrane prepared in this study exhibited an extremely higher water flux with a high level of BSA rejection.
 |
| | Fig. 11 Effect of UHMWPE concentration and molecular weight on the water flux and BSA rejection of the UHMWPE/woven fabric composite microporous membrane. | |
In addition, the different pressures of 0.05 MPa, 0.1 MPa and 0.15 MPa were used to investigate the effect of operating pressure on flux and rejection for BSA rejection in this study. As shown in Fig. 12, different pressures obvious impact on the flux and rejection during filtration process. The overall trend of flux increases with the increased pressure, and the decrease rate of the flux became faster with the increased pressure. These due to the honeycomb structure membrane was compacted by pressure, the thickness of the membrane became thinner and the membrane pore became compaction.38 While the changes in BSA rejection were small during the first 30 minutes, but with time growing, the BSA rejection increased with the increased operation pressure during the 60 and 90 minutes. That's may be because the filtration mechanism of honeycomb structure membrane was depth filter, which typically uses an average pore diameter of which is often 10 times the diameter of the smallest particle capable of permeating the membrane, the particles were sieved and captured both on the surface of the membrane and in the interior of the membrane.39 With the filtration time growing, the cake layer formed on the membrane surface, and interior pore were also blocked by particles. Hence, the flux decreased and the rejection increased with increased filtration time. And the decrease rate of the flux became faster with the increased pressure.
 |
| | Fig. 12 Time dependent flux variation (A) and BSA rejection (B) of UHMWPE/woven fabric composite membrane (UHMWPE Mη = 4000000, concentration = 5 wt%) at 0.05/0.1/0.15 MPa. | |
3.6 Antifouling performance
UHMWPE exhibits strong hydrophobicity due to the extremely long molecular chain without any polar groups. So the UHMWPE membrane surface has low surface energy, and the hydrogen bonding interaction with water also can't find on the membrane surface.40 In our study, the composition did not change the hydrophobicity of UHMWPE/woven fabric composite membrane. Therefore, the hydrophobicity of UHMWPE/woven fabric composite membrane results in permeation resistance and adsorption of hydrophobic contaminants onto membrane surface and inner pores.41 So the fouling resistance of the UHMWPE/woven fabric composite membranes were not satisfactory. In this study, three composite membrane samples (UHMWPE Mη = 4000000, concentration = 4/5/6 wt%) were chosen as representative. The fouling resistance of composite membrane in details were evaluated by static adsorption fouling and dynamic fouling tests. As shown in Fig. 13, the static adsorption capacity of composite membranes (UHMWPE Mη = 4000000, concentration = 4/5/6 wt%) were 54 μg cm−2, 53 μg cm−2 and 52 μg cm−2 respectively. The three value were similar.
 |
| | Fig. 13 Static adsorption mass of BSA UHMWPE/woven fabric composite membrane (UHMWPE Mη = 4000000, concentration = 4/5/6 wt%) membranes surface. | |
The test results of dynamic filtration fouling using BSA as pollutant solution were shown in Fig. 14. Fig. 14A exhibited the flux variation during the different filtration stage, and the FRR value was shown in Fig. 14B. From Fig. 13A, it's clearly seen that the permeation fluxes of pure water and BSA solution tend to decrease over time. Fig. 14 shows the dynamic fouling test results of three UHMWPE/woven fabric composite membranes, where the FRR values of the three samples were similar too, showing an unsatisfactory antifouling property.
 |
| | Fig. 14 Time dependent flux variation (A) and FRR values (B) of UHMWPE/woven fabric composite membrane (UHMWPE Mη = 4000000, concentration = 4/5/6 wt%) at 0.1 MPa (0–60 minute: pure water, 60–120 minute: BSA solution, 160–200 minute: pure water). | |
4. Conclusion
The UHMWPE/woven fabric composite microporous membrane with a novel structure was prepared with a pretreated woven fabric as the intermediate. The composite membrane possessed a unique structure with extremely connected water flow channel and so exhibited excellent properties of dramatic high water flux and high selectivity. During compressing process, the UHMWPE/LP solution was pressed into the interstices of the pretreated woven fabric and wrapped the cotton fibers. As a result of the composition, the mechanical properties of the composite membrane were improved. The TIPS mechanism of UHMWPE/LP/woven fabric mixture was resulted from the crystallization of UHMWPE induced solid–liquid phase separation. The preparation of this new type of composite membrane needed a proper UHMWPE concentration of 3–8 wt%, and the composite membrane presented a high water flux with high BSA selectivity. The BSA rejection of the composite membrane reached 76% with a high water flux of about 621 L m−2 h−1 when the UHMWPE (Mη = 4000000) concentration was 5 wt%. The antifouling property was unsatisfactory. So the hydrophilic modification of the UHMWPE/woven fabric composite membrane was conducted in our next work. This work may provide a new direction for microfiltration systems and applications.
Acknowledgements
This work was financially supported by Shanghai Key Laboratory of Catalysis Technology for Polyolefins.
References
- A. J. Castro, US Pat., 4247498, 1981.
- A. J. Castro, US Pat., 4519909, 1985.
- D. R. Lloyd, K. E. Kinzer and H. S. Tseng, J. Membr. Sci., 1990, 52, 239–261 CrossRef CAS.
- S. Liu, W. Yu and C. Zhou, Polymer, 2014, 55, 2113–2124 CrossRef CAS.
- H. Matsuyama, M. M. Kim and D. R. Lloyd, J. Membr. Sci., 2002, 204, 413–419 CrossRef CAS.
- S. C. Roh, M. J. Park, S. H. Yoo and C. K. Kim, J. Membr. Sci., 2012, 411–412, 201–210 CrossRef CAS.
- J. A. Puértolas and S. M. Kurtz, J. Mech. Behav. Biomed. Mater., 2014, 39, 129–145 CrossRef PubMed.
- M. J. Weighall, J. Power Sources, 1995, 53, 273–282 CrossRef CAS.
- L. H. D. Carvalho, T. S. Alves, T. L. Leal and H. D. L. Lira, Polimeros, 2009, 19, 72–78 Search PubMed.
- M. H. Yildirim, D. Stamatialis and M. Wessling, J. Membr. Sci., 2008, 321, 364–372 CrossRef CAS.
- T. A. Sherazi, J. Y. Sohn, Y. M. Lee and M. D. Guiver, J. Membr. Sci., 2013, 441, 148–157 CrossRef CAS.
- D. R. Lloyd, S. S. Kim and K. E. Kinzer, J. Membr. Sci., 1991, 64, 1–11 CrossRef CAS.
- S. Liu, C. Zhou and Y. Wei, J. Membr. Sci., 2011, 379, 268–278 CrossRef CAS.
- N. Li, C. Xiao, R. Wang and S. Zhang, J. Appl. Polym. Sci., 2012, 124, E169–E176 CrossRef CAS.
- M. S. Li, Z. P. Zhao, M. X. Wang and Z. Yue, Chem. Eng. J., 2015, 265, 16–26 CrossRef CAS.
- L. L. Zhu, Z. M. Hu, J. R. Yu, G. P. Tang, L. Chen and J. Zhu, Adv. Mater. Res., 2012, 476–478, 2363–2367 CrossRef CAS.
- H. Matsuyama, T. Maki, M. Teramoto and K. Asano, J. Membr. Sci., 2002, 204, 323–328 CrossRef CAS.
- H. Matsuyama, M. Teramoto, S. Kudari and Y. Kitamura, J. Appl. Polym. Sci., 2001, 82, 169–177 CrossRef CAS.
- S. S. Kim and D. R. Lloyd, J. Membr. Sci., 1991, 64, 13–29 CrossRef CAS.
- G. Lim, S. S. Kim, Q. Ye, Y. F. Wang and D. R. Lloyd, J. Membr. Sci., 1991, 64, 31–40 CrossRef CAS.
- A. Cui, L. Zhen, C. Xiao and Y. Zhang, J. Membr. Sci., 2010, 360, 259–264 CrossRef CAS.
- C. A. Mecha and V. L. Pillay, J. Membr. Sci., 2014, 458, 149–156 CrossRef CAS.
- C. Wang, F. Yang, F. Meng, H. Zhang, Y. Xue and G. Fu, Bioresour. Technol., 2010, 101, 5469–5474 CrossRef CAS PubMed.
- M. Aluru, J. Zola, D. Nettleton and S. Aluru, J. Ind. Text., 2015, 45, 265–297 CrossRef.
- W. D. Everhart, K. M. Makar and R. G. Rudolph, US Pat., 5866622, 1999.
- X. Zhao, H. Xuan, A. Qin, D. Liu and C. He, RSC Adv., 2015, 5, 64526–64533 RSC.
- X. Zhao, H. Xuan and C. He, RSC Adv., 2015, 5, 81115–81122 RSC.
- X. Zhao, H. Xuan, Y. Chen and C. He, J. Membr. Sci., 2015, 494, 48–56 CrossRef CAS.
- X. Zhao and C. Liu, J. Membr. Sci., 2016, 515, 29–35 CrossRef CAS.
- D. Liu, D. Li, D. Du, X. Zhao, A. Qin, X. Li and C. He, J. Membr. Sci., 2015, 493, 243–251 CrossRef CAS.
- W. Zhang, X. Zhao, Z. Zhang, Y. Xu and X. Wang, J. Membr. Sci., 2012, 415–416, 504–512 CrossRef CAS.
- Q. Zhou, J. H. Li, B. F. Yan, D. Wu and Q. Q. Zhang, Chin. J. Polym. Sci., 2014, 32, 892–905 CrossRef CAS.
- L. Shen, M. Peng, F. Qiao and J. Zhang, Chin. J. Polym. Sci., 2008, 26, 653–657 CrossRef CAS.
- H. Ding, T. Ye, L. Wang and B. Liu, J. Appl. Polym. Sci., 2007, 105, 3355–3362 CrossRef CAS.
- H. Sun, K. B. Rhee, T. Kitano and S. I. Mah, J. Appl. Polym. Sci., 1999, 73, 2135–2142 CrossRef CAS.
- H. Sun, K. B. Rhee, T. Kitano and S. I. Mah, J. Appl. Polym. Sci., 2000, 75, 1235–1242 CrossRef CAS.
- N. T. Hassankiadeh, Z. Cui, H. K. Ji, W. S. Dong, A. Sanguineti, V. Arcella, Y. M. Lee and E. Drioli, J. Membr. Sci., 2014, 471, 237–246 CrossRef CAS.
- K. Zhao, X. Zhang, J. Wei, J. Li, X. Zhou, D. Liu, Z. Liu and J. Li, J. Membr. Sci., 2015, 492, 536–546 CrossRef CAS.
- Z. G. Zhao, J. F. Zheng, B. Peng, Z. Y. Li, H. Y. Zhang and C. C. Han, J. Membr. Sci., 2013, 439, 12–19 CrossRef CAS.
- J. L. Shi, L. F. Fang, H. Zhang, Z. Y. Liang, B. K. Zhu and L. P. Zhu, J. Appl. Polym. Sci., 2013, 130, 3816–3824 CrossRef CAS.
- K. Zhao, B. Lin, W. Cui, L. Feng, C. Tian and J. Wei, Talanta, 2014, 121, 256–262 CrossRef CAS PubMed.
|
| This journal is © The Royal Society of Chemistry 2016 |
Click here to see how this site uses Cookies. View our privacy policy here. 


