Boric acid functionalized ratiometric fluorescence probe for sensitive and on-site naked eye determination of dopamine based on two different kinds of quantum dots

Yeqing Xua, Xiao Weib, Hongji Lia, Xudong Zhenga, Kai Luc, Xiqing Liua, Kun Wangd and Yongsheng Yan*a
aSchool of Chemistry and Chemical Engineering, Jiangsu University, Zhenjiang 212013, China. E-mail: jdwxtx@126.com; Fax: +86 0511 88791800; Tel: +86 0511 88790683
bKey Laboratory of Subsurface Hydrology and Ecological Effects in Arid Region of the Ministry of Education, Chang’an University, China
cSchool of Material Science and Engineering, Jiangsu University, Zhenjiang 212013, China
dSchool of Mechanical Engineering, Jiangsu University, Zhenjiang 212013, China

Received 2nd May 2016 , Accepted 16th July 2016

First published on 18th July 2016


Abstract

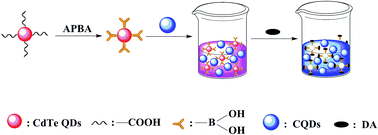
In this work, 3-aminophenylboronic acid (APBA) modified CdTe quantum dots (QDs) and carbon quantum dots (CQDs) were combined and used as a ratiometric fluorescence probe for the on-site naked eye detection of dopamine (DA). The probe combined the ratiometric fluorescence technique with boric acid functional materials together, and had the features of sensitivity and selectivity. Two kinds of QDs with different emission wavelengths were mixed into one system. To simplify the experimental operation processes, the blue-emission CQDs were introduced to serve as the reference signal, while the red-emission CdTe QDs acted as the response signal. With the addition of DA, the cis-diol compounds of DA covalently linked with APBA on the surface of the CdTe QDs, then the red-emission of the CdTe QDs decreased gradually and the blue-emission of the CQDs kept constant due to the surface quenching state induced mechanism, resulting in the color change of the mixture (from deep pink to blue). Under optimum measurement conditions, the proposed ratiometric probe had the advantage of sensitive detection of DA in a concentration range of 10–220 μM with a detection limit of 0.36 μM. The developed ratiometric fluorescence probe was proved to detect other cis-diol substances, like gallate and catechol. In addition, the developed probe was also applied for the detection of DA in human serum samples successfully. The present study provides a new and facile approach for the detection of DA and other similar substances without the requirement of complex equipment.


1. Introduction

Dopamine (DA), as a catecholamine neurotransmitter, is involved in many biological processes in the central nervous, hormonal, and cardiovascular systems.1,2 Superfluous secretion of DA (e.g., due to Huntington’s disease) is associated with failure in energy metabolism and causes untimely death. Alternatively, a lack of DA causes a loss of control of muscles, leading to aprosexia and even Parkinson’s disease.3 Therefore, methods to detect DA accurately in biological fluids are important for diagnosing diseases.4,5 Although various methods such as electrochemistry,6,7 ultraviolet-visible spectrophotometry,8 high performance liquid chromatography,9 and enzymatic methods10 have been adopted to solve these issues, they have many limitations like complex sample pre-treatment processes, cumbersome instrument procedures, the usage of organic solvents, and so on. Especially, universal, efficient and facile methods for DA detection are still rather limited.11,12 To overcome these difficulties, there comes a need for rapid, facile and low-cost approaches for the efficient determination of DA.

The appearance of fluorescence detection methods surmounts the disadvantages of other analytical methods, as fluorescence methods have the features of easy operation, low cost, rapid signal response, and high sensitivity and selectivity, which make them superior to other analytical methods. Especially for detection of DA, a special fluorescence method has been developed based on boronic acid functionalization. Boronic acids are used because they form covalent interactions with the 1,2 cis-diols, so that substances with cis-diol groups, such as DA, a compound which features a special cis-diol structure, could react with boronic acids and achieve the result of selective recognition. Quantum dots (QDs), as a new kind of fluorescent probe material, have attracted lots of attention recently, attributed to their excellent optical properties, like strong signal intensity, high quantum yield, adjustable size-dependent photoluminescence and narrow emission peaks, which have endowed them with increased attention in many fields.13,14 So the boronic acid functionalized fluorescence method based on QDs will possess the merits of both boronic acid functionalization and fluorescence QDs. Briefly, the boronic acid functionalized QDs are advantageous due to their ease of synthesis, relatively low expense, high selectivity, outstanding optical properties, excellent stability, and so on. These characteristics attract more and more researchers to devote themselves to the research of building and studying new synthesis and identification methods.15,16

To establish a better fluorescence sensing system, a relatively new method called the ratiometric fluorescence detection method has been introduced owing to its improved sensitivity and accuracy. The ratiometric fluorescence detection method is a method where the ratio of two fluorescence intensities (FL) changes with the variation of the target analyte, accompanied by extremely obvious visual changes at the same time, so the color changes are easy to distinguish after adding a spot of the target.17,18 Generally, the most common way to construct dual-emission fluorescent probes is with Cd-based QDs, whose surfaces are totally passivated with appropriate modification, usually adopting the method of packaging in silicon nanomaterials, which serve as a steady core; another bare quantum dot coating on the surface of the silica nanomaterials acts as the response signal with direct exposure to the external environment.19,20 Compared with common fluorescence methods, measurements using ratiometric fluorescence techniques can provide built-in correction for environmental effects,21–23 greatly weakening the influence of other interfering factors, such as the undulation of excitation light intensity and the concentration of the probes.24–26 The measurements also have strengths in terms of enhanced accuracy, sensitivity, visibility, and so on. Furthermore, the dual-emission QDs ratiometric fluorescence probe must be a powerful tool in the biological and chemical sensing area.

To optimize and simplify the construction mode of the dual-emission QDs ratiometric fluorescence probe, carbon quantum dots (CQDs) are brought in and play the role of the reference signal. CQDs, a novel kind of fluorescence quantum dot, have caught the most attention in recent years for their outstanding advantages of excellent optical properties, good stability and easy preparation.27–29 On account of the excellent optical properties and good stability of CQDs, they can be used as an equivalent instead of silicon coated Cd-based QDs, at the same time making experimental processes more facile without affecting the results of the experiments.

In this work, we integrated boronic acid functionalization, ratiometric fluorescence probes and fluorescence CQDs with a detection system. Briefly, we used CQDs and CdTe QDs to structure a dual-emission probe, and used a transmission electron microscope to observe features of the two kinds of QDs. Blue-emission fluorescence CQDs were regarded as the reference signal of the system, and 3-aminophenyl boronic acid modified red-emission CdTe QDs acted as the response signal to visually detect DA. 3-Aminophenyl boronic acid was covalently combined with thioglycolic acid (TGA)-capped CdTe QDs. The phenylboronic acid ligand formed boronate esters with the vicinal diols.30 Therefore, the dual-emission probe could react with DA. The reaction could obviously lead to the fluorescence quenching of the CdTe QDs. On the whole, the dual-emission probe of CQDs and CdTe QDs was utilized for visual detection of DA successfully. In addition, we also explored the detection of gallate and catechol, which have the same cis-diol structure as DA, and achieved satisfactory results.

2. Experimental

2.1 Chemicals and reagents

All chemicals were analytical grade reagents. Thioglycolic acid (TGA) (98%), CdCl2·2.5H2O (99.99%), NaBH4 (99%), tellurium powder (Te) (99.99%), citric acid monohydrate, ethylene imine polymer (PEI), dopamine hydrochloride (DA) and catechol (99%) were all purchased from Aladdin reagent Co., Ltd. (Shanghai, China). NaOH, gallate and 3-aminophenylboronic acid monohydrate were purchased from Sinopharm Chemical Reagent Co., Ltd. (Shanghai, China). Double distilled water (DDW) was used throughout the experimental procedures.

2.2 Instruments

The morphologies of the prepared CQDs and CdTe QDs were observed using a transmission electron microscope (TEM, JEOL, JEM-2100). The fluorescence measurements were performed on a spectrofluorometer (Cary Eclipse) equipped with a plotter unit and a quartz cell (1.0 cm × 1.0 cm).

2.3 Synthesis of CdTe QDs

The preparation of thioglycolic acid capped CdTe QDs was carried out using a previously reported refluxing method31,32 with some modifications. Briefly, 51 mg of Te powder, 100 mg of NaBH4 and 1.5 mL of H2O were added into a clean centrifuge tube, whose lid had a needle inserted to discharge hydrogen generated in the reaction, and an ultrasonic reaction proceeded for an hour to obtain the precursor of the CdTe QDs. Then, fresh NaHTe solution was added to an N2-saturated CdCl2 solution in the presence of thioglycolic acid at pH 11.2 in an oil bath. The ratio of [CdCl2][thin space (1/6-em)]:[thin space (1/6-em)][TGA][thin space (1/6-em)]:[thin space (1/6-em)][NaHTe] was fixed at 1[thin space (1/6-em)]:[thin space (1/6-em)]1.6[thin space (1/6-em)]:[thin space (1/6-em)]0.25. The reaction was under reflux at 100 °C and the whole process had to have N2 circulating, then after about 3.0 d the red-emission CdTe QDs were obtained and were used in the following experiments.

2.4 Synthesis of CQDs

The CQDs were synthesized by referring to a reported synthetic method with some modifications. Briefly, 2.0 g of citric acid monohydrate and 1.0 g of PEI were dissolved in a 50 mL Teflon high temperature and high pressure reaction kettle with 35 mL of DDW and then stirred on a magnetic stirrer for about 30 min. Next, it was put into a drying oven and heated to 200 °C for 5 h, allowed to cool to room temperature, and then centrifuged to remove macromolecular impurities, then the purified CQDs were collected for further use.

2.5 Fluorescent and visual detection of DA

The testing excitation wavelength was set at 330 nm, and the photomultiplier tube voltage was set at 700 V. The slit widths of the excitation and emission were both set at 10 nm. The fluorescence spectra were recorded from 420 nm to 750 nm. The CQDs and CdTe QDs-APBA were dispersed in 10 mL of water to form a ratiometric fluorescence probe stock solution. DA, gallate, and catechol were dissolved in water to obtain analyte stock solutions (10 mM). 50 μL of the as-prepared ratiometric fluorescence probe, different amounts of known concentration of DA standard solution, and 1.0 mL of PBS buffer (pH 7.4, 0.1 M) were added into a 5.0 mL calibrated test tube, and then the mixture was diluted to the mark with water and mixed thoroughly. After a reasonable time for incubation, the solution was transferred into the quartz cell for fluorescence detection. To carry out the visual detection of DA, the test tubes were kept standing under a UV lamp and the images of the color changes were taken using a camera under UV illumination (excitation wavelength at 365 nm) in a dark surrounding environment.

2.6 The detection limit of the CdTe QDs-APBA and CQDs detection system

The detection limit of the probe was calculated based on the fluorescence titration, the fluorescence intensity of the probe was measured ten times to get the S/N ratio, and the standard deviation of the blank measurement was obtained. Then the detection limit of the probe was calculated by the following equation: D = 3σ/k, in which σ is the standard deviation of the blank measurements and k is the slope of the calibration line (n = 10).

3. Results and discussion

3.1 The characteristics of prepared CQDs and CdTe QDs

In this work, the blue-emission CQDs were used as an internal standard, which had great stability during a very long time and could be detected without any effect, meanwhile, the red-emission CdTe QDs served as the response signal for the visual detection of DA. Fig. 1A and B show the transmission electron microscopy (TEM) images of the synthesized CQDs and CdTe QDs, respectively; as can be seen in the pictures, the diameters of the CQDs and CdTe QDs were all about 5.0 nm. The two kinds of synthesized QDs were well-dispersed in the water. Furthermore the as-prepared CQDs were nearly excitation-independent, as can be seen in Fig. 1C; when the excitation wavelength ranged from 330 nm to 370 nm, the fluorescence intensities were all very strong. Fig. 1D is the picture of the dual-emission probe (left) and water (right) under the bright field; Fig. 1E is the picture of the dual-emission probe (left) and water (right) under the 365 nm UV lamp. The color of the probe was clear to see under the 365 nm UV lamp.
image file: c6ra11329j-f1.tif
Fig. 1 (A) and (B) TEM images of CQDs and CdTe QDs. (C) The excitation-independent emission spectra of the CQDs. (D) Picture of the dual-emission probe (left) and water (right) under bright field. (E) Picture of the dual-emission probe (left) and water (right) under a 365 nm UV lamp.

3.2 Production process and mechanism of the CdTe QDs-APBA and CQDs detection system

The red-emission CdTe QDs served as the response signal with modifications on the surface groups of the CdTe QDs. Herein, 3-aminophenylboronic acid monohydrate was combined with CdTe QDs through covalent bonding, as shown in Scheme 1. A simple dual-emission probe for DA based on 3-aminophenylboronic acid functionalized CdTe QDs-APBA and CQDs was developed. APBA was covalently linked to the CdTe QDs, and the surface functional group of the CdTe QDs-APBA was changed from the negatively charged carboxyl group to the strongly electron-deficient boronic acid. In this work, the APBA acted as the DA receptor, which could be covalently linked to a DA molecule to form a large assembly, and the fluorescence of CdTe QDs-APBA was quenched, which had no effect on the fluorescence of the CQDs.
image file: c6ra11329j-s1.tif
Scheme 1 Schematic illustration of the synthetic process for the CQDs and CdTe QDs-APBA detection system.

The synthesized CQDs and CdTe QDs-APBA were characterized using their fluorescence properties. The blue-emission CQDs (Fig. 2A, curve c) and red-emission CdTe QDs (Fig. 2A, curve a) had strong fluorescence emission with wavelengths at 443 nm and 638 nm. The fluorescence spectrum of the mixture system (Fig. 2A, curve b) showed maximal emission wavelengths around 448 nm and 638 nm under single wavelength excitation at 330 nm. The photographs of the CdTe QDs, the mixture system and CQDs showed red, deep pink and blue fluorescence, respectively (inset in Fig. 2A). The stability of the mixture system was systematically investigated over 120 min (Fig. 2B). The FL intensity ratio (I638/I448) remained the same with no obvious change, which implied that the mixture system had good stability and could be applied for DA detection.


image file: c6ra11329j-f2.tif
Fig. 2 (A) Fluorescence spectra of (a) red-emission CdTe QDs, (b) the mixture system, and (c) CQDs. The inset shows the photographs of (a) red-emission CdTe QDs, (b) the mixture system, and (c) CQDs under a 365 nm UV lamp. (B) The influence of time on the FL intensity ratio (I638/I448) of the mixture system. I638/I448 means the FL intensity of the sensing system at 638 nm versus that at 448 nm.

The prepared mixture system could be used to detect DA. The FL changes were also investigated to clarify the interactions between DA and CdTe QDs-APBA. Fig. 3 shows the temporal evolution of the FL intensity of the mixture system in the presence of 40 μM DA. It can be seen that the FL intensity ratio decreased obviously and quickly after adding 40 μM DA, after just 1.0 min reaction time the FL intensity remained nearly constant. In the further experiments, 1.0 min was chosen to be the optimal reaction time, and then the FL intensity of the mixture could be recorded.


image file: c6ra11329j-f3.tif
Fig. 3 Fluorescence (FL) intensity of the mixture system in the presence of 40 μM DA at different incubation times.

3.3 Analytical performance of the dual-emission ratiometric fluorescence probe

The dose response of the dual-emission ratiometric fluorescence probe for DA was examined. Firstly, the testing conditions, such as pH, optical stability and response time, which may affect the detection results, were confirmed and optimized for the following fluorescence and visual detection. Optical stability and response time were studied above. To our knowledge, the best pH is about 7.4 for the detection of DA using boric acid,33 so a pH of 7.4 was chosen during the experiment. According to the above, the ratiometric fluorescence probe could remain stable for 120 min and the response time was chosen to be 1.0 min for the detection of DA.

Without the presence of DA, the dual-emission ratiometric fluorescence probe emitted two distinct emission peaks at 448 and 638 nm, which could be attributed to the fluorescence of CQDs and CdTe QDs, respectively. With the addition of DA, the intensity at 638 nm of the CdTe QDs gradually decreased while the fluorescence intensity at 448 nm of the CQDs remained constant (Fig. 4a). The fluorescence intensity ratio was closely related to the concentration of DA, ranging from 10 μM to 220 μM, which could be used for the determination of DA. The linear curve fitted an equation of log(I448/I638)/(I448/I638)0 = 0.00414(CDA/μM) − 0.03391 (R2 = 0.99714) (Fig. 4a). With the addition of DA, the fluorescence intensity ratio of the two different emission peaks changed, and color variations of the ratiometric probe solution could be observed (inset of Fig. 4a). Clearly, even a slight decrease in the FL intensity of the CdTe QDs could give rise to obvious color changes from the original background. Thus, the on-site naked-eye detection of DA is feasible.


image file: c6ra11329j-f4.tif
Fig. 4 Fluorescence spectra, linear relationships and corresponding photographs of the CQDs and CdTe QDs-APBA system (a), the CdTe QDs system (b), and the CQDs and CdTe QDs system (c) upon exposure to different concentrations of DA.

In order to show the advantages of the dual-emission ratiometric fluorescence probe, the CdTe QDs-APBA single emission fluorescence probe and CQDs and CdTe QDs ratiometric fluorescence probe were also prepared as contrasts. The responses of the single emission fluorescence probe and CQDs and CdTe QDs ratiometric fluorescence probe to DA were also studied (Fig. 4b and c). The fluorescence intensity of the single emission fluorescence probe could be quenched by DA. It could be found that, unlike the dual-emission ratiometric fluorescence probe, the color changes of the single emission fluorescence probe solutions with different concentrations of DA were difficult to observe by the naked eye. The linear curve fitted an equation of log(F0/F) = 0.00266(CDA/μM) + 0.09142 (R2 = 0.99178) (Fig. 4b). For the CQDs and CdTe QDs ratiometric fluorescence probe, the fluorescence intensity could decrease just a little, which is attributed to the carboxy groups on the surface of the CdTe QDs. In detail, the surface of the CdTe QDs had no specific recognition chemical groups so that DA could not covalently bond on the surface of the CdTe QDs, just a part of the CdTe QDs were quenched. Therefore, the color changes of the CQDs and CdTe QDs system were inconspicuous (inset of Fig. 4c). The linear curve fitted an equation of log(I448/I638)/(I448/I638)0 = 0.00142(CDA/μM) − 0.00875 (R2 = 0.98303) (Fig. 4c). Comparisons between the three fluorescence probes clearly implied that the dual-emission ratiometric fluorescence probe was the most reliable and sensitive for the visual detection of DA.

3.4 cis-Diol substance detection of the CQDs and CdTe QDs-APBA detection system

Due to the presence of APBA, DA could combine with the ratiometric fluorescence probe easily and firmly. The APBA modified CdTe QDs were quenched by DA due to the specific covalent-binding reaction of the boronic acid groups with the two pairs of cis-diols of DA. Clearly, the existence of two pairs of cis-diols in gallate was the key structural feature. Compared with DA, other substances like gallate and catechol also had the special structure to bind with APBA modified CdTe QDs. This is why there were also large changes in fluorescence intensity at the same concentration of other cis-diol substances (Fig. 5). So with this special structure, the ratiometric fluorescence probe could be applied to many areas.
image file: c6ra11329j-f5.tif
Fig. 5 Fluorescence spectra of the CQDs and CdTe QDs-APBA system’s detection of different targets at the same concentrations (range from 0 to 200 μM).

3.5 Applications in practical samples

To demonstrate the practical feasibility of the ratiometric fluorescence probe, DA in healthy human serum was assayed. Spiking recovery was as follows: the serum sample was diluted 100-fold and spiked with 50 μM and 100 μM of DA, and the concentration of DA in the samples was determined. Satisfactory recoveries of DA in human serum were obtained (Table 1). The results of standard experiments can be seen in Table 1 as well. From the results, it can be concluded that the dual-emission probe could detect endogenous DA in serum, but the results were not so satisfactory for the spiked-standard recovery experiments. Typically, the spiked-standard recovery experiments could detect small amounts of DA, which were lower than the detection limit occasionally. But in general, both of the two methods could detect endogenous DA in serum. Thus, the proposed ratiometric fluorescence probe may be used as an effective tool to detect DA in human serum samples quickly and directly.
Table 1 Results of DA determination in human serum samples
Sample number Detected (μM) Added (μM) Found (μM) Recovered (%) RSD (%, n = 3)
1 1.26 50 51.23 102.46 2.3
1.37 100 101.45 101.45 2.8
2 0 50 50.25 100.5 3.1
2.63 100 103.43 103.43 2.9
3 1.96 50 52.06 104.12 2.8
1.36 100 102.24 102.24 2.7


4. Conclusions

In summary, a novel and facile ratiometric fluorescence probe based on a mixture of two different QDs of different emission wavelengths was established successfully for DA on-site naked-eye detection. The CQDs acted as the reference signal and equivalently replaced silicon coated Cd-based QDs, which made the experimental processes more facile and timesaving. The APBA functionalized dual-emission QDs ratiometric fluorescence probe showed superior sensitivity for the detection of DA, gallate and catechol, whose special cis-diol structures could covalently bind with the boronic acid groups. The presence of DA in the solutions could be observed by the fluorescence color changes of the probe. The ratiometric fluorescence intensity was used to quantify DA in solution. Compared with the single APBA modified CdTe QDs, the established dual-emission fluorescence probe exhibited excellent visual detection sensitivity. Moreover, the developed ratiometric fluorescence probe was successfully applied to the detection of DA in human serum samples, which indicated the practical application of the dual-emission fluorescence probe in a complex environment. The facile, rapid and reliable APBA modified dual-emission fluorescence probe provided a new approach for detection of DA and other similar substances, and also could be extended to detection of other targets by functionalizing responsive QDs appropriately.

Acknowledgements

This work was financially supported by the National Natural Science Foundation of China (No. 21277063, No. 21407057, No. 21407064, No. 21446015, and No. 21507045), the National Basic Research Program of China (973 Program, 2012CB821500), the Natural Science Foundation of Jiangsu Province (No. BK20140535), the National Postdoctoral Science Foundation (No. 2014M561595), and the Postdoctoral Science Foundation funded Project of Jiangsu Province (No. 1401108C).

References

  1. Y. Lin, C. Chen, C. Wang, F. Pu, J. Ren and X. Qu, Chem. Commun., 2011, 47, 1181–1183 RSC.
  2. X. Ji, G. Palui, T. Avellini, H. B. Na, C. Yi, K. L. Knappenberger and H. J. Mattoussi, J. Am. Chem. Soc., 2012, 134, 6006–6017 CrossRef CAS PubMed.
  3. X. D. Zhang, X. K. Chen, S. Q. Kai, H. Y. Wang, J. J. Yang, F. G. Wu and Z. Chen, Anal. Chem., 2014, 86, 5508–5512 CrossRef PubMed.
  4. K. Jackowska and P. Krysinski, Anal. Bioanal. Chem., 2013, 405, 3753–3771 CrossRef CAS PubMed.
  5. L. A. Mercante, A. Pavinatto, L. E. O. Iwaki, V. P. Scagion, V. Zucolotto, O. N. Oliveira Jr, L. H. C. Mattoso and D. S. Correa, ACS Appl. Mater. Interfaces, 2015, 7, 4784–4790 CAS.
  6. Y. Ma, M. G. Zhao, B. Cai, W. Wang, Z. Z. Ye and J. Y. Huang, Chem. Commun., 2014, 50, 11135–11138 RSC.
  7. M. S. Hsu, Y. L. Chen, C. Y. Lee and H. T. Chiu, ACS Appl. Mater. Interfaces, 2012, 4, 5570–5575 CAS.
  8. T. Yu, Y. H. Liu, J. S. Ren and X. G. Qu, Biosens. Bioelectron., 2013, 42, 41–46 CrossRef PubMed.
  9. R. P. H. Nikolajsen and A. M. Hansen, Anal. Chim. Acta, 2001, 449, 1–15 CrossRef CAS.
  10. M. B. Fritzen-Garcia, F. F. Monteiroa, T. Cristofolini, B. G. ZanettiRamos, V. Soldi, A. A. Pasa and T. B. Creczynski-Pasa, Sens. Actuators, B, 2013, 182, 264–272 CrossRef CAS.
  11. S. S. Wang, Z. Ye, Z. J. Bie and Z. Liu, Chem. Sci., 2014, 5, 1135–1140 RSC.
  12. Y. P. Huang, Y. E. Miao, S. S. Ji, W. W. Tjiu and T. X. Liu, ACS Appl. Mater. Interfaces, 2014, 6, 12449–12456 CAS.
  13. U. Resch-Genger, M. Grabolle, S. Cavaliere-Jaricot, R. Nitschke and T. Nann, Nat. Methods, 2008, 5, 763–775 CrossRef CAS PubMed.
  14. F. P. Shi, S. Y. Liu and X. G. Su, Talanta, 2014, 125, 221–226 CrossRef CAS PubMed.
  15. Y. Zou, D. L. Broughton, K. L. Bicker, P. R. Thompson and J. J. Lavigne, ChemBioChem, 2007, 8, 2048–2051 CrossRef CAS PubMed.
  16. C. Lin, E. Katilius, Y. Liu, J. Zhang and H. Yan, Angew. Chem., Int. Ed., 2006, 45, 5296–5301 CrossRef CAS PubMed.
  17. J. C. Wu, Y. Zou, C. Y. Li, W. Sicking, I. Piantanida, T. Yi and C. Schmuck, J. Am. Chem. Soc., 2012, 134, 1958–1961 CrossRef CAS PubMed.
  18. C. M. Tyrakowski and P. T. Snee, Anal. Chem., 2014, 86, 2380–2386 CrossRef CAS PubMed.
  19. K. T. Yong, W. C. Law, R. Hu, L. Ye, L. W. Liu, M. T. Swihart and P. N. Prasad, Chem. Soc. Rev., 2013, 42, 1236–1250 RSC.
  20. K. Wang, J. Qian, D. Jiang, Z. T. Yang, X. J. Du and K. Wang, Biosens. Bioelectron., 2015, 65, 83–90 CrossRef CAS PubMed.
  21. S. A. Diaz, L. Giordano, T. M. Jovin and E. A. Jares-Erijman, Nano Lett., 2012, 12, 3537–3544 CrossRef CAS PubMed.
  22. X. Lv, J. Liu, Y. L. Liu, Y. Zhao, Y. Q. Sun, P. Wang and W. Guo, Chem. Commun., 2011, 47, 12843–12845 RSC.
  23. M. Zhuang, C. Q. Ding, A. W. Zhu and Y. Tian, Anal. Chem., 2014, 86, 1829–1836 CrossRef CAS PubMed.
  24. B. Dubertret, P. Skourides, D. J. Norris, V. Noireaux, A. H. Brivanlou and A. Libchaber, Science, 2002, 298, 1759–1762 CrossRef CAS PubMed.
  25. A. A. Deniz, T. A. Laurence, M. Dahan, D. S. Chemla, P. G. Schultz and S. Weiss, Annu. Rev. Phys. Chem., 2001, 52, 233–253 CrossRef CAS PubMed.
  26. P. Li, L. B. Fang, H. Zhou, W. Zhang, X. Wang, N. Li, H. B. Zhong and B. Tang, Chem.–Eur. J., 2011, 17, 10520–10523 CrossRef CAS PubMed.
  27. L. Y. Zheng, Y. W. Chi, Y. Q. Dong, J. P. Lin and B. B. Wang, J. Am. Chem. Soc., 2009, 131, 4564–4565 CrossRef CAS PubMed.
  28. Y. Dong, N. Zhou, X. Lin, J. Lin, Y. Chi and G. Chen, Chem. Mater., 2010, 22, 5895–5899 CrossRef CAS.
  29. J. Zhou, C. Booker, R. Li, X. Zhou, T. K. Sham, X. Sun and Z. J. Ding, J. Am. Chem. Soc., 2007, 129, 744–745 CrossRef CAS PubMed.
  30. S. Y. Liu, F. P. Shi, X. J. Zhao, L. Chen and X. G. Su, Biosens. Bioelectron., 2013, 47, 379–384 CrossRef CAS PubMed.
  31. G. N. Wang, C. Wang, W. C. Dou, Q. Ma, P. F. Yuan and X. G. Su, J. Fluoresc., 2009, 19, 939–946 CrossRef CAS PubMed.
  32. X. Wei, M. J. Meng, Z. L. Song, L. Gao, H. J. Li, J. D. Dai, Z. P. Zhou, C. X. Li, J. M. Pan, P. Yu and Y. S. Yan, J. Lumin., 2014, 153, 326–332 CrossRef CAS.
  33. W. T. Wu, T. Zhou, A. Berliner, P. Banerjee and S. Q. Zhou, Angew. Chem., Int. Ed., 2010, 122, 6704–6708 CrossRef.

This journal is © The Royal Society of Chemistry 2016
Click here to see how this site uses Cookies. View our privacy policy here.