
High-temperature crystalline α′H- and α-Ca2SiO4:Eu2+ phosphors stabilized at room temperature by incorporating phosphorus ions
Jingjing Chen†
a,
Yanfang Yang†b,
Jiao Xua,
Zhiyong Mao*b,
Dajian Wangb,
Lijian Bie*a and
Bradley D. Fahlmanc
aTianjin Key Laboratory for Photoelectronic Materials and Devices, Tianjin University of Technology, Tianjin 300384, PR China. E-mail: mzhy984@163.com
bSchool of Materials Science and Engineering, Tianjin University of Technology, Tianjin 300384, PR China. E-mail: ljbie@tjut.edu.cn
cDepartment of Chemistry & Biochemistry and Science of Advanced Materials Program, Central Michigan University, Mount Pleasant, MI 48859, USA
First published on 31st August 2016
Abstract
In this work, high-temperature crystalline α′H- and α-Ca2SiO4:Eu2+ phosphors stabilized at room temperature are synthesized by incorporating a suitable amount of phosphorus ions. The crystalline structures and the influence of phosphorus ions on the crystalline phases as well as the photoluminescent properties for phosphorus stabilized α′H- and α-Ca2SiO4:Eu2+ phosphors are investigated in detail. The results indicate that the α′H- and α-Ca2SiO4 high-temperature crystalline phases can be quenched at room temperature with incorporation of 12% and 42% phosphorus ions (replacing Si ions), respectively, shielding the stability effect of Eu2+ ions on the β-form (low Eu2+ concentration) and α′L-form (high Eu2+ concentration). Tunable emissions from green to orange-red light are observed with the increase of the Eu2+ doping concentration in both of α′H-Ca2Si0.88P0.12O4:Eu2+ and α-Ca2Si0.58P0.42O4:Eu2+ phosphors, indicating their promising prospect in applications of LED lighting.
Introduction
In recent years, white light emitting diodes (WLEDs) have been championed as the next-generation lighting source by researchers owing to its outstanding advantages of high efficiency, energy saving and long lifetime.1,2 The performances of WLEDs, such as luminous efficiency, color rendering index (CRI) and correlated color temperature (CCT), are strongly dependent on the luminescent properties of the phosphor, which is one of the key materials in fabricating white LEDs. During the past decades, the discovery and development of phosphors applied in WLEDs have moved from a single family of phosphor compound, the Ce3+ doped Y3Al5O12, to a plethora of rare earth ions doped aluminates, sulfides, nitrides and molybdates.3–6 Nonetheless, these phosphor systems are still suffering from the drawbacks of themselves in the practical applications, such as deficiency of red component easily results in lower CRI and higher CCT of WLEDs for Y3Al5O12:Ce3+ phosphor; poor thermal and chemical stability is announced for sulfides phosphors; higher cost raw materials and rigorous synthesis equipment are required for nitrides phosphors. Phosphor materials with characters of excellent luminescent properties, outstanding chemical stability and facile synthesis process are desired for the urgent demands in WLEDs. Alternatively, silicates phosphors application for WLEDs have achieved rapid development in recently years, exampling as M3MgSi2O8:Eu2+,Mn2+, M3SiO5:Ce3+, MAl2Si2O8:Eu2+,Mn2+, MSiO3:Eu2+, MSi2O4:Eu2+ (M = Ca, Sr, Ba, Zn, Mg) etc.,7–11 in view of their merits of strong absorption ability in the near-UV blue light region, high quantum efficiency and excellent chemical stability as well as low cost.As a member of silicates phosphors, the exploitation of rare earth-doped dicalcium silicate phosphors could be dated back to in 1860s.12 It was well recognized that dicalcium silicate is a polymorph, at least five of crystalline phases, γ-, β-, α′L-, α′H-, α-Ca2SiO4, have been known in ascending order with respect to the phase-stability temperature by previous high-temperature X-ray investigations.13 Basing on the kaleidoscope of crystal-phases (γ-, β-, α′L-, α′H-, α-Ca2SiO4) of dicalcium silicate, a plenty of rare earth doped phosphors with variable luminescence have been exploited for applications in WLEDs.14–23 As for rare earth-doped dicalcium silicate phosphors, the doping rare-earth ions play the role of crystal-phase-stabilizer (CPS) on β-form at the same time. This is the reason why the early reported Ca2SiO4-based phosphors were confined to β-form.12,14–16 Until to recent years, other crystalline-phase Ca2SiO4 phosphors with diversity of luminescent properties were exploited gradually by incorporating suitable CPS to shield the stability effect of rare earth ions on β-form. Such as, Jang and Kalaji et al. reported the production of γ-Ca2SiO4:Ce3+ yellow emitting phosphor by incorporating Li+ or Al3+ ions, which was employed as γ-form CPS.17,18 Xia' and Lin' as well as our previous works showed that incorporation of Sr atoms into Ca2SiO4 might make α′L-form quenchable to room temperature, resulting in the formation of α′L-Ca2−xSrxSiO4:Ce3+ and α′L-Ca2−xSrxSiO4:Eu2+ phosphors.19–21 In addition, Sato reported the occurrence of phase transformation from β-form to α′L-form in Ca2−xEuxSiO4 system induced by the increasing the Eu2+ doping content and α′L-Ca2SiO4:Eu2+ red-emitting phosphors was obtained when the Eu2+ doping concentration is larger than x = 0.2.22 Very recently, a systematic research about the entire five crystalline-phases of Eu2+ doped dicalcium silicate phosphors with tunable emission was demonstrated by our group.23 To the best of our knowledge, however, there are only a very few papers pertaining to the investigation of luminescence of rare earth ions in α′H- and α-Ca2SiO4, which are high-temperature crystalline-phases in thermodynamics. One of these is our recent publication about the five crystalline-phases of Eu2+ doped dicalcium silicate phosphors;23 another paper described the luminescence of α-Ca2Si0.71P0.29O4:Eu2+ phosphor stabilized by incorporating phosphate ions.24 Therefore, further efforts are needed to be paid on the exploitation of rare earth doped high-temperature α′H- and α-Ca2SiO4 phosphors and the understanding of luminescence for these phosphor materials. Additionally, exploitation of high-temperature α′H- and α-Ca2SiO4 phosphors will enrich greatly the systems of silicates phosphors.
Herein, we focused our attentions to synthesize high-temperature crystalline α′H- and α-Ca2SiO4:Eu2+ phosphors stabilized at room temperature by incorporating suitable content of phosphorus ions, which is employed to act as CPS on α′H- and α-forms with various doping concentration. The influence of phosphorus ions on the crystal phase and photoluminescent properties of Eu2+ ions in α′H- and α-Ca2SiO4 hosts are investigated in detail.
Experimental section
Traditional solid-state reaction method was employed to prepare high temperature crystalline α′H- and α-Ca2SiO4:Eu2+ phosphors, using CaCO3 (99.999%), nano-SiO2 (99.9%, 30 ± 5 nm), Eu2O3 (99.99%), and NH4H2PO4 (99.9%) as the raw material powders. According to the designed stoichiometric compositions, Ca2−xSi1−mPmO4:xEu2+ (m = 0.12, 0.42; x = 0.02, 0.04, 0.08, 0.10, 0.20, 0.30, 0.40), incorporating with suitable content of phosphorus ions, raw material powders were weighted precisely and grinded together in an agate mortar with a small amount of ethanol. Then the dried mixture was transferred into alumina crucibles and sintered at 1100 °C for 5 h with one intermediary grinding, following which the powders were second sintered in the tube furnace at 1450 °C for 10 h. For all sintering processes, N2–H2 (N2/H2 = 92![[thin space (1/6-em)]](https://www.rsc.org/images/entities/char_2009.gif) :8 in volume) reduction atmosphere was performed. Upon cooling down to room temperature and grinding to fine powders, final α′H- and α-Ca2SiO4:Eu2+ phosphors samples were obtained.
:8 in volume) reduction atmosphere was performed. Upon cooling down to room temperature and grinding to fine powders, final α′H- and α-Ca2SiO4:Eu2+ phosphors samples were obtained.
The X-ray diffraction (XRD) patterns of the as-received phosphors were measured by a diffractometer (Rigaku, RINT Ultima-III, Japan) with a graphite monochromator using Cu-Kα radiation, operating at 40 kV and 40 mA. The scanning rate for phase identification was fixed at 4° min−1 with a 2θ range from 20° to 50°, and the data for the Rietveld analysis were collected in a step-scanning mode with a step size of 0.01° and 2 s counting time per step over a 2θ range from 5° to 130°. Photo-luminescence (PL) and photoluminescence of excitation (PLE) spectra of samples were recorded by a fluorescence spectrometer (Hitachi F-4600, Japan). The diffuse-reflectance spectra (DRS) were recorded by UV-visible spectrometer (TU-1901, China) with integration sphere. CIE chromatic coordinates for the prepared phosphors were examined on a PMS-50 Plus UV-Vis-Near IR Spectro-photocolorimeter (EVERINE, China) system equipped with phosphor excitation equipment (PE-II, λex = 365 nm). The quantum efficiency of samples was measured in QY-2000 integration sphere fluorescence spectrometer equipped with a 450 W Xe lamp as excitation source. Thermal stability of the phosphors was tested by an exciting spectra and thermal quenching analyzer for phosphor (Everfine Co. Ltd, EX-1000, China).
Results and discussion
Among the dicalcium silicate polymorphs, γ-Ca2SiO4 is the thermodynamically stable phase at room temperature, with the orthorhombic olivine types of structure (space group Pbnm); β-Ca2SiO4, a metastable monoclinic phase (space group P21/n) under room conditions; α′L- and α′H-Ca2SiO4 orthorhombic phases stable at higher temperature, and α′L-Ca2SiO4 (space group Pna21) is generally considered to be a superstructure of α′H-Ca2SiO4 (space group Pama); while the structure of highest-temperature α-Ca2SiO4 is still uncertain and is proposed to have trigonal or hexagonal symmetry. It was reported that high temperature crystalline-forms β-, α′H- and α-Ca2SiO4 could be stabilized by incorporating certain amounts of phosphate ions.25,26 The phase diagram of Ca2SiO4–Ca3(PO4)2 system is depicted in Fig. 1(a). In this phase diagram, Ca2SiO4 and Ca3(PO4)2 is indexed as C2S and C3P respectively; phase α′-C2S indicates the higher temperature phases α′L- or α′H-C2S; phase A is the highest-temperature phase α-C2S; phase R is the solid solution of α′-C2S and α-C3P; phase S is the solid solution of 5Cao–P2O5–SiO2. It shows that with increasing amounts of phosphate first the β-phase and then the α′-phase of Ca2SiO4 is stabilized. With about 50 wt% Ca3(PO4)2 finally the highest temperature form α-Ca2SiO4 is quenchable at room temperature. This feature endows the opportunity in synthesizing high-temperature crystalline α′H- and α-Ca2SiO4:Eu2+ phosphors.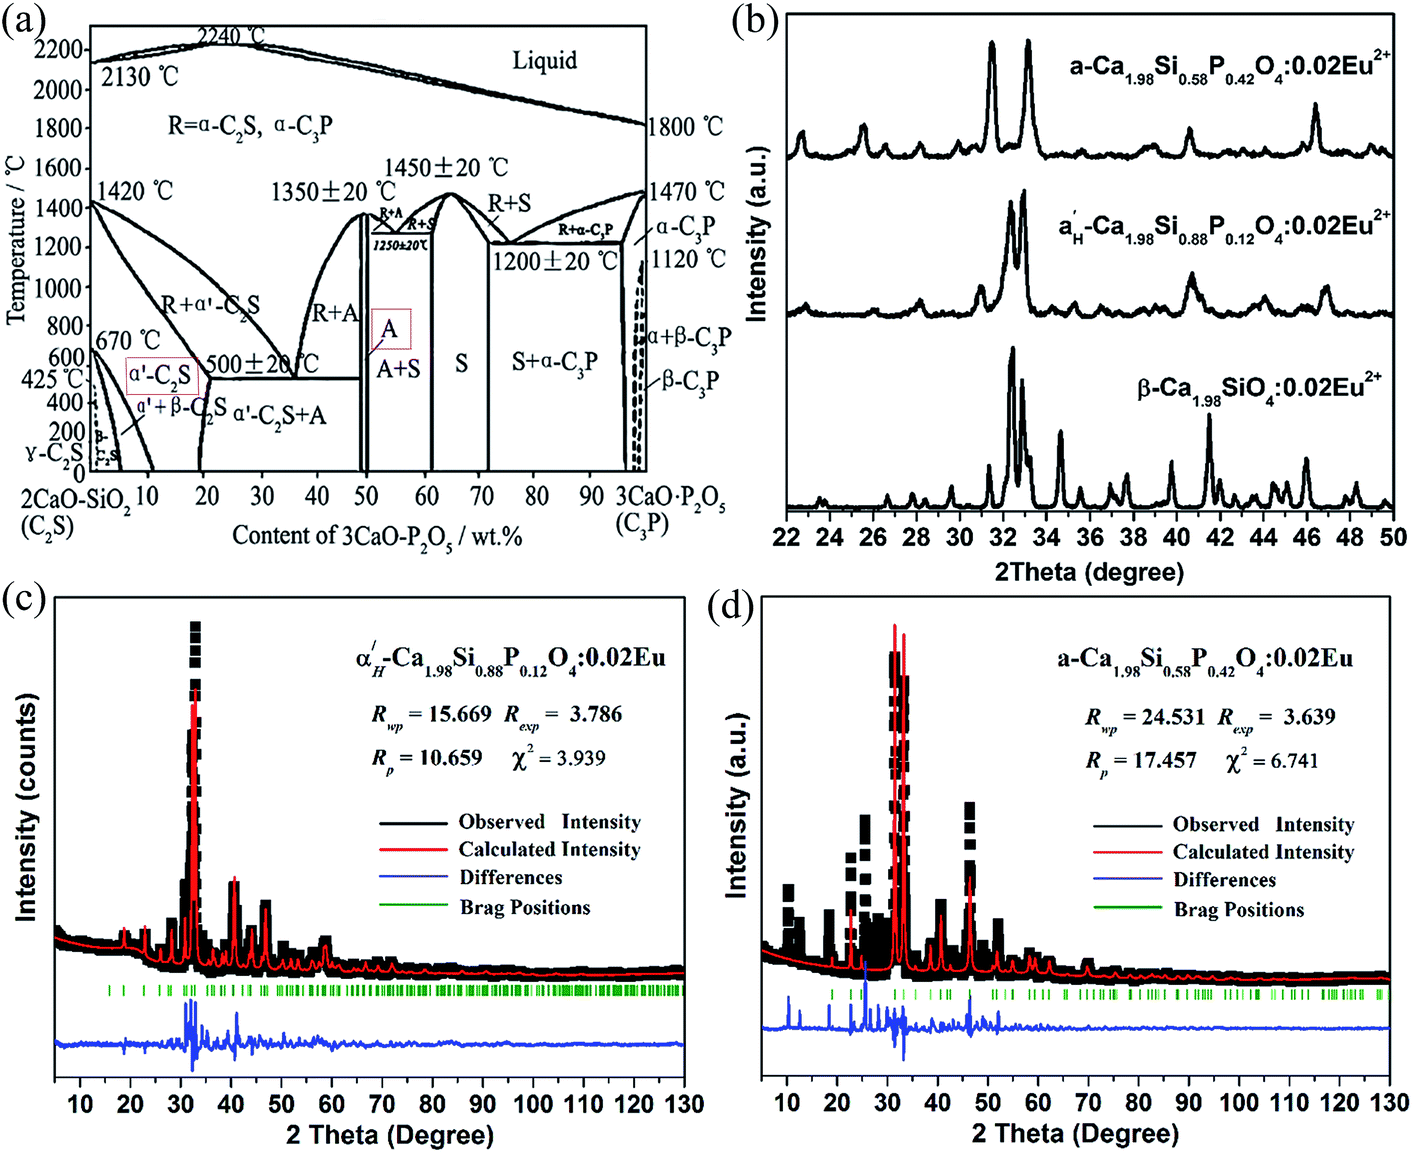 | ||
| Fig. 1 (a) Phase diagram of Ca2SiO4(C2S)–Ca3(PO4)2(C3P) system, phase α′-C2S indicates the higher temperature phases α′L- or α′H-C2S, phase A indicates the highest-temperature phase α-C2S, phase R is the solid solution of α′-C2S and α-C3P, phase S is the solid solution of 5Cao–P2O5–SiO2; (b) XRD patterns for as-prepared Ca1.98Si1−mPmO4:0.02Eu2+ (m = 0.00, 0.12, 0.42) phosphors incorporated variable amount of phosphate ions; Rietveld plots and the main parameters of the processing and refinement for (c) α′H-Ca1.98Si0.88P0.12O4:0.02Eu2+ sample; and (d) α-Ca1.98Si0.58P0.42O4:0.02Eu2+ sample. | ||
The crystalline phase of our prepared Ca1.98Si1−mPmO4:0.02Eu2+ (m = 0.00, 0.12, 0.42) samples incorporated variable amount of phosphate ions was measured by the XRD, as shown in Fig. 1(b). These diffraction patterns were indexed to be β-Ca2SiO4 (ICSD no. 79550), α′H-Ca2SiO4 (ICSD no. 82997) and α-Ca2SiO4 (ICSD no. 82999) respectively. β-Modification was identified for the phosphate ions free sample because of the appearance of Eu2+ ions, which acts the CPS on β-form. Higher temperature phase α′H-Ca2SiO4 and highest-temperature phase α-Ca2SiO4 were obtained when the incorporation amount of phosphate ions is m = 0.12 and m = 0.42 respectively. These observations are well agreeable with the results reported in elsewhere.25,26 The powder diffraction data of α′H-Ca1.98Si0.88P0.12O4:0.02Eu2+ and α-Ca1.98Si0.58P0.42O4:0.02Eu2+ samples were then refined to clear the their crystalline structure via the Rietveld analysis performed by using TOPAS 4.2. The Rietveld plots for these two samples and main parameters of the processing and refinement were shown in Fig. 1(c) and (d) respectively. We can find that the α′H-Ca1.98Si0.88P0.12O4:0.02Eu2+ sample could be indexed to the orthorhombic cell (Pnma) with parameters of a = 6.831 Å, b = 5.436 Å and c = 9.394 Å. While α-Ca1.98Si0.58P0.42O4:0.02Eu2+ sample could be indexed to the hexagonal cell (p![[3 with combining macron]](https://www.rsc.org/images/entities/char_0033_0304.gif) m1) with parameters of a = 5.394 Å, b = 5.394 Å, c = 7.171 Å. Obvious shrinkage of crystal cell were found for these phosphate ions incorporated samples owing to the replacement of larger Si4+ ions (0.40 Å) by smaller P5+ ions (0.31 Å), comparing with the corresponding original crystalline cells free of phosphate ions (α′H-Ca2SiO4: a = 6.871 Å, b = 5.601 Å and c = 9.556 Å; α-Ca2SiO4: a = 5.532 Å, b = 5.532 Å, c = 7.327 Å). The α′H- and α-Ca2SiO4:Eu2+ phosphors stabilized by the incorporation of phosphate ions might give important insights into the luminescence of Eu2+ ions in high temperature Ca2SiO4-modifications. It is worth to note that there would generate vacancies on the Ca-sublattice to balance the charge difference as Si4+ ions were preplaced by P5+ ions.
m1) with parameters of a = 5.394 Å, b = 5.394 Å, c = 7.171 Å. Obvious shrinkage of crystal cell were found for these phosphate ions incorporated samples owing to the replacement of larger Si4+ ions (0.40 Å) by smaller P5+ ions (0.31 Å), comparing with the corresponding original crystalline cells free of phosphate ions (α′H-Ca2SiO4: a = 6.871 Å, b = 5.601 Å and c = 9.556 Å; α-Ca2SiO4: a = 5.532 Å, b = 5.532 Å, c = 7.327 Å). The α′H- and α-Ca2SiO4:Eu2+ phosphors stabilized by the incorporation of phosphate ions might give important insights into the luminescence of Eu2+ ions in high temperature Ca2SiO4-modifications. It is worth to note that there would generate vacancies on the Ca-sublattice to balance the charge difference as Si4+ ions were preplaced by P5+ ions.
As above mentioned that phase transformation from β-form to α′L-form in Ca2−xEuxSiO4 system was observed by researchers if the Eu2+ doping content was larger x = 0.20 mol.22,23 Fig. 2(a) showed the XRD patterns for the prepared Ca2−xSi0.88P0.12O4:xEu2+ (x = 0.02, 0.04, 0.08, 0.10, 0.20, 0.30, 0.40) phosphor samples with variable Eu2+ doping concentration. It is obviously observed that the crystalline-phase for all these samples incorporated with 0.12 mol phosphate ions can be well indexed as α′H-phase independent on the Eu2+ doping content. Apparently, the stable existence of α′H-phase even with higher Eu2+ dopants (0.20–0.40 mol) obtained in this work is ascribed to the incorporation of phosphate ions, which acts as a strong CPS on α′H-form in suppressing the phase-transformation induced by higher Eu2+ dopants. Fig. 2(b) depicted the diffuse reflectance spectra (DRS) of α′H-Ca2−xSi0.88P0.12O4:xEu2+ phosphor samples doped with various Eu2+ concentration and that of pure α′H-Ca2Si0.88P0.12O4 host without doping Eu2+ ions. For the pure α′H-Ca2Si0.88P0.12O4 host, a strong absorption band below 300 nm was observed, corresponding to the valence-to-conduction band transitions of α′H-Ca2Si0.88P0.12O4 host lattice. In the Eu2+ doped α′H-Ca2Si0.88P0.12O4 phosphor samples, strong absorption bands are in the wavelength range from 250 nm to 500 nm, which can be attributed to the transition absorption from ground state 4f7 to its excited states 4f65d of Eu2+ doped in α′H-Ca2Si0.88P0.12O4 hosts. With the increase of Eu2+ ions doped content, an obvious red-shift for the transition absorption band of Eu2+ ions is observed. In addition, the absorption intensity is enhanced with the increase of doped content of Eu2+ ions.
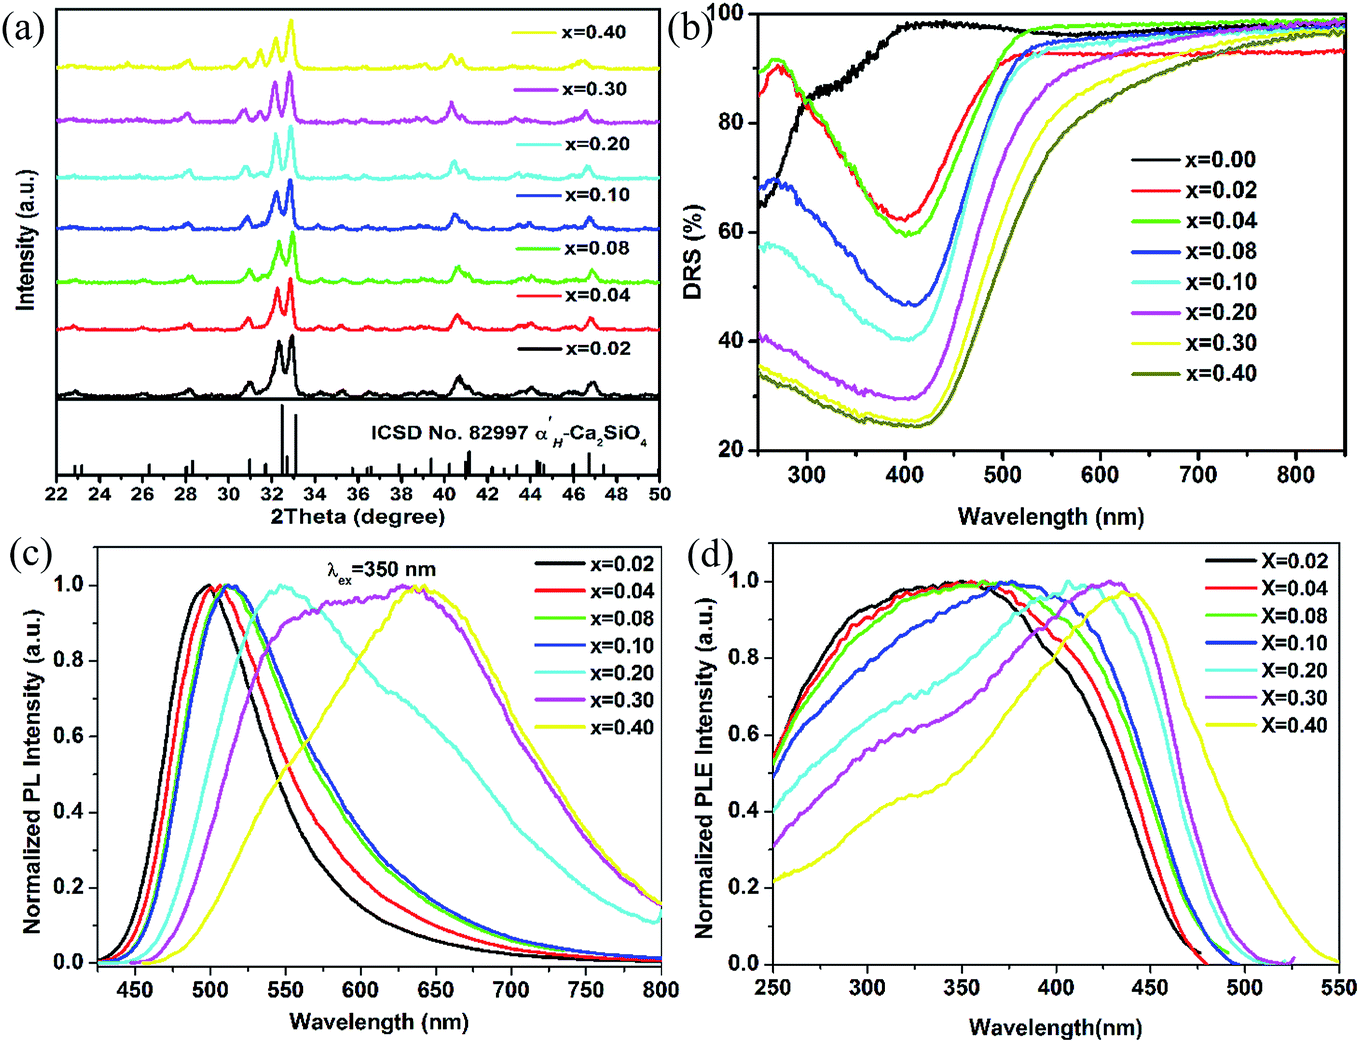 | ||
| Fig. 2 (a) XRD patterns; (b) diffuse reflectance spectra (DRS); (c) normalized PL spectra (λex = 350 nm); and (d) PLE spectra monitored at emission peaks for as-prepared α′H-Ca2−xSi0.88P0.12O4:xEu2+ phosphor samples doping with variable Eu2+ ions concentration. Diffuse reflectance spectrum of pure α′H-Ca2Si0.88P0.12O4 host without doping Eu2+ ions was given a reference in (b). | ||
The normalized PL spectra under the excitation of 350 nm for α′H-Ca2−xSi0.88P0.12O4:xEu2+ phosphor samples were illustrated in Fig. 2(c). α′H-Ca2Si0.88P0.12O4:Eu2+ phosphors showed broad band emission with variable wavelength peaks, depending on the Eu2+ doping concentration. These broad emission bands originate from the 4f65d → 4f7 transition of Eu2+ ions doped in α′H-Ca2Si0.88P0.12O4 lattice. It is obviously observed that the emission peak shifts from 490 nm to 640 nm with the increasing of Eu2+ doping concentration from 0.02 to 0.40 mol. The red-shifting phenomenon is widely reported in Eu2+ ions doped phosphors, resulting from higher doping concentrations. The most common reason for this is an increase of the crystal field splitting, which lowers the 5d → 4f transition energy. However, the increasing substitution of larger Eu2+ ions for smaller Ca2+ ions will result in the lattice expansion of host lattice. This lattice expansion should instead shift the 5d → 4f emission of Eu2+ to the higher-energy side by decreasing the crystal field splitting strength. Another possible reason for the red-shift resulting from higher concentrations of Eu2+ dopants is thought to be re-absorption. In this situation, the re-absorption reduces the higher-energy portion of the emission band, while the longer-wavelength portion gains intensity. Hence, a characteristic feature for re-absorption induced red shift is no change in the emission band shape. Re-absorption mechanism contributes to the red-shift for lower Eu2+ dopant samples (x = 0.02–0.10 mol) in Fig. 2(c), taking into account about the consistent band shape. However, an obvious change about the emission band shape is observed for Eu2+ dopant concentrations between x = 0.10 to x = 0.40. For the higher Eu2+ dopant samples (x = 0.20–0.40 mol), their emission band could be split into two independent Gaussian peaks, indicating a contribution from two types of Eu2+ luminescence centers. As stated in our previous work, two Ca2+ sites (Ca(1)O15 polyhedra and Ca(2)O11 polyhedra) exist in the α′H-Ca2SiO4 host, which will lead to two types of Eu2+ luminescent centers.23 For samples with lower doping concentrations (x = 0.02–0.10 mol), the Eu2+ ions prefer to occupy the larger Ca2+(1) sites rather than the smaller Ca2+(2) sites (the average Ca2+–O2− bond length for Ca2+(1) sites (2.52 Å) is longer than that in Ca2+(2) sites (2.50 Å)). It should be expected that the nephelauxetic effect and crystal-field splitting for Eu2+ ions occupying Ca2+(2) sites will be stronger than that of Eu2+ in Ca2+(1) sites owing to the shorter Eu2+–O2− bond. Thus, the emissions for lower dopant concentrations α′H-Ca2−xSi0.88P0.12O4:xEu2+ (x = 0.02–0.10 mol) phosphor systems were assigned to the substitution of Eu2+ in Ca2+(1) sites. As the Eu2+ dopant concentration increases to 0.20 mol, the emission band was split into two bands, indicating the valid occupancies of Eu2+ ions in both of Ca2+(1) and Ca2+(2) sites. Further increases in the Eu2+ concentration leads to a more pronounced emission band above 600 nm (Eu2+ in Ca2+(2) sites), whereas the emission band below 600 nm (Eu2+ in Ca2+(1) sites) gets weaker and eventually disappears at a Eu2+ dopant concentration of 0.40 mol due to concentration quenching. Therefore, the red-shift observed in larger Eu2+ dopants samples could be ascribed to the variation of valid Eu2+ luminescent center from Ca2+(1) sites to Ca2+(2) sites.
The PLE spectra monitored at emission peaks for α′H-Ca2−xSi0.88P0.12O4:xEu2+ phosphor samples were shown in Fig. 2(d). Broad excitation bands in the range of 250 nm to 500 nm were traced for these phosphors, indicating the promising prospect in fabricating white LEDs with near-UV or blue LED chips. With the increase of Eu2+ dopant concentration, the excitation band edge shifts to longer wavelength, which is agreeable with the observation in DRS (Fig. 2(b)).
As observed in Fig. 1(b), highest temperature α-phase could be quenchable at room temperature by incorporating 0.42 mol phosphate ions. The XRD patterns for 0.42 mol phosphate ions stabilized Ca2−xSi0.58P0.42O4:xEu2+ (x = 0.02, 0.04, 0.08, 0.10, 0.20, 0.30, 0.40) phosphor samples doped with variable Eu2+ content are depicted in Fig. 3(a). Well crystallized α-phase is identified for these samples independent on the Eu2+ doping content, owing to the strong stabilized effect of 0.42 mol phosphate ions incorporation on α-form dicalcium silicate. Similar with the observation in α′H-Ca2−xSi0.88P0.12O4:xEu2+ phosphors, the transition absorption band of Eu2+ ions in α-Ca2−xSi0.58P0.42O4 phosphors becomes stronger and behaviors a red-shift with the increasing of Eu2+ doping concentration, as shown in Fig. 3(b).
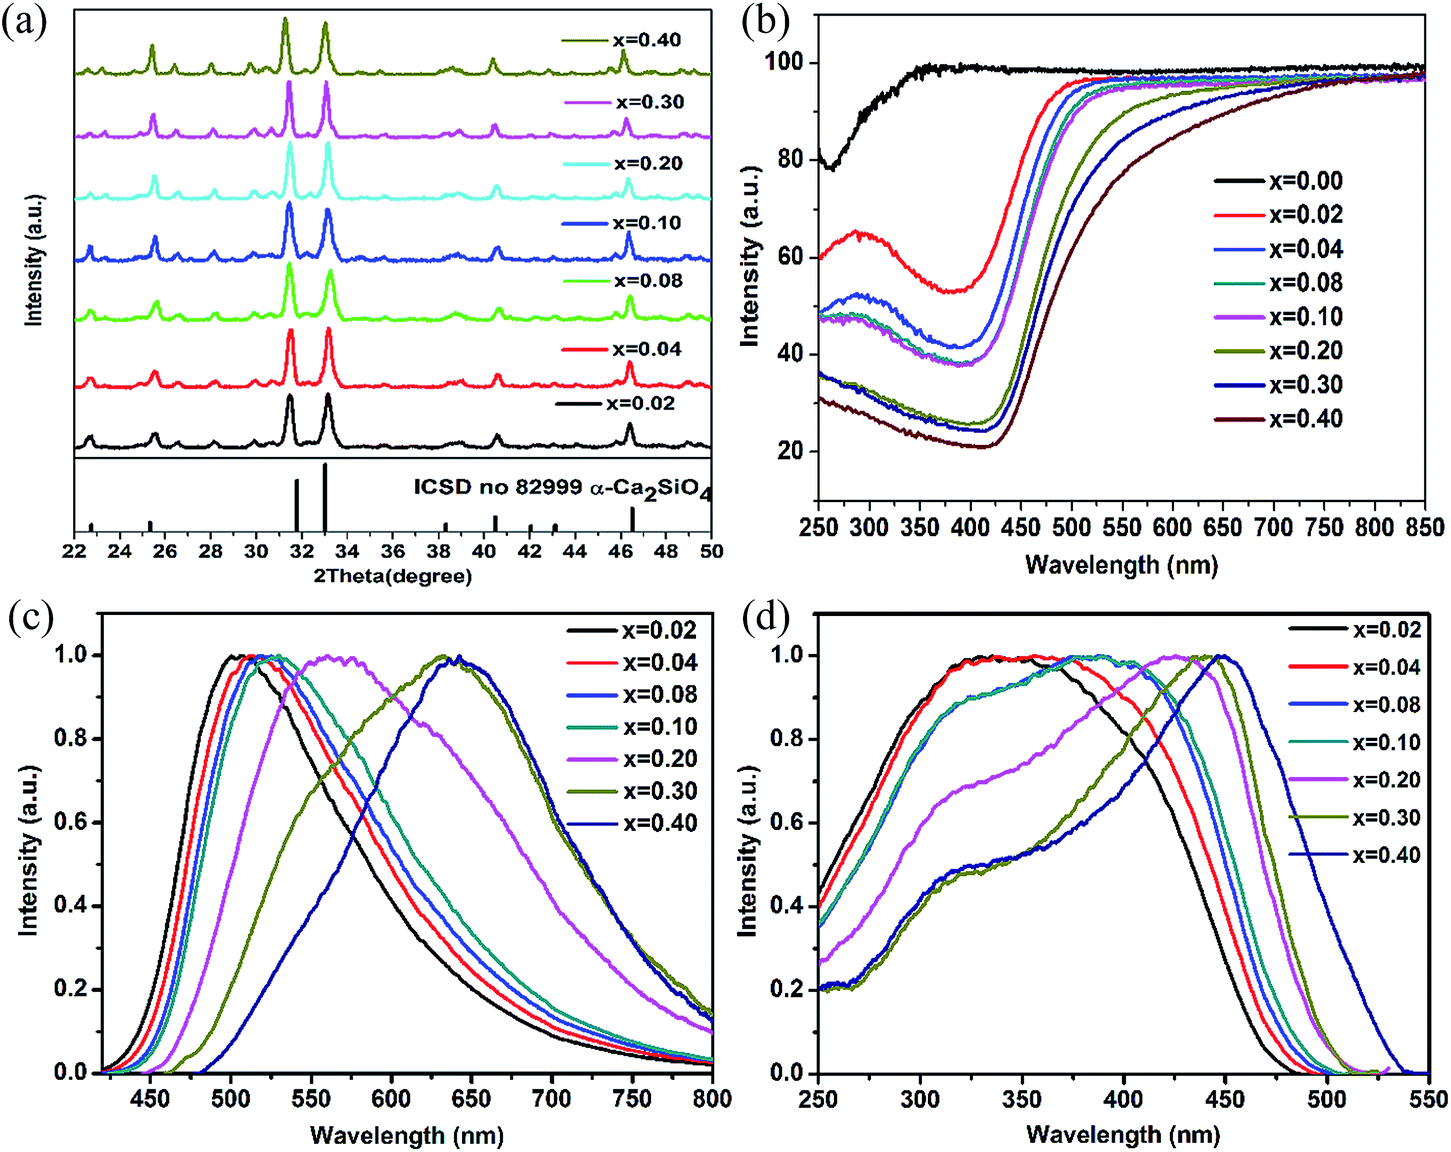 | ||
| Fig. 3 (a) XRD patterns; (b) diffuse reflectance spectra (DRS); (c) normalized PL spectra (λex = 350 nm); and (d) PLE spectra monitored at emission peaks for as-prepared α-Ca2−xSi0.58P0.42O4:xEu2+: xEu2+ phosphor samples doping with variable Eu2+ ions content. Diffuse reflectance spectrum of pure α-Ca2−xSi0.58P0.42O4 host without doping Eu2+ ions was given a reference in (b). | ||
The normalized PL under the excitation of 350 nm and PLE spectra monitored at emission peaks for α-Ca2−xSi0.58P0.42O4:xEu2+ phosphors doped with variable Eu2+ content were illustrated in Fig. 3(c) and (d) respectively. Similar red shift from 508 nm to 640 nm is also observed on the normalized PL spectra for α-Ca2−xSi0.58P0.42O4:xEu2+ phosphors with the increasing of Eu2+ dopant concentration. The slight red shift without changing the emission band shape for lower Eu2+ dopant concentrations (x = 0.02–0.10 mol) was due to re-absorption mechanism. The obvious change in the emission band shape was observed for concentrations between x = 0.10 to x = 0.40, implying the variation of valid luminescent centers in α-Ca2−xSi0.58P0.42O4 host. The obvious red-shift induced by larger Eu2+ ions dopant concentration could be ascribed to a change of the Eu2+ luminescent centers between Ca2+(1) to Ca2+(2) sites in α-Ca2−xSi0.58P0.42O4 lattice. Ca(1)O14 polyhedra with longer Ca2+–O2− bond length (2.68 Å) is responsible for the green emitting light while Ca(2)O6 polyhedra with shorter Ca2+–O2− bond length (1.95 Å) is assigned to the deep red emitting light. Broad excitation bands in the range of 250 nm to 500 nm were traced for α-Ca2−xSi0.58P0.42O4:xEu2+ phosphors, showing potential application in white LEDs.
The relative PL spectra under the excitation of 350 nm for α′H-Ca2−xSi0.88P0.12O4:xEu2+ phosphors and α-Ca2−xSi0.58P0.42O4:xEu2+ phosphors were given in Fig. 4(a) and (b) respectively. The optimal Eu2+ doping concentration (highest luminous intensity) for α′H-Ca2−xSi0.88P0.12O4:xEu2+ phosphors and α-Ca2−xSi0.58P0.42O4:xEu2+ phosphors were detected to be 0.04 mol and 0.02 mol, respectively. As the doping concentration above the optimal values, the emission intensity of phosphors begins to decrease owing to the concentration quenching effect. In addition, the emission peaks show an obviously red-shift with the increasing of the Eu2+ dopant concentration. Fig. 4(c) and (d) showed the Commission International del’Eclairage (CIE) chromaticity coordinates and corresponding emitting photographs for α′H-Ca2−xSi0.88P0.12O4:xEu2+ and α-Ca2−xSi0.58P0.42O4:xEu2+ phosphors under the excitation of 365 nm. It could be seen that the emitting color of the phosphors can be easily modulated from the green light to the yellow-red light by increasing the Eu2+ doping concentration for both α′H-Ca2Si0.88P0.12O4:Eu2+ phosphors and α-Ca2Si0.58P0.42O4:Eu2+ phosphors. Accordingly, the corresponding CIE coordinates of Ca1.79−xSi0.58P0.42O4:xEu2+ change from green region to orange-red region, along with the increase of the Eu2+ concentration.
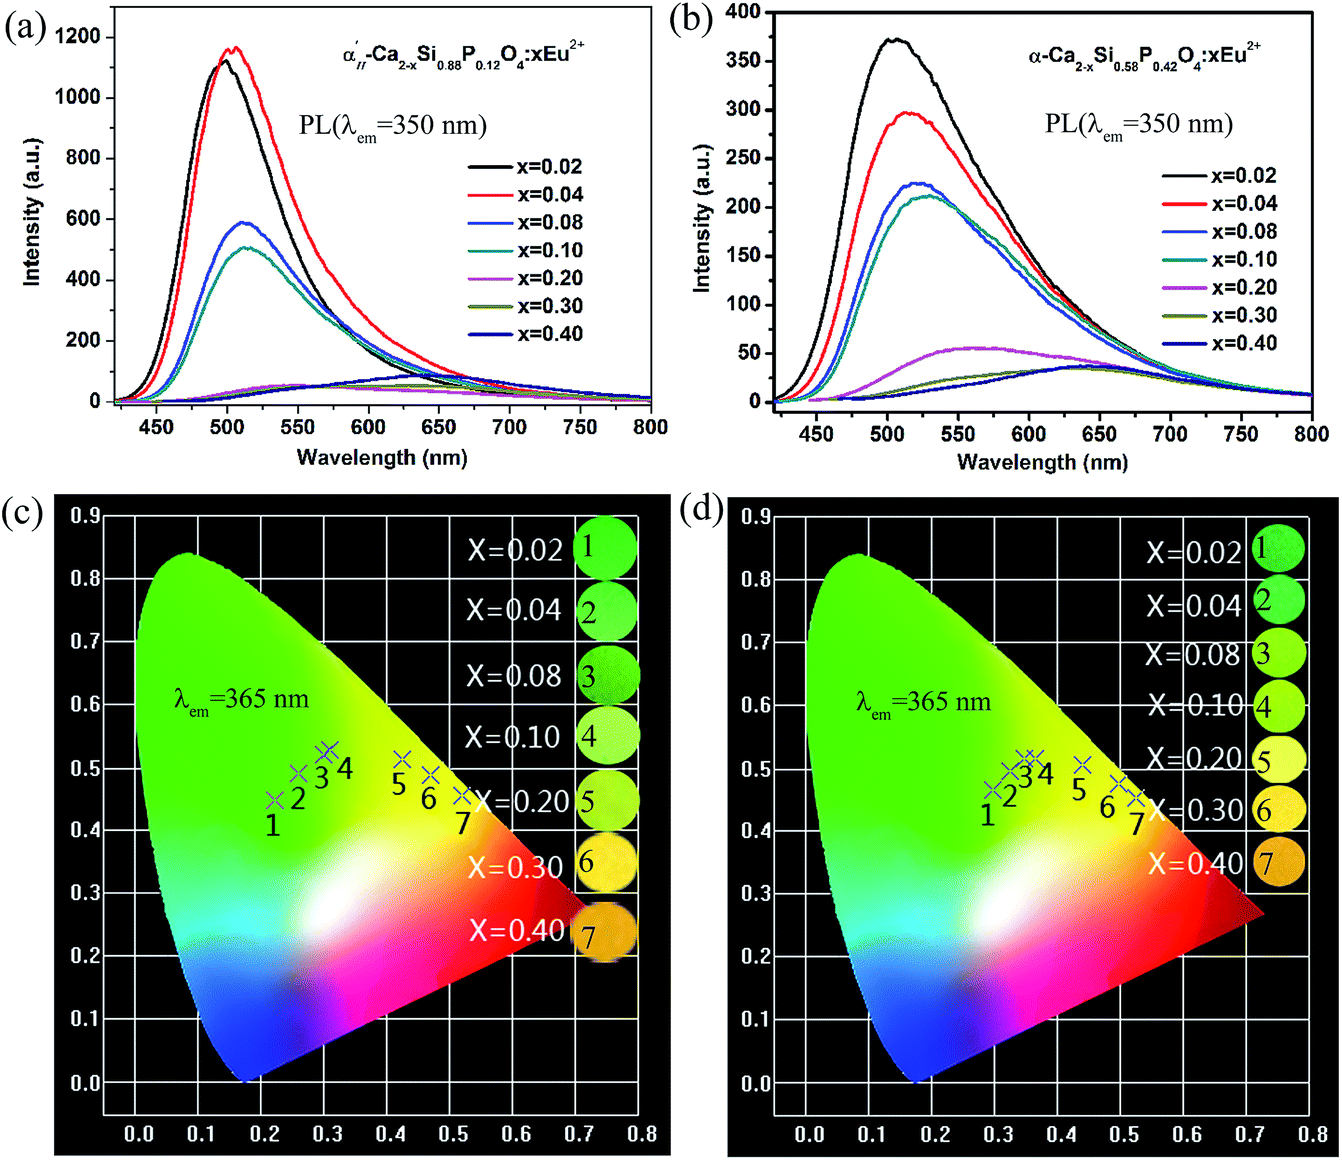 | ||
| Fig. 4 Relative PL spectra (λex = 350 nm) for as-prepared (a) α′H-Ca2−xSi0.88P0.12O4:xEu2+ phosphors samples; (b) α-Ca2−xSi0.58P0.42O4:xEu2+ phosphors samples doped with variable Eu2+ content; CIE chromaticity coordinates and the corresponding emitting photographs (λex = 365 nm) for as-prepared (c) α′H-Ca2−xSi0.88P0.12O4:xEu2+ phosphors samples; (d) α-Ca2−xSi0.58P0.42O4:xEu2+ phosphors samples doped with variable Eu2+ concentration. | ||
In the LEDs application, especial for those higher power LEDs, excellent thermal stability for phosphors is in favor of keeping the chromaticity and output brightness. Fig. 5 represented the relative emission intensity of as-prepared α′H-Ca1.98Si0.88P0.12O4:0.02Eu2+ and α-Ca1.98Si0.58P0.42O4:0.02Eu2+ phosphors samples as a function of temperature using commercial YAG:Ce3+ phosphor as a benchmark. As the temperature increases from room temperature to 210 °C, the emission intensity for α′H-Ca1.98Si0.88P0.12O4:0.02Eu2+ and α-Ca1.98Si0.58P0.42O4:0.02Eu2+ samples decreased by 65% and 70% of the initial value respectively. Obviously, the thermal stability of the high temperature crystalline α′H- and α-Ca2SiO4:Eu2+ phosphors was much inferior, comparing with the YAG:Ce3+ phosphor reference (intensity decrease about 17% of the initial value). The poor thermal stability for α′H-Ca1.98Si0.88P0.12O4:0.02Eu2+ and α-Ca1.98Si0.58P0.42O4:0.02Eu2+ phosphors might be ascribed to the thermodynamic instability of high-temperature crystalline α′H- and α-Ca2SiO4 phases.
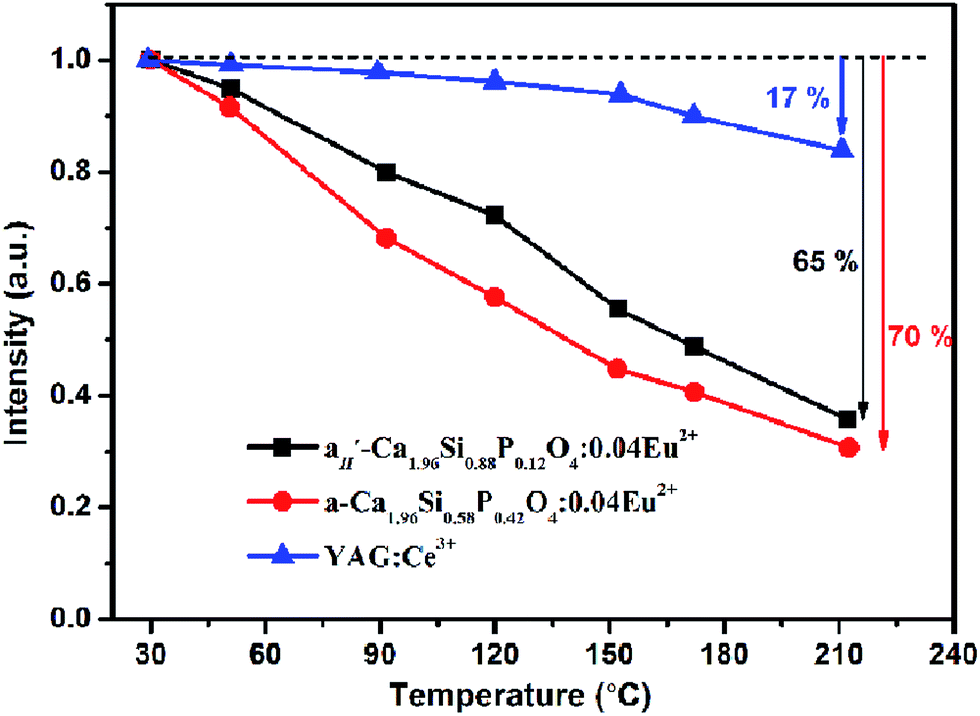 | ||
| Fig. 5 Temperature dependent emission intensity for as-prepared α′H-Ca1.98Si0.88P0.12O4:0.02Eu2+ (λex = 400 nm) and α-Ca1.98Si0.58P0.42O4:0.02Eu2+ (λex = 400 nm) phosphors samples as well as the commercial YAG:Ce3+ (λex = 460 nm) reference. | ||
Luminescence quantum efficiency (ηQE) is very important for phosphor materials in the practical application. The absolute ηQE values (listed in Table 1) for as-prepared α′H-Ca2−xSi0.88P0.12O4:xEu2+ phosphors and α-Ca2−xSi0.58P0.42O4:xEu2+ phosphors samples were calculated through the following equation:
| ηQE = LS/(ER − ES) |
| Quantum efficiency | x = 0.02 | x = 0.04 | x = 0.08 | x = 0.20 | x = 0.40 |
|---|---|---|---|---|---|
| α′H-Ca2−xSi0.88P0.12O4:xEu2+ | 34.73% | 36.01% | 21.27% | 8.70% | 10.12% |
| α-Ca2−xSi0.58P0.42O4:xEu2+ | 22.49% | 15.73% | 11.16% | 6.85% | 3.70% |
Conclusions
In summary, high-temperature crystalline α′H- and α-Ca2SiO4:Eu2+ phosphors were quenched at room temperature by incorporating suitable content of phosphorus ions and their photoluminescent properties were investigated in this work. Eu2+ doped α′H- and α-Ca2SiO4 high-temperature crystalline phase phosphors could be stabilized to room temperature with incorporation of 12% and 42% phosphorus ions, respectively, independent on the Eu2+ doping concentration. The variation of the Eu2+ luminescent centers between multi-Ca sites in both of α′H- and α-Ca2SiO4 lattices resulted by the increasing Eu2+ incorporation concentration was identified to be the reason for the tunable emissions from green to orange-red light. The quantum efficiency for α′H-Ca2−xSi0.88P0.12O4:xEu2+ and α-Ca2−xSi0.58P0.42O4:xEu2+ was found to be decrease with the increase of Eu2+ doping concentration owing to the concentration quenching effect. The excellent tuning characters for α′H-Ca2−xSi0.88P0.12O4:xEu2+ and α-Ca2−xSi0.58P0.42O4:xEu2+ phosphors presented in this work exhibited their various applications prospect in solid-state lighting combing with blue chip or near-UV chip.Acknowledgements
We gratefully acknowledge the financial support by the National Natural Science Foundation of China (no. 50872091 and 51102265) and Program of Discipline Leader of Colleges and Universities (Tianjin, China) and “Foreign Experts” Thousand Talents Program (Tianjin, China).Notes and references
- S. Tonzani, Nature, 2009, 459, 312–314 CrossRef CAS PubMed.
- S. Pimputkar, J. S. Speck, S. P. DenBaars and S. Nakamura, Nat. Photonics, 2009, 3, 179–181 CrossRef.
- H. A. Hoppe, Angew. Chem., Int. Ed., 2009, 48, 3572–3582 CrossRef PubMed.
- S. Ye, F. Xiao, Y. X. Pan, Y. Y. Ma and Q. Y. Zhang, Mater. Sci. Eng., R, 2010, 71, 1–34 CrossRef.
- C. C. Lin and R.-S. Liu, J. Phys. Chem. Lett., 2011, 2, 1268–1277 CrossRef CAS PubMed.
- C. Feldmann, T. Justel, C. R. Ronda and P. J. Schmidt, Adv. Funct. Mater., 2003, 13, 511–516 CrossRef CAS.
- X. X. Luo, W. H. Cao and F. Sun, Chin. Sci. Bull., 2008, 53, 2923–2930 CrossRef CAS.
- J. S. Kim, P. E. Jeon, J. C. Choi, H. L. Park, S. I. Mho and G. C. Kim, Appl. Phys. Lett., 2004, 84, 2931–2933 CrossRef CAS.
- H. S. Jang and D. Y. Jeon, Appl. Phys. Lett., 2007, 90, 041906 CrossRef.
- W. J. Yang, L. Y. Luo, T. M. Chen and N. S. Wang, Chem. Mater., 2005, 17, 3883–3888 CrossRef CAS.
- J. S. Kim, Y. H. Park, S. M. Kim, J. C. Choi and H. L. Park, Solid State Commun., 2005, 133, 445–448 CrossRef CAS.
- G. Blasse and W. L. Wanmaker, Philips Res. Rep., 1968, 23, 189–200 CAS.
- J. J. Liu, C. G. Duan, W. N. Mei, R. W. Smith and J. R. Hardy, J. Chem. Phys., 2002, 116, 3864–3869 CrossRef CAS.
- J. S. Kim, P. E. Jeon, J. C. Choi and H. L. Park, Solid State Commun., 2005, 133, 187–190 CrossRef CAS.
- Z. D. Hao, J. H. Zhang, X. Zhang, Y. S. Luo, L. G. Zhang and H. F. Zhao, J. Lumin., 2014, 152, 40–43 CrossRef CAS.
- Z. Y. Mao, Y. C. Zhu, Y. Wang and L. Gan, J. Mater. Sci., 2014, 49, 4439–4444 CrossRef CAS.
- H. S. Jang, H. Y. Kim, Y.-S. Kim, H. M. Lee and D. Y. Jeon, Opt. Express, 2012, 20, 2761–2771 CrossRef CAS PubMed.
- A. Kalaji, M. Mikami and A. K. Cheetham, Chem. Mater., 2014, 26, 3966–3975 CrossRef CAS.
- M. Chen, Z. Xia, M. S. Molokeev and Q. Liu, Inorg. Chem., 2015, 54, 11369–11376 CrossRef CAS PubMed.
- K. Li, M. M. Shang, H. Z. Lian and J. Lin, Inorg. Chem., 2015, 54, 7992–8002 CrossRef CAS PubMed.
- Z. J. Lu, Z. Y. Mao, J. J. Chen and D. J. Wang, Dalton Trans., 2015, 44, 15620–15627 RSC.
- Y. Sato, H. Kato, M. Kobayashi, T. Masaki, D.-H. Yoon and M. Kakihana, Angew. Chem., Int. Ed., 2014, 53, 7756–7759 CrossRef CAS PubMed.
- Z. Y. Mao, Z. J. Lu, J. J. Chen, B. D. Fahlman and D. J. Wang, J. Mater. Chem. C, 2015, 3, 9454–9460 RSC.
- W. W. Zi, T. J. Cui, H. Yu, L. L. Li, S. C. Gan and X. C. Xu, J. Rare Earths, 2013, 31, 871–877 CrossRef CAS.
- V. Rubio, M. A. de la Casa-Lillo, S. De Aza and P. N. De Aza, J. Am. Ceram. Soc., 2011, 94, 4459–4462 CrossRef CAS.
- I. M. Martinez, P. Velasquez and P. N. De Aza, J. Am. Ceram. Soc., 2012, 95, 1112–1117 CAS.
Footnote |
| † These authors contributed equally to this work and should be considered as co-first authors. |
| This journal is © The Royal Society of Chemistry 2016 |