Vertical records of sedimentary PAHs and their freely dissolved fractions in porewater profiles from the northern bays of Taihu Lake, Eastern China

Pei Leiab, Hong Zhang*a and Baoqing Shana
aState Key Laboratory of Environmental Aquatic Chemistry, Research Center for Eco-Environmental Sciences, Chinese Academy of Sciences, Beijing 100085, China. E-mail: hongzhang@rcees.ac.cn; Fax: +86 10 6292 9307; Tel: +86 10 6284 9307
bUniversity of Chinese Academy of Sciences, Beijing 100049, China

Received 29th April 2016 , Accepted 7th October 2016

First published on 10th October 2016


Abstract

Sedimentary records of 16 priority PAHs in sediment cores collected from the northern bays of Taihu Lake were analyzed to evaluate the influence of anthropogenic impacts on the sedimentary PAHs. Freely dissolved PAHs in the overlying water/porewater matrices were also detected to help understand the toxicity of PAHs. High levels and ecological risk of PAHs were distributed in the northern bays, especially in Zhushan Bay. The concentrations, accumulation flux and total toxic benzo[a]pyrene equivalent (TEQcarc) of PAHs in sediment cores from the northern bays began to dramatically increase in the 1980s, and subsequently decreased after the 2000s. A significantly positive linear correlation (R2 > 0.90, p < 0.01) was observed between sedimentary flux and social development in the region during the period of the 1980s–2000s, while this relationship turned to a negatively exponential one (R2 > 0.99, p < 0.05) in the most recent 10 years. The decrease of PAHs flux may be attributed to the switch from coal to cleaner energy and good effectiveness of taking mandatory measures to combat water pollution, indicating that anthropogenic activities remarkably affected the load of sedimentary PAHs in the Lake. The freely dissolved PAHs were present in higher levels in porewater than those in overlying water; such a concentration gradient implies a potential flux of PAHs from porewater to overlying water. Taking the chronic toxicity values as reference, the hazard index (HI) values of all overlying water and porewater samples from the northern bay of Taihu Lake do not excess 1, indicating no or low ecological risk in water from the northern bay of Taihu Lake.

1. Introduction

Due to their toxic and carcinogenic effects, 16 unsubstituted polycyclic aromatic hydrocarbons (PAHs) have been placed on the priority list by the U. S. EPA. These compounds may enter water bodies through several ways, such as direct/indirect discharge or atmospheric deposition, and then sediments in rivers or lakes are often identified as a major reservoir for PAHs.1 Therefore, the accumulation of PAHs in sediments from aquatic ecosystems is mostly linked to anthropogenic activities, especially in industrialized or urbanized areas.2,3 For instance, Liu et al. reported that the sedimentary load of PAHs was significantly intensified by the socioeconomic development in Chongqing City, Southwest China,4 and a close correlation between PAHs deposition fluxes and historical energy consumption was found in Lake Michigan, USA.5

With the implementation of the Reform and Open Policy since 1978, Eastern China has entered a rapid economic development period, resulting in increasing energy consumption and corresponding sedimentary PAHs.6–8 The Taihu Lake Basin, located in the Yangtze River Delta of Eastern China, has been characterized by fast industrialization and urbanization, and contributes more than 10% of China's GDP.9 Taihu Lake has multi-use functions, but also acts as a reservoir for contaminants discharged from nearby urban areas and industrial catchments. The rapidly growing economy of the surrounding cities, combined with a lack of technical measures and effective management, resulted in many serious environmental problems such as eutrophication, organic pollution and destruction of the aquatic ecosystem in the Lake.10

Several studies have been conducted on PAHs pollution in Taihu Lake, while most of them have focused on the spatial characteristics of their concentrations, sources and toxicological risk in surface sediments.11–13 In 2002, Liu et al. carried out research on sedimentary records of PAHs in the Lake, revealing that temporal PAHs concentrations and the regional GDP followed the same change trend.9 However, this relationship was only described qualitatively without further analysis, and the records were only updated to 2000. Normally, increasing socioeconomic development would bring out an accumulation of PAHs concentrations in sediments. However, a downward trend of PAHs concentration or flux was found after 1990s–2000s in some other regions of China.14,15 Then, it is worth to explore the “sedimentary record trend” of Taihu Lake (especially after the 2000s) between sedimentary pollution and socioeconomic development. Besides, many intensive actions have been taken since the 2000s and the water quality of the Lake has been improved to some extent in recent years.16 On these bases, we put forward the assumption that these control measures did actually affect the records of pollutants in sediments. Therefore, a further study on the temporal PAHs trend and the related influencing factors are needed to assess the anthropogenic impacts on the sedimentary PAHs.

In addition, supplying drinking water for large cities (such as Shanghai City and Wuxi City) is one of the most important functions of Taihu Lake.17 Then PAHs in the waters should be taken into consideration in order to protect the water resources and human health in this region. A previous study had reported on the spatial distribution of PAHs in waters in the Lake, showing that the total PAHs concentrations in the overlying water and porewater were more than ten thousands ng L−1 and the northern bays were the most polluted areas.18 While biological effects are related to the biologically available fraction rather than the total concentration, the freely dissolved PAHs in the waters will pose direct toxicity to the aquatic organisms.19,20 So, it is necessary to investigate the vertical records and to assess the toxicity of freely dissolved PAHs in sediment cores to achieve better environmental management.

The primary objectives of this work include the following: (a) investigating temporal trends of the PAHs concentrations, accumulation flux and total toxic benzo[a]pyrene equivalent (TEQcarc) in sediment cores from the northern bays of Taihu Lake; (b) assessing the impacts of anthropogenic activities on sedimentary PAHs and identifying the related factors by analysing the correlation between the regional PAHs sedimentary flux and socioeconomic development; (c) determining the concentrations of freely dissolved PAHs in porewater profiles and assessing their toxicity to understand the bioavailability and risk of PAHs in Taihu Lake.

2. Methods and materials

2.1 Sample collection and preparation

Three typical bays in Taihu Lake, including Zhushan Bay (ZS), Meiliang Bay (ML) and Gonghu Bay (GH), receive large amounts of untreated effluents from the industries in Changzhou City and Wuxi City, mainly via the Taige Canal, Zhihugang River and Wangyu River, respectively. They were selected as study areas, and the central part of the Lake (CL) was also taken into consideration for comparison purposes.

A total of 17 sediment cores from these three northern bays and the central lake of Taihu Lake were collected in November 2014, with sampling locations shown in Fig. 1. At each sites, sediment cores were collected using a sediment core sampler (Corer 60, Uwitec, Austria), with length of 60 cm and inner diameter of 6 cm. Each core was sliced into 2 cm segments, and then sediment samples were placed in foil bags on site. In addition, a duplicate core in each bay and the central lake was taken simultaneously to acquire porewater and corresponding overlying water (more details about the sediment cores are presented in Table S1). Within 48 h of sampling, overlying water was sucked out using a siphon, and the sediment slices (5 cm depth) were centrifuged to separate porewater from the sediment by high-speed centrifugation (4000 rpm, 30 min). Both overlying water and porewater samples were stored in the dark at 4 °C, and the remainder of sediment samples was frozen at −20 °C until further analysis.


image file: c6ra11180g-f1.tif
Fig. 1 Sampling sites in the northern bays and central lake of Taihu Lake.

2.2 Sediment dating

Two sediment cores for sediment dating were taken from locations in the northern bays and the central lake. The sediment accumulation rate (SAR) and linear sedimentation rate (LSR) were calculated from unsupported 210Pb profiles and physical properties to determine the deposition year of each layer. The method and procedure of sediment dating was presented in our previous publication.21 In summary, the 210Pb and 214Pb (daughter of 226Ra) activities of the dry sediment slices were detected at 46.5 keV and 352 keV, respectively, by using gamma spectrometry with high-purity germanium (HPGe) detectors (GSW1522, Canberra, France). The excessive 210Pb (210Pbexcess) activity was obtained by subtracting 226Ra activity from total 210Pb activity. The sediment accumulation rates were calculated by applying a constant rate of supply (CRS) dating model,22,23 excessive 210Pb (210Pbexcess) activity in the sediment cores are illustrated in Fig. S1 and the accumulation fluxes of ΣPAHs were calculated with the equation described in Table S2. Mean accumulation rates of the sediment cores from the northern bay and the central lake were 0.334 and 0.178 g cm−2 a−1, and the linear average sedimentation rate were 0.435 and 0.284 cm a−1, respectively (Table S2), and these were consistent with the previous reports (Table S3).

2.3 Sample extraction

Freeze-dried sediment samples were ground to pass through a 100 mesh sieve and homogenized. Surrogate standards (Naphthalene-d8, Acenaphthene-d10, Phenanthrene-d10, Chrysene-d12 and Perylene-d12) and activated copper powder were added into the sediment samples. Then samples were Soxhlet-extracted with a hexane–dichloromethane mixture (50/50, v/v). Each extract was condensed and solvent-exchanged to hexane. The hexane extract was cleaned up by an alumina/silica gel column. The PAHs fraction was concentrated to 200 μL volume for analysis.

The procedure of liquid sample extraction was described in detail elsewhere.18 Briefly, both overlying water and porewater were filtered by 0.45 μm glass fiber filters and then concentrated by solid phase extraction (SPE) with Sep-Pak C18 cartridges (6 cc, 500 mg, Waters). The cartridges were pre-conditioned by each 5 mL dichloromethane, methanol and distilled water in sequence. After loading of the water samples, the cartridges were eluted by 4 mL, 3 mL and 3 mL of dichloromethane sequentially. Each extract was processed by the same procedure as the extracts of sediment ones.

2.4 Instrumental analysis, quality control and assurance

16 priority PAHs, including naphthalene (Nap), acenaphthylene (Acy), acenaphthene (Ace), fluorene (Fluo), phenanthrene (Phe), anthracene (Ant), fluoranthene (Flua), pyrene (Pyr), benzo[a]anthracene (BaA), chrysene (Chry), benzo[b]-fluoranthene (BbF), benzo[k]fluoranthene (BkF), benzo-[a]pyrene (BaP), indeno[1,2,3-c,d]pyrene (IncdP), dibenz[a,h]-anthracene (DBA) and benzo[g,h,i]perylene (BghiP) (their physical and chemical properties are shown in Table S4), were quantified by a Clarus SQ 8 GC/MS (PerkinElmer, USA) equipped with a DB5-MS column (30 m × 0.25 mm diameter, 0.25 μm film thickness). High purity helium was used as the carrier gas with a constant-flow rate of 1.2 mL min−1. The temperatures of injector, ion source and transfer line were set at 280, 230 and 250 °C, respectively. The temperature program of the GC oven was set as follows: initially at 80 °C for 1 min, increased to 150 °C at 20 °C min−1, and held for 6 min, then increased to 250 °C at 10 °C min−1 and held for 12 min, finally increased to 290 °C at 30 °C min−1, and held for 6 min.

Quantification of samples was performed using an external standard method. The correlation coefficients for the seven concentration gradients of 16 PAHs ranged from 0.996 to 0.999. The PAHs in the blanks were not detected or were much lower than the detection limits of the method, which were 1.0–6.0 ng g−1 for sediment and 1.0–10 ng L−1 for water. Samples spiked with surrogate standards were also measured to estimate the repeatability and accuracy of the analytical method. The values of mean recoveries and the relative standard deviation of surrogates in the sediment and water matrixes were 77.9% ± 5.8% and 71.8% ± 3.5% (Naphthalene-d8), 85.3% ± 10.1% and 81.3% ± 8.5% (Acenaphthene-d10), 96.1% ± 6.8% and 94.0% ± 7.3% (Phenanthrene-d10), 88.7% ± 7.5%, 89.4% ± 10.8% (Chrysene-d12) 90.7% ± 5.5% and 88.9% ± 8.0% (Perylene-d12), respectively. The difference between duplicates of all target chemicals was less than 15%.

2.5 Determination of freely dissolved PAHs concentrations in overlying water and porewater

Dissolved organic carbon (DOC) in overlying water or porewater may enhance PAHs concentrations beyond values predicted by their solubility.24 Therefore, the “bounded effect” of DOC should be taken into consideration when determining freely dissolved PAHs in liquid samples.25 The measured PAHs include freely dissolved fractions and dissolved organic carbon (DOC) bound fractions. Concentrations of freely dissolved PAHs, Cfw, are expressed as:
 
Cfw = (1 + [DOC]KDOC)−1Cw (1)
where Cw (mg L−1) is the sum of both freely dissolved and colloid-bounded PAHs in water, [DOC] (mg L−1) is the concentration of DOC, and KDOC (L kg−1) is the colloidal organic carbon–water partition coefficient of PAHs. The percentage of freely dissolved PAHs was defined by Cfw/Cpw. In current study, DOC in liquid samples was measured by a TOC analyzer (TOC-VCPH, Shimadzu, Japan). The variability of the measurements was less than 5%. The concentrations of DOC at different depth of four sampling locations are shown in Table S5. For the dissolved organic carbon, we assumed KDOCKOC, where KOC is the organic carbon-normalized two phase distribution coefficient.26 KOC data were adopted from the previous report27 and shown in Table S4.

2.6 Assessment of sediment toxicity based on the total concentration of carcinogenic PAHs

BaP is the only PAH of which toxicological data is sufficient for derivation of a carcinogenic potency factor among all known potentially carcinogenic PAHs.28 Then, toxic equivalency factors (TEFcarc) were applied to quantify the carcinogenicity of other PAHs relative to BaP and to estimate BaP-equivalent doses.29 According to the recommendation of USEPA, the calculated TEFcarc of BaA, Chry, BbF, BkF, BaP, DBA and IncdP were 0.1, 0.001, 0.1, 0.01, 1, 1 and 0.1, respectively. Total toxic BaP equivalency factors (TEQcarc) of the seven carcinogenic PAHs in the sediment were calculated as:
 
TEQcarc = ΣCi × TEFcarci (2)
where Ci was the concentration of the carcinogenic PAH, TEFi was the toxic equivalence factor of the carcinogenic PAHs.

2.7 Toxicity of PAHs in porewater to aquatic organisms

PAHs in ambient water or porewater are considered to be much more toxic and biologically available than sedimentary PAHs to the aquatic organisms.30 Therefore, a hazard quotient was applied to assess the toxicity of PAHs in overlying water and porewater from the profiles. This index was based on the estimated concentration of each PAH in porewater was divided by its chronic toxicity value. Hazard quotients for all PAHs detected were summed to produce a hazard index (HI) for total PAHs as follow:
 
HQ = (PAH)sol/chronic value (3)
 
HI = ΣHQ (4)

The specific value of chronic toxicity for individual PAH were adopted from the report by Neff et al.31 and shown in Table S1. An HI value greater than 1 indicates that porewater contains concentrations of total PAHs in excess of its estimated chronic toxicity to aquatic organisms (Fig. 6).32

2.8 Statistical analysis

The descriptive statistics were conducted to acquire the features of the data using the SPSS Statistics 19.0 software. Two-tailed t test was used to compare the average concentrations between samples in present study and critical p value of 0.05 was taken to indicate significance. The data was plotted by Origin Pro 8.0. The relationships between PAHs accumulation flux and GPD at different periods were also determined by Origin Pro 8.0 with a linear fitting model and exponential fitting model, respectively. The map of the sediment cores sampling sites was produced using Arc GIS 10.0 program.

3. Results and discussion

3.1 Spatial characteristics of PAHs in surface sediments

The surface sediments generally represent the current status of sediment contamination. The total concentrations of ΣPAHs (sum of 16 PAHs) in all 17 surface sediment samples (<2 cm) from the northern bays and central lake of Taihu Lake showed wide variations, ranging from 430 (CL8) to 831 (ZS2) ng g−1 dry weight with the mean value of 572 ng g−1 (Fig. S2). Compared to other aquatic sediments, the PAH levels were close to the Dahuofang Reservoir (590 to 638 ng g−1) and Yalujiang River (112–877 ng g−1) in Northeast China,15,33 and Yellow River (84.6 to 620 ng g−1) in North China.34 Otherwise, these levels were lower than those in heavily industrialized area such as Liangtan River (1262 to 6251 ng g−1) in Southwest China and Pearl River (1434 to 10[thin space (1/6-em)]811 ng g−1) in South China.35

The highest average concentration of 760 ng g−1 among the northern bays was found in Zhushan Bay, which is one of the most polluted areas in Taihu Lake and there are two severely polluted rivers (Taige Canal and Hengtang River) carrying contaminants directly into the lake.36 It can be seen that PAHs concentrations were much higher in the northern bays than PAHs in the center part, probably due to PAHs in this area mainly originating from agriculture, domestic sewage and industry sources.18

The ΣPAHs concentrations in surface sediment from Meiliang Bay, which was highly contaminated by PAHs historically, showed a gradual decrease. The ΣPAHs in this bay ranged from 1207 to 4754 ng g−1 in 2003,12 354 to 765 ng g−1 in 2010.18 In this study, the ΣPAHs in Meiliang Bay (ML1 to ML3) ranged from 483 to 609 ng g−1, which were much lower than previous reports. This declining trend may be ascribed to the application of the “sediment-dredging project” and the National 11th/12th 5 year Plan for Water Pollution Control since 2006, which aim to remediate internal pollution and control sewage discharged from nearby urban areas around the lake.37–39

Toxic equivalency factors (TEFcarc) were applied to quantify the carcinogenicity of other PAHs relative to BaP and to estimate BaP-equivalent doses.29 Concentrations of the seven carcinogenic PAHs in surface sediments were converted to one toxic concentration with the corresponding TEFcarc, and then TEQcarc of the seven carcinogenic PAHs was calculated. Total TEQcarc of PAHs in surface sediments of these locations varied from 29.2 (CL8) to 76.1 ng TEQcarc g−1 (GH2) with an average of 41.58 ng TEQcarc g−1, which was close to that found in sediments of Vadsø Harbour (40–66 ng TEQcarc g−1), Jarfjord Harbour (19–35 ng TEQcarc g−1) and Korsfjord Harbour (18–60 ng TEQcarc g−1) in Norway,17 but much lower than those in sediments of Kaohsiung Harbor (1404–1964 ng TEQcarc g−1) at heavily industrial zone docks in Taiwan.40

The TEQcarc in surface sediments of Meiliang Bay and the central lake was both below 40 ng TEQcarc g−1. Although Gonghu Bay had a lower percentage of the carcinogenic PAHs, it had the highest TEQcarc value (51.8 ng TEQcarc g−1) (Fig. S3). There are several drinking water works in Gonghu Bay, supplying more than 2 million ton drinking water for the most developed city Wuxi and other cities in the vicinity.17 Therefore, PAHs in surface sediments of Gonghu Bay should be of concerned due to the toxicological risk in this area. Among the seven carcinogenic PAHs, contribution to the total TEQcarc in surface sediments decreased in the order: DBA (38.5%) > BbF (25.7%) > BaP (23.7%) > BaA (7.04%) > IncdP (2.68%) > BkF (2.27%) > Chry (0.06%). DBA and BaP derived from coal combustion posed high toxicological risk to the water of Taihu Lake.

3.2 Temporal trend of PAHs in sediment cores

All four sediment cores from the northern bays and the central part of Taihu Lake had similar temporal trends for the ΣPAHs concentrations. An initial increase was found from the background level to a maximum value at a specific depth, followed by a subsequent decrease up to the surface sediment (Fig. 2). The PAH level in the profile remained relatively constant (about 400 ng g−1) before the 1940s, and started to increase and reached the first peak in the early 1960s. During this period, the ΣPAHs concentrations of Zhushan Bay and Gonghu Bay increased by more than 50% compared to the level in the 1940s. Starting in the early 1980s, the ΣPAHs concentrations revealed a sharp increase, and all four sediment cores yielded the maximum value of the whole core in the 1990s. Then, a steady decrease of the ΣPAHs concentrations was observed after the 2000s.
image file: c6ra11180g-f2.tif
Fig. 2 Temporal trends of ΣPAHs concentrations, accumulation flux in sediment cores.

The profile of PAHs accumulation flux largely resembles the historical ΣPAHs concentrations. The ΣPAHs flux remained relatively constant (about 40 ng cm−2 a−1) during the period between the 1900s and 1940s, and started to increase in the following four decades (1940–1980). An abrupt increase was apparent after the early 1980s for all three locations in the northern bays, leading to a maximum value (as much as 600 ng cm−2 a−1) in the 1990s. Subsequently the flux decreased after 2000 and showed some fluctuation of the temporal trend in recent years. Between the 1980s and 2010s, a constant increasing rate of 2.4 ng cm−2 a−1 in the central lake was recorded.

The total TEQcarc values started to increase starting in the early 1980s and reached a maximum value (about 40 ng TEQcarc g−1 in the northern bays) between the 1990s and 2000s. Then the value showed a downward trend in the most recent 10 years and maintained a constant range of 20 to 25 ng TEQcarc g−1 (Fig. 3). The historical profile of BaP, the representative PAH among all known potentially carcinogenic PAHs, showed an increase beginning in the 1990s. This trend was especially obvious in the sediment cores of Zhushan Bay and Gonghu Bay. The sediment cores in the northern bays, especially for Zhushan Bay, had significantly higher ΣPAHs concentrations (p < 0.05) and flux (p < 0.05) in the same period than the one in the central lake. This variation reflects the influence of anthropogenic activity on sedimentary PAHs.9 The northern bays, especially Zhushan Bay, were one of the most polluted areas in Taihu Lake, where there are several severely polluted rivers carrying contaminants directly in to the lake. High contents of dissolved organic carbon and suspended particulate matter were contained in the wastewater, and it contributed both dissolved and suspended particulate matter-associated PAH to the aquatic environment.41 The high sedimentary PAHs levels in this bay also mainly originated from domestic sewage and industry sources.42 In contrast, the central lake, a broader field of open water (about 589 km2), which provide a strong hydrological mixing due to wind-wave action and consequently increases a better dilution of pollutants discharged from the input rivers. A large quantity of natural weathered detritus as well as wastes discharged from nearby urban areas and industrial sites along the river are transported into lake. These particles from the runoff deposit in the bays of the Lake, and the central lake was also less affected by direct anthropogenic activities. Therefore, the central lake contains lower levels of contaminants in sediments than the bays.


image file: c6ra11180g-f3.tif
Fig. 3 Temporal trends of total toxic BaP equivalent (TEQcarc) concentrations for all seven carcinogenic PAHs.

3.3 Anthropogenic impacts on the sedimentary PAHs

In this study, the vertical profiles of PAHs accumulation flux closely followed the historical economic data (GDP) of the surrounding cities. Here, Wuxi City was taken as an example to assess the influence of economic development and anthropogenic impacts on the sedimentary PAHs in Gonghu Bay (the sediment core from Zhushan bay had an analogous trend during different historic period and the results are presented in Fig. S4). As shown in Fig. 4, the sedimentary records could be divided into four stages with distinct features. I: before the 1940s, II: 1940s–1980s. The ΣPAHs concentration and flux in sediment core (GH) was relatively low and had slight fluctuations during this period. The first Five-Year-Plan (1951–1955) may contribute to the notable PAHs flux peaks in the sediment core in the 1950s. In the 1960s and 1970s, the ΣPAHs flux decreased, which was coincident with the Great Proletarian (1958–1960) and the Cultural Revolution (1966–1976) periods, led to drastic declines in the industrial and agricultural production and consequently decreased the PAHs flux in the sediments.43
image file: c6ra11180g-f4.tif
Fig. 4 Correlation between accumulation fluxes of ΣPAHs in the sediment core with the economic indicators. (a) Trends of accumulation fluxes of ΣPAHs in sediment core from Gonghu bay (GH). The sedimentary records was divided into four stages (I–IV) with distinct features. The GDP data of Wuxi City were obtained from the 2011 Statistical Yearbook of Wuxi City (from 1950s to 2010s) (Wuxi Municipal Bureau of Statistics, 2012). (b) The inserted figure, showed the concentration changes in chemical oxygen demand (CODMn), total nitrogen (TN), and total phosphorous (TP) in Taihu Lake since 1981. This figure was modified from the previous report.16 The original data were based on the observations by the Jiangsu Monitoring Station for Water Quality of Lake Taihu. Data for TN and TP before 1987 were not available. (c) A linear fitting between the total PAHs flux and GDP during 1980s–2000s. (d) A negatively exponential correlation between the ΣPAHs flux and GDP after 2000s. (e) and (f) data for rural population, energy consumption amount and structure of Wuxi City were not available, so Jiangsu Province's index was used instead, which can be obtained online (“the database of China social and economic development”, http://tongji.cnki.net/kns55/index.aspx).

III: 1980s–2000s. A significantly positive linear correlation (R2 > 0.90, p < 0.01) exists between the total PAHs flux and GDP, probably indicating that local socioeconomic development remarkably aggravated the sedimentary PAHs. After implementation of the Reform and Open Policy in the late 1970s, the Taihu Lake Basin experienced rapid economic development, resulting in increasing energy consumption and PAHs emissions.44 Coincident with the rapid economic development in the region, ΣPAHs concentrations increased from 600 ng g−1 in 1980 to 817 in 1994, at a rate of 21 ng cm−2 a−1 during the period. And the causation and contribution of the factors controlling or influencing the PAH flux need to be identified in further study.

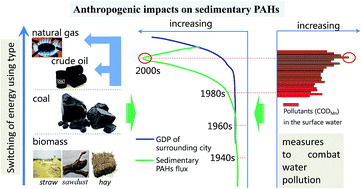
IV: after the 2000s. Unlike the previous 20 years, an inflection with a negatively exponential correlation (R2 > 0.99, p < 0.05) was found between the ΣPAHs flux and GDP. GDP still showed a great rate of increase while the flux had a significantly steady decrease in the most recent 10 years. The decline trend is quite different from some other regions of China in previous reports,4,44 but similar to many other places around the world, such as the Yellow Sea in China,14 a reservoir at Osaka City in Japan,45 Lake Michigan in the United States5 and mountain lakes in Europe.46 Here, one important factor is the change of energy consumption structure in China since 1990s, switching from coal into cleaner energy. As showed in Fig. 4, a decreasing proportion of coal consumption (from 80% to 70%) and increasing proportion of natural gas consumption in Jiangsu Province (from less than 0.5% to 4%) were found since the 1990s. In addition, the historical proportion of rural population experienced a large decrease (from 80% to 45%) during the same periods, which probably also was a factor in the recent decline of the ΣPAHs flux.

Notably, both the ΣPAHs flux and water quality (especially for CODMn and TP) showed a consistent trend and simultaneously had a “turning point” in the 2000s (Fig. 4). Aware of the seriousness of the deterioration of water quality and other eco-environmental issues that occurred in Taihu Lake, the Chinese government has targeted mandatory measures to combat water pollution, such as controlling point/non-point pollution sources and transferring water from the Yangtze River to the Lake.16 Owing to these extensive efforts, concentrations of CODMn and TP in the Lake have steadily declined since the 2000s. The decline of PAHs flux in recent years was coincident with these efforts at controlling pollution input from land-based source, which can effectively reduce the sedimentation rate (Table S2) of the surface sediments and the degree of sedimentary pollution. Though the eco-environmental problem of the lake has not been solved at its roots, the situation has been improved in the most recent 10 years. So the decline trend of PAHs flux indicated good effectiveness in controlling sedimentary PAHs.

Of course, Taihu Lake, a typically shallow lake, frequently undergoes strong changes in both hydraulic and physical–chemical conditions due to wind-wave action, and the decline trend in the surface sediments would probably be weaken by the factors likes the physical mixing, resuspension and bioturbation. These processes need further study within more high-resolution methods (better tracer or dating) to understand the fate of PAHs in the sediment cores and support better environmental management.

3.4 Concentrations and toxicity of freely dissolved PAHs in overlying water and porewater profiles

Freely dissolved PAHs in surface porewater ranged from 1095 to 1956 ng L−1 with a mean value of 1606 ng L−1, which is 4 to 10 times higher than that in overlying water, indicating a positive flux of PAHs from porewater to overlying water. The maximum freely dissolved PAHs concentrations in porewater occurred at 10 or 15 cm depth, which corresponded to the sedimentary PAHs concentrations maximum at the same depth (Fig. 2). According to the number of aromatic rings, 2- and 3-rings compounds dominated the PAHs distribution both in overlying water and porewater, with average proportion of 46% and 39% of the total freely dissolved PAHs, respectively (Fig. 5).
image file: c6ra11180g-f5.tif
Fig. 5 Profiles of concentrations and percentages of freely dissolved PAHs in overlying water (OW) and porewater (the dashed lines represent the sediment–water interface).

image file: c6ra11180g-f6.tif
Fig. 6 The hazard index (HI) values PAHs for toxic-response factor in porewater profiles. The dashed line represents the sediment–water interface. An HI value greater than 1 indicates that porewater contains concentrations of total PAHs in excess of its estimated chronic toxicity to aquatic organisms.32

PAHs are typical kind of HOCs, which have high Kow values and low aqueous solubilities. The presence of dissolved organic colloids enhances the aqueous concentrations of PAHs beyond their solubilities significantly.47 The percentages of freely dissolved PAHs in overlying water ranged from 82% to 89%, while these values declined slowly downward in the range of 53% to 60% with increased depth in porewater (Fig. 5). Compared to the central lake, the percentages of freely dissolved PAHs both in overlying water and porewater from the central lake were higher than those from the northern bays.

In sediment/porewater systems, PAHs are distributed mainly among the three phases: the truly dissolved phase, the DOC in porewater, and the solid sediment.48 The partition process of PAHs between the three phases described above may result in different patterns of PAHs distribution in them partly due to different DOC properties in porewaters.49 Regarding spatial variations, the percentages of freely dissolved PAHs both in overlying water and porewater from the central lake (CL) were higher than those in the locations from the northern bays. Compared to the central lake, these heavily polluted bays contained more organic matters and “trapped” more PAHs in overlying water and porewater.50

As for individual compounds, analogous characteristics in terms of dissolved PAHs percentage were found both in overlying water and porewater. The “solubility” of PAHs decreased as the Kow values increased. For example, the percentage of freely dissolved 2- and 3-rings PAHs in overlying water and surface porewater were all over 60%, especially for NaP, the percentage reached more than 98% (Fig. S5). By contrast for the large ring number (5–6 rings), which are nonpolar and have a high Kow value, the percentage of the freely dissolved fraction was less than 10%. This indicated that individual compounds in the aqueous phase had different DOC-bounded capacities, which resulted in great variations in the mobility and bioavailability of individual PAH compounds. Pyrogenic PAHs appear to be unavailable to partition into the water column and porewater, or combustion-generated PAHs appear to be less bioavailable than petroleum-derived PAHs.51

Taking the chronic toxicity values as reference, the HI values ranged from 0.004 to 0.013, with an average of 0.007 in overlying water of four sites, which were greater than their corresponding overlying water. In porewater, average of this value was 0.233, and the vertical trends increased downward with increased depth and showed some fluctuation (Fig. 5). The HI values of all overlying water and porewater samples from the northern bay of Taihu Lake do not excess 1, indicating no or low ecological risk in water from the northern bay of Taihu Lake. The highest HI value (0.723) in porewater of sediments was found at CL, which was far more above the values at three northern bays. However, this result was quite different from the concentrations of sedimentary PAHs in sediment cores (Fig. 2). This seeming contradiction indicated that a relatively high total concentration of PAHs in polluted sediment may does not cause a serious situation, while higher concentrations of freely dissolved PAHs in porewater could have potential risk. According to our findings, the toxicity of freely dissolved PAHs in porewater corresponded well to their concentrations in the profiles. Physical, chemical or even biological factors (e.g. hydrological conditions, redox condition, and the mineralization process of organic matter) would significantly influence the concentrations, bioavailability and toxicity of PAHs in porewater. Therefore, a comprehensive investigation that includes both risk in sediments and toxicity of bioavailable fraction in porewater are recommended when assessing the risk of PAHs in aquatic environments.

Based on the chronic toxicity values, all of the HI values in samples of Taihu Lake were less than 1, these finding concluded that PAHs in overlying water and porewater should have no impairment to aquatic organisms. The highest HI value of only 16 priority PAHs had reached over 0.7. However, high concentrations of heavy metals and other organic pollutants have been reported in Taihu Lake in recent years.52,53 In this situation, the HI values would be substantially greater than 1 and sediments may be toxic to the benthic fauna or even human health when studying the ecological effect of the combined pollution in this region. Therefore, the comprehensive effects of metallic and organic contamination need to be considered when taking more accurate assessment of safety in Taihu Lake.

4. Conclusions

This work has provided important data on 16 priority PAHs in sediment-water systems from the northern bays and central lake of Taihu Lake. High levels of PAHs were distributed in the northern bays, especially in Zhushan Bay, while low levels of PAHs were found in the central lake. The sedimentary concentrations, flux and risk of PAHs in sediment cores began to dramatically increase in the 1980s in the northern bays, and subsequently decreased after the 2000s. A significantly positive linear correlation was found between the total PAHs flux and GDP during the period of the 1980s–2000s, while this relationship became a negatively exponential one in the last 10 years, indicating that local socioeconomic development remarkably influenced the load of sedimentary PAHs in the Lake. The decline of rural population, increasing proportional use of cleaner energy (such as natural gas) instead of coal combustion, and taking mandatory measures to combat water pollution may be the most reasonable explanations for the decrease of PAHs flux. This decline in recent years also showed good effectiveness in controlling sedimentary PAHs. The sediments in the northern bays act as a pollution source of freely dissolved PAHs. All of the hazard index (HI) values in the samples were less than 1, indicating no or low ecological risk in overlying water and porewater from the northern bays of Taihu Lake.

Acknowledgements

This work was financed by the National Natural Science Foundation of China (No. 21547009) and the Major Science and Technology Program for Water Pollution Control and Treatment (2012ZX07101-002-03). We gratefully acknowledge our colleague Xuehong Kong, Bozhen Zhang and Xin Meng for helping to take sediment cores and pre-treating samples. And we also thank Dr Chao Wang, Dr Wenzhong Tang and anonymous reviewers for their invaluable comments and suggestions.

References

  1. B. Vandecasteele, P. Quataert, B. D. Vos and F. M. G. Tack, Arch. Environ. Contam. Toxicol., 2004, 47, 14–22 CrossRef CAS PubMed.
  2. C. Ren, Y. Wu, S. Zhang, L. L. Wu, X. G. Liang, T. H. Chen, C. Z. Zhu, S. O. Sojinu and J. Z. Wang, Environ. Sci. Pollut. Res., 2015, 22, 1687–1696 CrossRef CAS PubMed.
  3. D. Q. Wang, Y. X. Yu, X. Y. Zhang, S. H. Zhang, Y. P. Pang, X. L. Zhang, Z. Q. Yu, M. H. Wu and J. M. Fu, Ecotoxicol. Environ. Saf., 2012, 82, 63–70 CrossRef CAS PubMed.
  4. Y. Liu, N. Yu, Z. Li, Y. P. Wei, L. M. Ma and J. F. Zhao, Chemosphere, 2012, 89, 893–899 CrossRef CAS PubMed.
  5. M. F. Simcik, S. J. Eisenreich, K. A. Golden, S. P. Liu, E. Lipiatou, D. L. Swackhamer and D. T. Long, Environ. Sci. Technol., 1996, 30, 3039–3046 CrossRef CAS.
  6. H. Vennemo, K. Aunan, H. Lindhjem and H. M. Seip, Rev. Environ. Econ. Pol., 2009, 3, 209–230 CrossRef.
  7. S. Xu, W. Liu and S. Tao, Environ. Sci. Technol., 2006, 40, 702–708 CrossRef CAS PubMed.
  8. R. Zhang, F. Zhang and T. C. Zhang, Sci. Total Environ., 2013, 450–451, 280–288 CrossRef CAS PubMed.
  9. G. Liu, G. Zhang, Z. Jin and J. Li, Environ. Pollut., 2009, 157, 2994–3000 CrossRef CAS PubMed.
  10. B. Q. Qin, P. Z. Xu, Q. L. Wu, L. C. Lian and Y. L. Zhang, Hydrobiologia, 2007, 581, 3–14 CrossRef CAS.
  11. G. H. Guo, F. C. Wu, H. P. He, R. Q. Zhang, C. L. Feng, H. X. Li and M. Chang, Environ. Monit. Assess., 2012, 184, 6815–6825 CrossRef CAS PubMed.
  12. M. Qiao, C. X. Wang, S. B. Huang, D. H. Wang and Z. J. Wang, Environ. Int., 2006, 32, 28–33 CrossRef CAS PubMed.
  13. Y. Zhang, C. S. Guo, J. Xu, Y. Z. Tian, G. L. Shi and Y. C. Feng, Water Res., 2012, 46, 3065–3073 CrossRef CAS PubMed.
  14. L. Y. Liu, J. Z. Wang, G. L. Wei, Y. F. Guan, C. S. Wong and E. Y. Zeng, Environ. Sci. Technol., 2012, 46, 6497–6504 CrossRef CAS PubMed.
  15. T. Lin, Y. W. Qin, B. H. Zheng, Y. Y. Li, L. Zhang and Z. G. Guo, Environ. Pollut., 2012, 163, 256–260 CrossRef CAS PubMed.
  16. Q. G. Wang, G. Gu and Y. Higano, Environ. Manage., 2006, 37, 579–588 CrossRef PubMed.
  17. Y. Q. Tao, S. C. Yao, B. Xue, J. C. Deng, X. L. Wang and M. H. Feng, J. Environ. Monit., 2010, 12, 2282–2289 RSC.
  18. Y. Zhang, Y. Lu, J. Xu and W. Zhao, Bull. Environ. Contam. Toxicol., 2011, 87, 80–85 CrossRef CAS PubMed.
  19. J. Harmsen, J. Environ. Qual., 2007, 36, 1420–1428 CrossRef CAS PubMed.
  20. S. B. Hawthorne, C. B. Grabanski, D. J. Miller and J. P. Kreitinger, Environ. Sci. Technol., 2005, 39, 2795–2803 CrossRef CAS PubMed.
  21. Z. Z. Di, H. Zhang and B. Q. Shan, Environ. Earth Sci., 2015, 74, 3935–3944 CrossRef CAS.
  22. P. G. Appleby, Tracking environmental change using lake sediments, Springer, Netherlands, 2002, pp. 171–203 Search PubMed.
  23. J. Sanchez-Cabeza, I. Ani-Ragolta and P. Masque, Limnol. Oceanogr., 2000, 45, 990–995 CrossRef CAS.
  24. G. Witt, C. Bartsch, G. A. Liehr, R. Thiele and M. S. McLachlan, J. Soils Sediments, 2010, 10, 1388–1400 CrossRef CAS.
  25. L. A. Fernandez, J. K. MacFarlane, A. P. Tcaciuc and P. M. Gschwend, Environ. Sci. Technol., 2009, 43, 1430–1436 CrossRef CAS PubMed.
  26. S. Mitra and R. M. Dickhut, Environ. Toxicol. Chem., 1999, 18, 1144–1148 CrossRef CAS.
  27. S. B. Hawthorne, C. B. Grabanski and D. J. Miller, Environ. Toxicol. Chem., 2006, 25, 2901–2911 CrossRef CAS PubMed.
  28. C. A. Peters, C. D. Knightes and D. G. Brown, Environ. Sci. Technol., 1999, 33, 4499–4507 CrossRef CAS.
  29. M. Nadal, M. Schuhmacher and J. L. Domingo, Environ. Pollut., 2004, 132, 1–11 CrossRef CAS PubMed.
  30. Ö. Gustafsson, P. M. Gschwend and K. O. Buesseler, Mar. Chem., 1997, 57, 11–23 CrossRef.
  31. J. M. Neff, S. A. Stout and D. G. Gunster, Integr. Environ. Assess. Manage., 2005, 1, 22–33 CrossRef CAS.
  32. R. J. Ozretich, S. P. Ferraro, J. O. Lamberson and F. A. Cole, Environ. Toxicol. Chem., 2000, 19, 2378–2389 CrossRef CAS.
  33. Y. Wu, J. Zhang and Z. Zhu, Mar. Pollut. Bull., 2003, 46, 619–625 CrossRef CAS PubMed.
  34. Y. M. Hui, M. H. Zheng, T. L. Zheng, Z. T. Liu and L. Gao, J. Environ. Sci., 2009, 21, 1625–1631 CrossRef CAS.
  35. B. X. Maia, J. M. Fu, G. Y. Sheng, Y. H. Kang, Z. Lin, G. Zhang, Y. S. Min and E. Y. Zeng, Environ. Pollut., 2012, 117, 457–474 CrossRef.
  36. W. C. Qu, D. Mike, C. X. Fan, S. M. Wang, C. W. Su, L. Zhang and H. X. Zou, Hydrobiologia, 2002, 485, 163–171 CrossRef CAS.
  37. W. Liu and R. Qiu, J. Chem. Technol. Biotechnol., 2007, 82, 781–786 CrossRef CAS.
  38. C. Le, Y. Zha, Y. Li, D. Sun, H. Lu and B. Yin, Environ. Manage., 2010, 45, 662–668 CrossRef CAS PubMed.
  39. H. W. Paerla, H. Xu, M. J. McCarthy, G. W. Zhu, B. Q. Qin, Y. P. Li and W. S. Gardnerd, Water Res., 2011, 45, 1973–1983 CrossRef PubMed.
  40. C. W. Chen and C. F. Chen, Mar. Pollut. Bull., 2011, 63, 417–423 CrossRef CAS PubMed.
  41. W. X. Qi, H. J. Liu, B. Pernet-Coudrier and J. H. Qu, Environ. Sci. Pollut. Res., 2013, 20, 4254–4260 CrossRef CAS PubMed.
  42. J. Luo, Y. Pang, Y. Lin and S. Luo, J. Hohai Univ., Nat. Sci., 2005, 33, 131–153 CAS , in Chinese.
  43. G. Q. Liu, G. Zhang, X. D. Li, J. Li, X. Z. Peng and S. H. Qi, Mar. Pollut. Bull., 2005, 51, 912–921 CrossRef CAS PubMed.
  44. J. Xua, J. Y. Guo, G. R. Liu, G. L. Shi, C. S. Guo, Y. Zhang and Y. C. Feng, Sci. Total Environ., 2014, 470, 519–526 CrossRef PubMed.
  45. M. Ishitake, H. Moriwaki, K. Katahira, O. Yamamoto, K. Tsuruho, H. Yamazaki and S. Yoshikawa, Environ. Geol., 2007, 52, 123–129 CrossRef CAS.
  46. P. Fernandez, R. M. Vilanova, C. Martinez, P. Appleby and J. O. Grimalt, Environ. Sci. Technol., 2000, 34, 1906–1913 CrossRef CAS.
  47. K. Nam and M. Alexander, Environ. Sci. Technol., 1998, 32, 71–74 CrossRef CAS.
  48. W. J. Hegeman, D. W. Van and J. G. Loch, Environ. Sci. Technol., 1995, 29, 363–371 CrossRef CAS PubMed.
  49. P. Lassen and L. Carlsen, Chemosphere, 1997, 34, 817–825 CrossRef CAS.
  50. J. P. Gao, J. Maguhn, P. Spitzauer and A. Kettrupab, Int. J. Environ. Anal. Chem., 1998, 69, 227–242 CrossRef CAS.
  51. K. A. Maruya, R. W. Risebrough and A. J. Horne, Environ. Sci. Technol., 1996, 30, 2942–2947 CrossRef CAS.
  52. G. H. Lu, Y. Ji, H. Z. Zhang, H. Wu, J. Qin and C. Wang, Chemosphere, 2010, 79, 588–594 CrossRef CAS PubMed.
  53. Y. Tao, Y. Zhang, X. N. Hu and W. Meng, Ecotoxicol. Environ. Saf., 2012, 81, 55–64 CrossRef CAS PubMed.

Footnote

Electronic supplementary information (ESI) available. See DOI: 10.1039/c6ra11180g

This journal is © The Royal Society of Chemistry 2016
Click here to see how this site uses Cookies. View our privacy policy here.