
Three dimensional iron oxide/graphene aerogel hybrids as all-solid-state flexible supercapacitor electrodes†
Abdul Muqsit Khattak,
Huajie Yin,
Zahid Ali Ghazi,
Bin Liang,
Azhar Iqbal,
Niaz Ali Khan,
Yan Gao,
Lianshan Li* and
Zhiyong Tang*
CAS Key Laboratory of Nanosystem and Hierarchy Fabrication, National Center for Nanoscience and Technology, Beijing 100190, P. R. China. E-mail: lils@nanoctr.cn; zytang@nanoctr.cn
First published on 13th June 2016
Abstract
Three dimensional (3D) iron oxide (Fe2O3)/graphene aerogel (GA) hybrid (Fe2O3/GA) was synthesized by a novel in situ hydrothermal method. Due to the high surface area and sponge structure of GA, which facilitate the access of electrolyte to the internal surface of the graphene film, this 3D Fe2O3/GA composite consequently lead to a robust and superior hybrid material with higher capacitance and better rate performance compared to that of the stacked Fe2O3/graphene (Fe2O3/G) hybrid when used as electrode materials in supercapacitors (SCs). Furthermore, a highly flexible all-solid-state symmetric supercapacitor device was fabricated by two pieces of our Fe2O3/GA hybrid electrode. The device is suitable for different bending angles and delivers a high specific capacitance of 440 F g−1. 90% capacitance was retained over 2200 cycles, indicating good cycling stability. These excellent electrochemical performances suggest that Fe2O3/GA composites have an enormous potential in energy application.
Introduction
Due to their significant advantages of high power density, high rate capacity and long cycling life, supercapacitors play an important role ranging from portable electronics to hybrid electric vehicles, and other high power energy sources.1 With the growing demand for portable and wearable energy storage systems, flexible supercapacitors are gaining more and more interest.1c,2 Recently, graphene, due to its unique mechanical strength, chemical stability, high conductivity and theoretical specific surface area as well as low fabrication cost, has emerged as an ideal candidate for flexible electrochemical energy storage devices.3 Much effort has been focused on designing graphene into various flexible structures, such as graphene paper,4 graphene gel,5 transparent electrodes,6 and so on. However, because of the aggregating nature of graphene due to strong π–π interactions, the large surface area cannot be fully utilized, especially at a high charge–discharge rate. To overcome the overstacking problems of graphene sheets and obtain high rate performance in supercapacitors, various three-dimensional (3D) graphene bulk materials have been developed. Generally, 3D graphene is a structure which contains interconnected pores that prevent the restacking of graphene sheets. For instance, Cheng and co-workers7 reported graphene networks produced by chemical vapour deposition (CVD) and template method and Shi and co-workers8 prepared a self-assembled graphene hydrogel by a hydrothermal method. However, when being used as an electrode material for supercapacitors, the capacitance of graphene is relatively low (around 100 to 200 F g−1) because it mainly stores energy through the electric double-layer capacitor (EDLC) mechanism.9 Thus, preventing the self stacking of graphene and combining graphene with redox materials, which can take both advantages of EDLC from graphene and faradic pseudocapacitance from redox materials remain important scientific challenges.Transition metal oxide is a category of pseudocapacitance materials based on the redox pseudo capacitive (i.e. faradic) charge storage process. Several transition metal oxide materials including Fe2O3,10 MnO2,11 WO3/MoO3,12 Co3O4,13 and their composites14 have been extensively investigated as electrode materials. Among those, Fe2O3 is recognized a good candidate because of its natural abundance, low cost, environmental friendliness and high theoretical specific capacity (1005 mA h g−1).15 However, low conductive nature and strong agglomeration of the Fe2O3 particles during the charge and discharge processes result in rapid capacity loss.16 To overcome these problems, conducting carbon matrices like 2D and 3D graphene sheets have been used to provide structural stability and high conductivity.17 For example, Lee et al.18 reported a novel nanocomposite with α-Fe2O3 nanotubes anchored on reduced graphene oxide displaying a high specific capacitance of 216 F g−1, attributed to short ion diffusion length and improved electrical conductivity. Similarly Yang et al.19 reported novel α-Fe2O3 mesocrystals/graphene nanohybrid and porous α-Fe2O3/graphene exhibiting high specific capacitance of 306 F g−1 and 343 F g−1, respectively. Although the combination of graphene and iron oxide is effective processing protocol to improve the electrochemical performances, weak interaction between Fe2O3 and graphene lead to severe restacking of graphene sheets and subsequent agglomeration of Fe2O3 particles during charge/discharge. To the best of our knowledge, a study of Fe2O3 particles supported on 3D graphene aerogel for flexible all-solid-state SC has not been reported to date.
Here, we combine 3D GA and Fe2O3 nanoparticles (NPs) to fabricate a composite supercapacitor electrode. Fe2O3/G nanocomposites were simultaneously synthesized for comparison. Compared with the Fe2O3/G nanocomposite, the produced Fe2O3/GA hybrid material exhibits higher specific capacitance (440 F g−1 at 0.45 A g−1), better rate performance and long-term cycling stability due to the porous nature of graphene aerogel which can help increasing electrical conductivity and surface area of the composite electrodes. In addition, we also made the all-solid-state symmetric supercapacitor by assembling two pieces of as-made Fe2O3/GA electrodes. The fabricated supercapacitor exhibit an outstanding electrochemical performance with specific capacitance of 311 F g−1 at a current density of 3 A g−1 when bent to 90 degree. The device demonstrates good flexibility and shows high capacitance retention of 89% after 2200 cycles.
Experimental
Synthetic procedures
The synthetic route of Fe2O3/GA is schematically illustrated and explained in our previous work.20 Graphite oxide was obtained from the natural flake graphite through a modified Hummers' method.21 The as-prepared graphite oxide was fully washed by ultrapure water, followed by sonicating for 60 min to obtain aqueous GO dispersion. To synthesize Fe2O3/GA hybrid, aqueous GO dispersion (20 mL, 3 mg mL−1) and FeCl2·4H2O solution (10 mL, 0.3 M) were mixed first, followed by adding NH3·H2O solution (50 μL, 28 wt%). After mixing, the Fe2+ ions were absorbed through electrostatic interactions or coordination on surface oxygen containing groups (Fig. 1). The mixture was then sealed in a Teflon-lined stainless-steel autoclave, subsequently heating the mixture at 180 °C for 12 h to give rise to the nucleation sites of tiny Fe2O3 NPs. Further reduction of GO sheets leads to self-assembled hydrogel structure with simultaneously grown Fe2O3 NPs. After the as-prepared hydrogel was freeze dried, the Fe2O3/GA hybrid was obtained. For comparison, Fe2O3/G nanocomposites were synthesized hydrothermally. In detail an aqueous solution (10 mL) of FeCl3·6H2O (0.6 mmol) was added into an aqueous suspension of GO (40 mL). After continuous stirring for 2 h, 10 mL of NaOH (1.2 mmol) aqueous solution was added into the above mixture. Finally, the mixture was sealed in a Teflon-lined stainless steel autoclave for hydrothermal reaction at 180 °C for 12 h. The final product was washed several time with water and ethanol, and then dried at 80 °C for 12 h.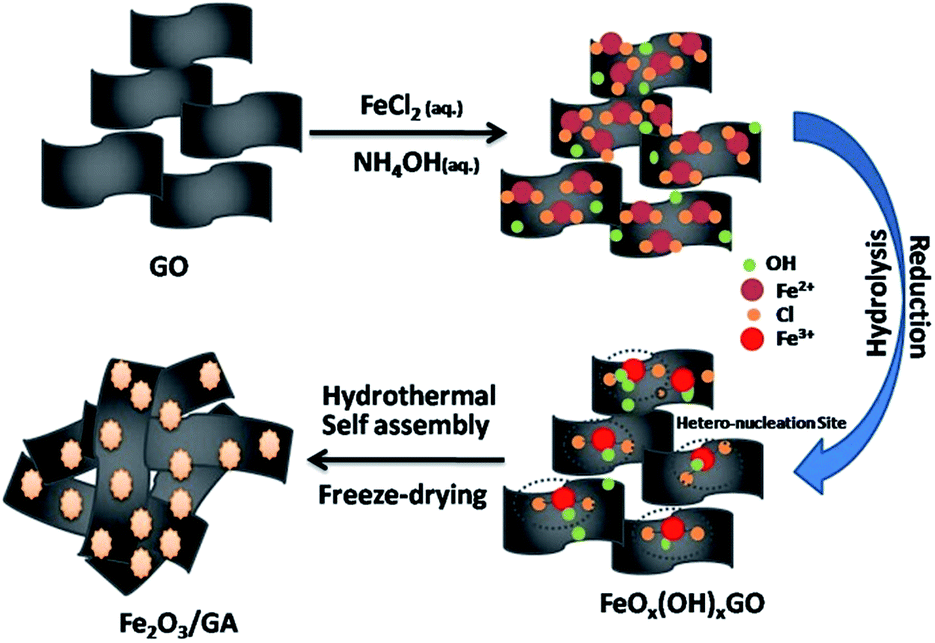 | ||
| Fig. 1 Schematic representation of Fe2O3/GA composite formation process by in situ growth method. | ||
Materials
Graphite (CP grade, ≤300 mesh) and activated carbon (CP grade) were purchased from Sinopharm Chemical Reagent. FeCl2·4H2O and NH4OH (28 wt%, AR grade) were bought from Longxi Chemical Reagent.Characterization
Surface morphology and energy dispersive X-ray spectroscopy (EDS) element mappings of the material were obtained under a Hitachi S4800 scanning electron microscopy (SEM). Transmission electron microscope (TEM) images were obtained on a FEI Tecnai G2 F20 electron microscope operated at 200 kV. Powder X-ray diffraction (XRD) patterns were recorded on a Pananlytical X'Pert-pro MPD X-ray power diffractometer by using Cu kα radiation (λ = 0.154056 nm). Thermogravimetric analyzer (TGA, TA Instruments, USA) was used to obtain the Fe2O3 content by heating our sample in air from 0 °C to 800 °C at a heating rate of 20 °C min−1. XPS spectra were performed by an ESCALAB 250 Xi. XPS system of Thermo Scientific, where the analysis chamber was 1.5 × 10⁻⁹ mbar and the X-ray spot was set to 500 μm.Electrochemical measurements
Electrochemical studies were carried out in a conventional three-electrode and two-electrode symmetric supercapacitor setup with room temperature. Briefly, in three-electrode system Fe2O3/GA on nickel foam as the working electrode, platinum (Pt) foil and standard calomel electrode (SCE) were used as counter and reference electrodes in 6 M KOH, respectively. The working electrode was prepared by mixing 80 wt% active materials, 8 wt% PVDF binder and 12 wt% carbon black in an agate mortar. Then an appropriate amount of ethanol was added to this mixture to make slurry, which was subsequently coated on nickel foam and dried in an oven at 100 °C for 10 h. For two electrodes symmetric system the PVA–KOH gel electrolyte was prepared as follows: 8 g of PVA powder was put into 60 mL distilled water and was fully dissolved at 85 °C with stirring. Then 6 g of KOH was added into the solution and stirred vigorously until the powder was completely dissolved and solution became clear.Fabrication of all solid-state supercapacitor electrodes
In both cases, prior to the device fabrication, nickel foam sheets (2.5 cm × 1.5 cm) were pressed under pressure of ∼10–15 MPa for 1 min by a pressing machine and were cleaned with acetone for 20 min, washed thoroughly with deionized water and absolute ethanol. These pressed sheets were then used as support and current collector. The active material was pasted on these sheets. The prepared electrodes were immersed in the PVA–KOH gel solution for 30–60 min and then taken out. After vaporizing the excess water at room temperature, the two electrodes were assembled. When the gel electrolyte solidified, a robust and highly flexible, all-solid-state symmetric supercapacitor was prepared.The electrochemical performance of the assembled devices ware studied on a CHI660D electrochemical workstation using cyclic voltammetry (CV) at various scan rates, galvanostatic charge–discharge (CD) at different current densities from 0.45 A to 8 A and electrochemical impedance spectroscopy (EIS) in the frequency range from 100 kHz to 0.1 Hz at open circuit potential. For quantitative considerations, the specific capacitance was calculated as follows:
In the three-electrode measurement, the specific capacitance is calculated from charge–discharge profiles using the following equation:
| Cs = (I × t)/(V × m) |
For two electrodes symmetric system the following equation is used to calculate the specific capacitance22:
| Cs = 2 × I × dt/m × ΔV |
Results and discussion
Fig. 1 shows the typical preparation process of Fe2O3/GA composite. A possible reduction mechanism of Fe2+ and the role of NH4OH can be described as follows| GO + Fe2+ → Fe3+ | (1) |
| Fe2+ + NH3·H2O → Fe2O3 + NH4+ | (2) |
Our way of synthesis of these Fe2O3/GA hybrid is more general because of (i) the use of low valence metal ions (Fe2+) salts as precursors guarantee the exclusive growth of metal oxide NPs on the surface of GO sheets23 (ii) avoid the use of as-synthesized Fe3O4 NPs and specific organic solvents and stabilizers or surfactants like PVP etc.24 and (iii) high loading of metal oxide NPs in the hybrids.
The morphology and microstructure of the as-prepared Fe2O3/GA were elucidated by means of Scanning Electron Microscopy (SEM), Transmission Electron Microscopy (TEM) and X-Ray Diffraction (XRD). SEM images show that the Fe2O3/GA composite exhibits a hierarchical and interconnected porous network composed of randomly oriented graphene sheets, (Fig. 2a) similar to those of previous graphene aerogel. The results also revealed uniformly dispersed framework with continuous pores of several micrometers. The unique 3D porous structure can largely prevent the aggregation of graphene sheets caused by π–π interaction and van der Waals force, which may be beneficial to the rapid transport of electrolyte.25 While stacked graphene sheets have numerous wrinkles and folds without obvious pores (Fig. S1†). Moreover, magnified SEM image of Fe2O3/GA clearly shows that Fe2O3 NPs are uniformly encapsulated within the graphene layers with high density, indicating an efficient hybridation of Fe2O3 NPs and graphene sheets (Fig. 2b). It is important that the encapsulation of Fe2O3 NPs within the graphene sheets avoid direct contact between Fe2O3 particles and electrolyte. Such 3D porous frameworks promote the electrochemical activity and stability of the composites.26 TEM characterization show the uniform distribution and intimate contact between the graphene sheets and Fe2O3 nanoparticles with diameters of 15–60 nm (Fig. 2c). Elemental distribution mapping and HRTEM results (Fig. 2d) further confirm the Fe2O3/GA nature. From Fe, O and C maps, we can clearly see that C is everywhere, representing the graphene scaffold, while Fe and O (Fe2O3) are also present. Moreover, the HRTEM image shows the inter-planar spacing between lattice fringes is 0.25 nm, in agreement with the (110) plane of α-Fe2O3.
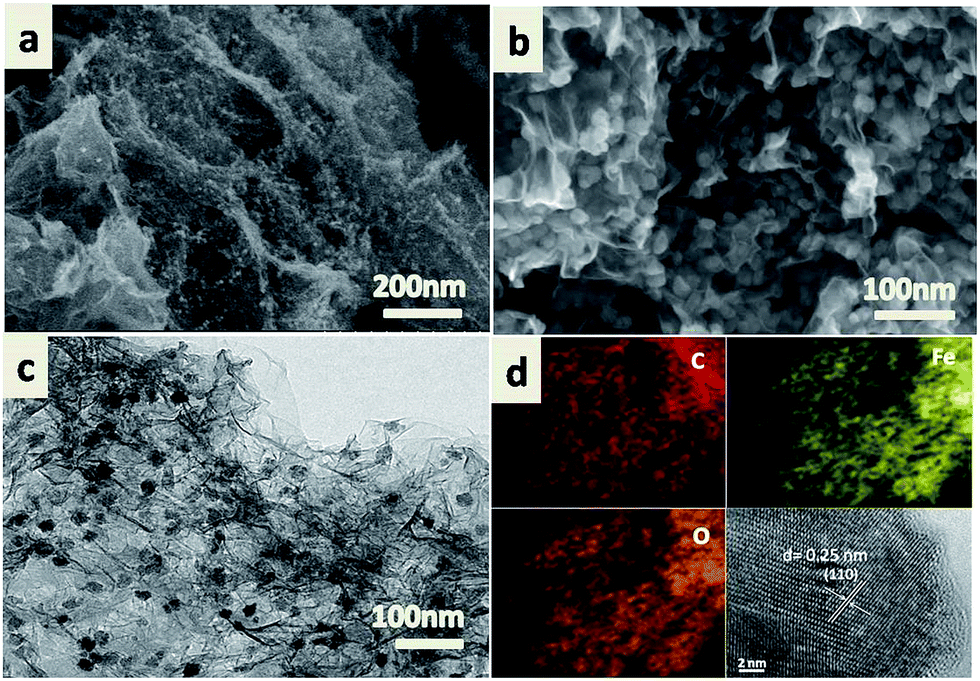 | ||
| Fig. 2 Typical SEM, (a and b) TEM image, (c) elemental maps for C, Fe and O and HRTEM of Fe2O3/GA composite (d). | ||
The EDS spectra also verify the presence of the elements C, O, Fe and Si. The signal of Si is from silica glass (Fig. S2†). The powder XRD pattern of the composite indicates that the attached Fe2O3 NPs are alpha phase (hematite) (JCPDS file card no. 33-0664), consistent with the result of HRTEM characterization (Fig. 3a). The absence of extra diffraction peaks demonstrates high purity and crystallinity of the Fe2O3 particles. Remarkably, no apparent diffraction peak could be identified at 20–30° which corresponds to the (002) diffraction peak of graphene. This indicates that the Fe2O3 NPs were efficiently deposited on the graphene surface, suppressing the stacking of graphene layers.
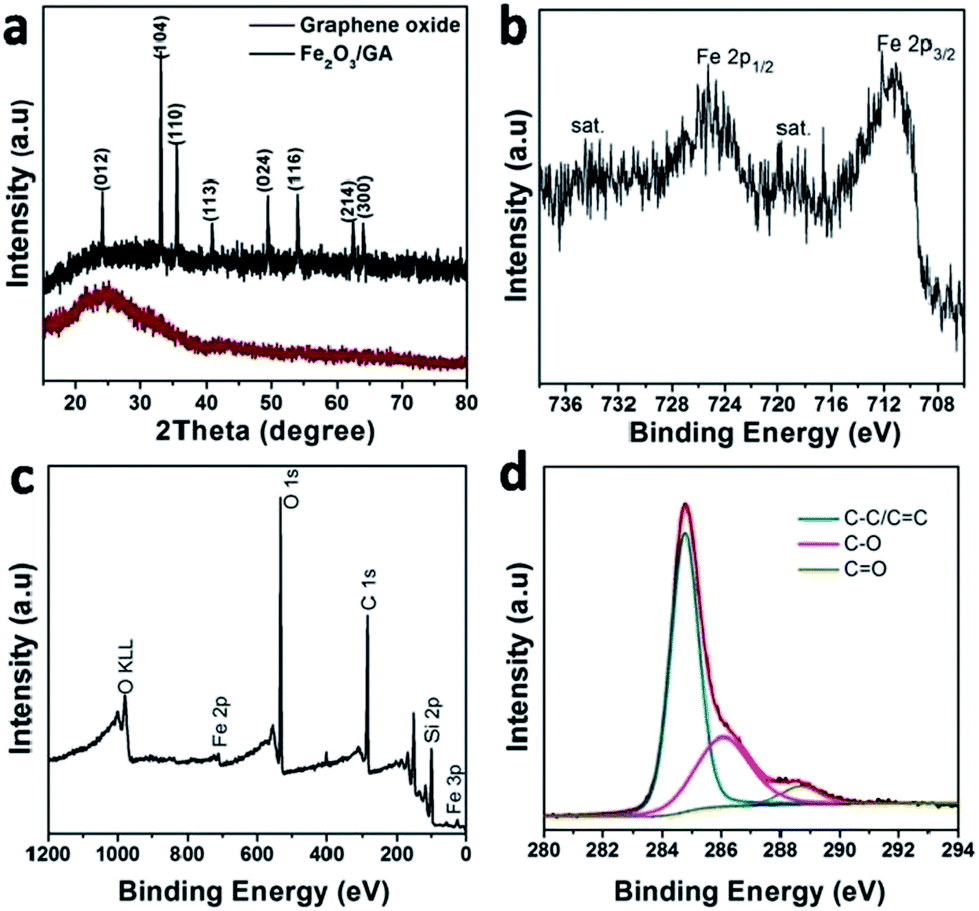 | ||
| Fig. 3 XRD pattern (a) the narrow spectra of Fe 2p (b) XPS survey spectra (c) and the narrow spectra of O 1s (d) of the Fe2O3/GA composite. | ||
More information about the chemical bonding states in Fe2O3 as well as the chemical element valence were obtained by typical X-ray photoelectron spectroscopy (XPS) measurements (Fig. 3b–d). In the high-resolution Fe 2p spectrum (Fig. 3b), the oxidation state of spectrum for the Fe 2p core level shows two distinct peaks located at 711.0 and 724.6 eV corresponding to a spin–orbit couple of the Fe 2p3/2 and Fe 2p1/2 peaks, which are typical of Fe3+ of Fe2O3. In addition, these two peaks are accompanied by two shake-up satellites situated at 719 and 732.6 eV corresponding to Fe2+ and does not overlap either with Fe 2p3/2 or Fe 2p3/2 peaks.17,18 This result indicates that Fe2O3–GA contains no or only trace amount of Fe3O4. The survey XPS spectrum demonstrates that Fe2O3/GA hybrid consists of iron, oxygen, and carbon (Fig. 3c). In C 1s spectrum, three peaks at 284.7, 286.6 and 289 eV are assigned to C–C/C![[double bond, length as m-dash]](https://www.rsc.org/images/entities/char_e001.gif) C, C–O and CO, respectively (Fig. 3d).17,27 The low intensities of C–O and CO functional groups suggest the conversion of GO precursor to graphene. As shown in Fig. S3,† in the case of O 1s, the spectrum can be deconvoluted into two subpeaks positioned at 530.2 and 531.8 eV, in accordance with O–Fe and OC, respectively.27
C, C–O and CO, respectively (Fig. 3d).17,27 The low intensities of C–O and CO functional groups suggest the conversion of GO precursor to graphene. As shown in Fig. S3,† in the case of O 1s, the spectrum can be deconvoluted into two subpeaks positioned at 530.2 and 531.8 eV, in accordance with O–Fe and OC, respectively.27
The interesting morphologies of the Fe2O3/GA hybrids show promise for energy storage applications. We next evaluated the electrochemical properties of the hybrid Fe2O3/GA-III (here III refers to three-electrode system) using 6 M KOH aqueous electrolyte. The typical CV curves exhibit one pair of obvious redox peaks at about −0.687 V for the anodic scan and −1.02 V for the cathodic scan, which are respectively ascribed to the oxidation and reduction processes (Fig. 4a). Well defined redox peaks confirm the faradaic behavior of the Fe2O3/GA-III product that involves the reversible redox reactions Fe2+ ↔ Fe3+.28 Apparently, the peak current density positively relates to the scan rate without obvious shape change of the CV curve, indicating a good rate capability for Fe2O3/GA-III. However, the increased scan rate caused a positive shift of the anodic peaks and a negative movement of the cathodic peaks. This phenomenon indicates that the polarization of Fe3+/Fe2+ reaction increases at a high charging/discharging rate.
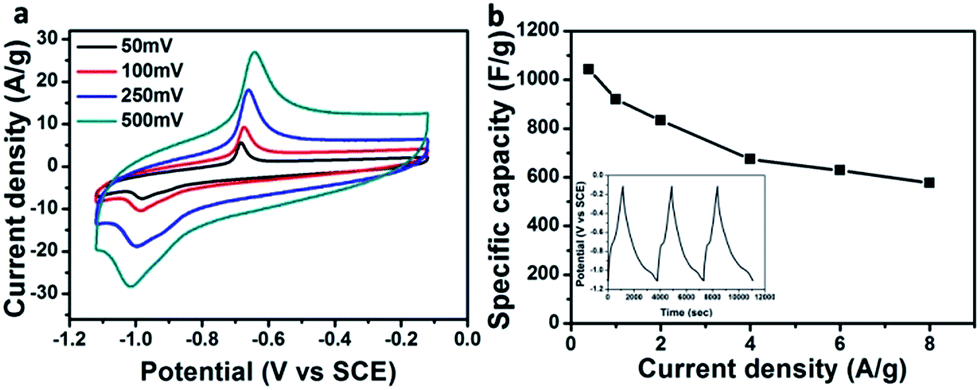 | ||
| Fig. 4 Electrochemical performance of Fe2O3/GA-III in three electrode system; (a) CV curves of Fe2O3/GA-III at various scan rates, (b) capacitance at different current densities. The inset shows first three CD cycles at 0.4 A current density. | ||
The specific capacitances of the composites are calculated from galvanostatic charge/discharge curves at different current densities ranging from 0.4 A to 8 A. A high capacitance of 1045.3 F g−1 at 0.4 A g−1 is obtained for Fe2O3/GA-III (Fig. 4b). It could be observed that the specific capacitance is still as high as 577 F g−1 even at the current density of 8 A g−1, indicating good rate capability. A well defined charge step (oxidation) at around −0.67 V and a discharge step (reduction) at around −1.0 V can be observed (Fig. 4b inset). These voltage platforms correspond to oxidation and reduction of Fe2O3 nanoparticles, respectively. The CD results agree well with the above CV characterizations.
The Fe2O3/GA and Fe2O3/G composites were next tested in two electrode system by means of cyclic voltammogram (CV), galvanostatic charge/discharge (CD) measurements and electrochemical impedance spectroscopy (EIS). The CV curves of both two-electrode Fe2O3/GA and Fe2O3/G SC devices measured at potential scan rate of 50–500 mV s−1 show slight distortions from the quasi rectangular shape, which indicates good capacitive behaviour of the composites (Fig. 5a and b). Here the disappearance of redox peaks in the two electrode system is observed which is normally seen in redox active materials. The reasons are not clear yet.29 Moreover, the increasing scan rate dose not influence the shape of the CV curves significantly, indicating good electron conductivity in the composites. However, by comparing the current response of the CV curves, the Fe2O3/GA SC exhibited much higher current density than Fe2O3/G SC, leading to a larger area of the closed curve thus a higher specific capacitance (Fig. 5a). As tested at scan rate of 100–1000 mV s−1, device shows good capacitive behaviour with perfect CV curves indicating fast and successive reversible charge–discharge property owing to the porous 3D framework of the graphene aerogel (Fig. S4†). No obvious change in CV curves was observed after 500 cycles at scan rate of 100 mV s−1, which suggest the stable nature of Fe2O3/GA composite (Fig. S5†). Galvanostatic charge–discharge (CD) curves of Fe2O3/GA and Fe2O3/G SC at different current densities are then tested. The CD curves for both devices are relatively symmetrical and linear which indicate a good electrochemical capacitive behaviour of the devices with excellent reversibility (Fig. 5c and d). The specific capacitances of the Fe2O3/GA SC from the discharge curves are calculated to be 440 and 393 F g−1 at a current density of 0.45 and 1.5 A g−1, respectively. In contrast, the Fe2O3/G SC shows lower values of 357 F g−1 at 0.45 A and 338 F g−1 at 1.5 A. These results are consistent with the CV characterizations above. A common feature of both two SCs is the linear charging and discharging profiles indicating better capacitive performance. Furthermore, the devices showed no IR drop in CD curves representing a negligible intrinsic resistance of the electrode, which could be attributed to the superior conductivity of the composite.
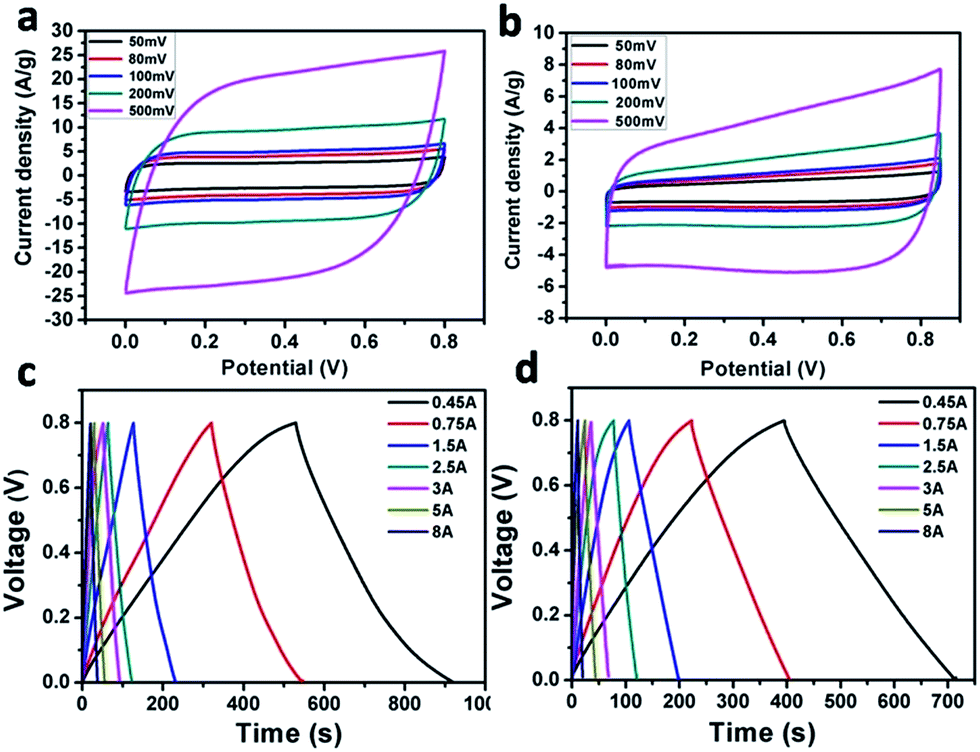 | ||
| Fig. 5 Two-electrode supercapacitor performance of Fe2O3/GA and Fe2O3/G. CV curves of Fe2O3/GA SC (a) and Fe2O3/G SC (b); charge/discharge curves of Fe2O3/GA SC (c) and Fe2O3/G SC (d). | ||
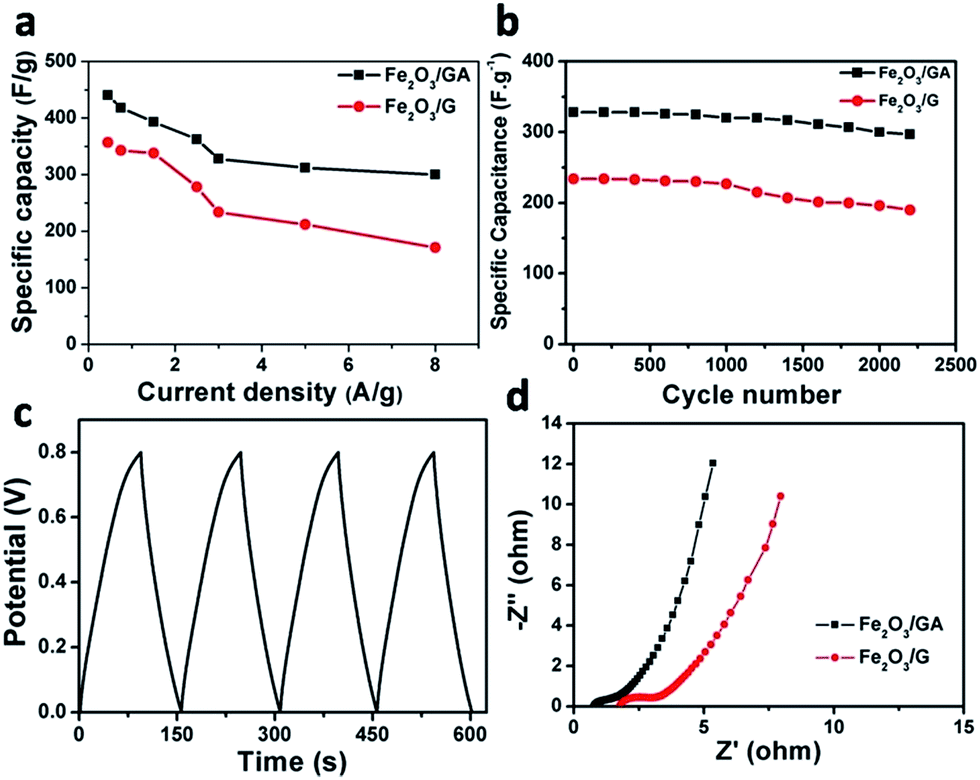
When discharge current density was increased to 8 A g−1, the Fe2O3/GA SC still exhibited considerable capacitance of 300 F g−1, in contrast with 171 F g−1 for Fe2O3/G SC, indicating high rate capability of Fe2O3/GA SC (Fig. 6a). The capacitance of the Fe2O3/GA reported here at a current density of 1.5 A g−1 is also higher than that of many metal–oxide based anode materials and comparable to or even higher than that of the cathode materials such as MnO2, Co3O4, V2O5, MoO3.30 Furthermore, to exhibit the advantage of the Fe2O3/GA SC, the performance of different FeOx/graphene nanocomposite based supercapacitors are compared in Table S1.† The specific capacitance of the as-prepared Fe2O3/GA SC is superior to that of many iron oxide and graphene based composites. To further evaluate the durability of our devices, the cycling stability of the supercapacitor was tested through a cyclic charge/discharge process at current density of 3 A g−1. The as fabricated Fe2O3/GA SC device exhibit 328 and 297 F g−1 for the first and 2200th cycles, respectively, corresponding to 90.5% of capacitance retention. While the Fe2O3/G SC shows 234 F g−1 and 190 F g−1 under the same testing conditions, corresponding to only 81% capacitance retention (Fig. 6b). The capacitance loss in the Fe2O3/G SC might be mainly caused by volume changes as a result of restacking of graphene layers and subsequent particle pulverization. The 3D structure in the Fe2O3/GA SC electrode can release the mechanical stress during charge–discharge process, and therefore is beneficial in maintaining the stability of the electrode structure.26 The first four galvanostatic charge–discharge curves at 2.5 A g−1 is shown in Fig. 6c, corroborates the result with cyclic stability. In order to investigate the resistance of the composites, AC impedance spectral analysis (EIS) for both devices was carried out. Nyquist plots were collected in the frequency range of 100 kHz to 0.1 Hz at open circuit potential (Fig. 6d). Z′ and Z′′ refer to the real and imaginary parts of the impedance. It can be observed that quantitatively, all Nyquist plot curves are same (straight line) in shape, having two distinct parts, a small semicircle arc at high frequency region and a linear part at low frequency region. The arc usually corresponds to the charge transfer limiting process and is ascribed to the double-layer capacitance (Cdl) in parallel with the charge transfer resistance (Rct).28,31 The inclined portion of the curve (about 45°) is ascribed to the Warburg impedance representing ion diffusion in the electrolyte to the electrode surface.32 It is noted that the Nyquist curve of the Fe2O3/GA SC electrode exhibits very small arc and more straight line than the corresponding Fe2O3/G SC electrode, indicating ideal capacitive behaviour of the device and low resistance of the electrodes. The higher capacitance of Fe2O3/GA SC electrode might due to the synergistic effect of the combination of Fe2O3 nanoparticles and the fine 3D interconnected framework structure of GA that serve as “the highway” to promote and facilitate ion adsorption and diffusion between the active material and electrode. The uniform distribution of small sized Fe2O3 nanoparticles helps to shorter electrolyte diffusion pathways, hence guaranteeing the sufficient utilization of Fe2O3 particles.28,33
 | ||
| Fig. 6 Specific capacitance plot against the current density (a) cyclic stability of both symmetric devices at 3 A g−1 (b) first four charge/discharge curves of the Fe2O3/GA SC at 2.5 A g−1 (c) and Nyquist plots of Fe2O3/GA and Fe2O3/G SCs (d). | ||
To further investigate the Fe2O3/GA composite for practical application, all-solid-state flexible supercapacitor devices were fabricated, in which pressed Ni foam substrate was used as the flexible current collector, and KOH/poly(vinyl alcohol) (PVA) gel electrolyte was used as the solid electrolyte as shown schematically in Fig. 7a. The fabricated devices were examined by CV, charge/discharge and cycling measurements. The flexibility of the device was first tested by CV at different bending angles of 90° and 180° (Fig. 7b). It is clear that the CV curves remained unchanged, stable and nearly rectangular in shape indicating high flexibility and good electrochemical stability. The device with bending angle of 90° was also tested at different scan rate. With increasing scan rate, there is no obvious distortion of the CV curves, indicating high rate capability (Fig. 7c). The CV curve of the 90° bent device at 20 mV after 2000 cycles is similar to that of its initial state without any obvious change, showing high flexibility and excellent stability of the device (Fig. S6†).
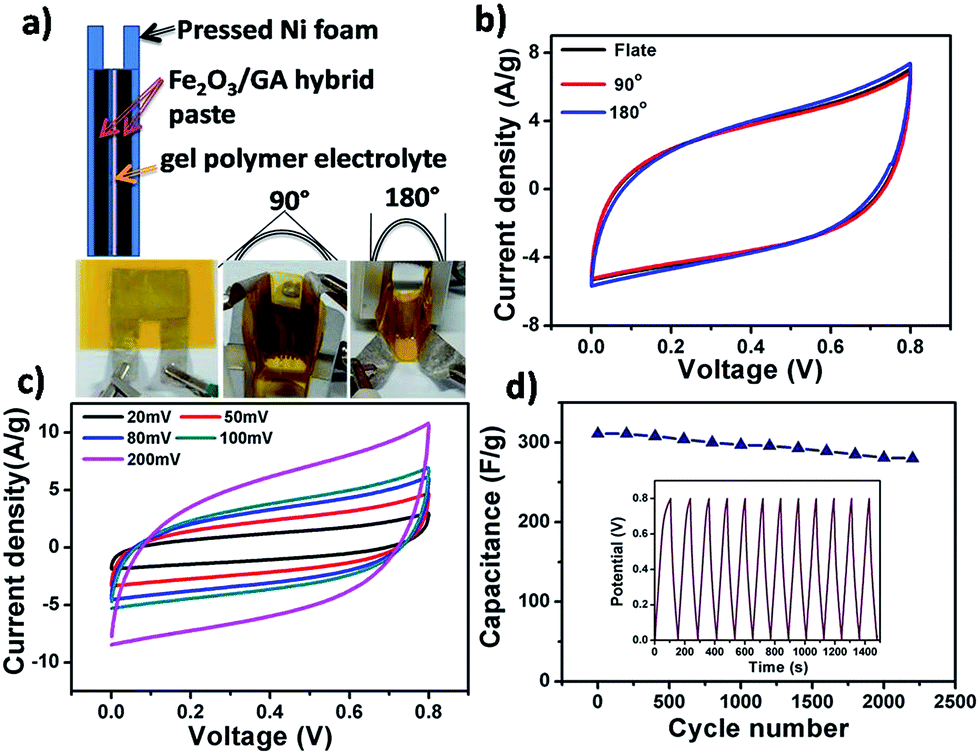 | ||
| Fig. 7 Schematic and optical images of the flexible supercapacitor in different bending states, (a) CV curves of the device at scan rate of 100 mV s−1 when bent to 0°, 90° and 180°, (b) CV curves of 90° bent device at different scan rates, (c) and capacitance of 90° bent device over 2200 cycles at 3 A g−1 (inset showing first 10 CD cycles at 3 A g−1) (d). | ||
Moreover, the long term cycling stability of the 90° bent device was also tested by cyclic charge/discharge process at current density of 3 A g−1 with capacitance retention of 89% after 2200 cycles (Fig. 7d). By comparing the cycling performance of the bended and planner devices carefully, one can notice that no significant difference in device performance was observed after bending, further demonstrating the ultra flexible and stable nature of the Fe2O3/GA SC electrode (Fig. S7†). In addition, electrochemical impedance spectroscopy (EIS) measurement was carried out to investigate the reason for the excellent capacitive performance of the bent device and its relationship with ionic and electronic resistance. Nyquist plot of the bent device before and after 2000 CV cycles shows that at very high frequencies, the intercept at real part Z′ (ionic resistance of electrolyte) value is almost the same for both impedance spectra. The semi circular loop at high frequency is too small to identify, indicating the small interfacial charge-transfer resistance and good electrical conductivity of the electrode material. The slope of the impedance plot (about 45°) at low frequency increases and tends to become purely capacitive; this implies that bending effect is negligible and the charge transfer between the Fe2O3 and the conductive GA sheets is a fast process, revealing the ultra flexibility of the device28b–d (Fig. S8†).
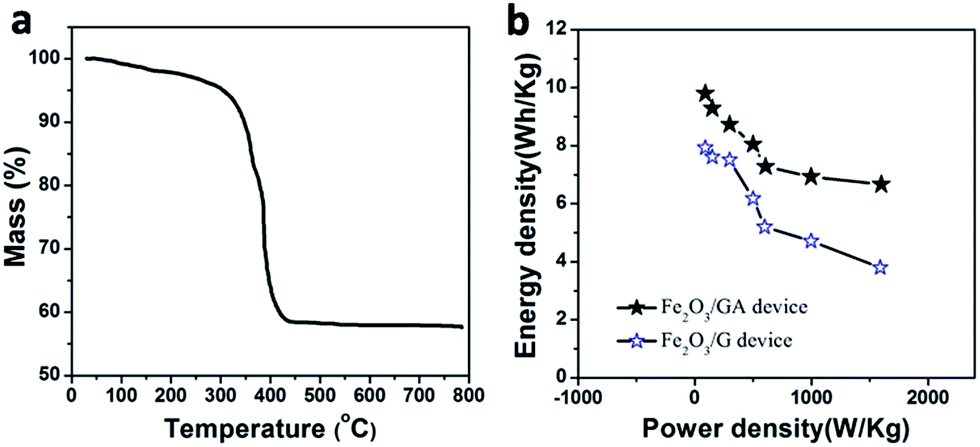
TGA measurement carried out in the air was used to determine the loading amount of Fe2O3 in the Fe2O3/GAs. As shown in Fig. 8a, the TGA curve displays a significant weight loss at approximately 350 °C and a constant weight above 500 °C. The miniscule weight loss (<7%) that appeared below 300 °C is most likely attributed to the evaporation of adsorbed water molecules. The major weight loss from 350 to 500 °C was approximately 34%, indicating the combustion of graphene. Therefore, the content of Fe2O3 in Fe2O3/GAs was calculated to be 59%.
 | ||
| Fig. 8 TGA curve of the Fe2O3/GA (a) and Ragone plots of energy density versus power density for our symmetric SCs (b). | ||
The Ragone plot given in Fig. 8b compares the energy density and power density of the Fe2O3/GA and Fe2O3/G in two-electrode symmetric SCs. The Ragone plots verify that the Fe2O3/GA SC operated at 0.8 V delivered the highest energy density of 9.8 W h kg−1 under a power density of 90.1 W kg−1 higher than Fe2O3/G SC (7.9 W h kg−1 under almost the same power density). Even when the power density is increased to 1600 W kg−1, the energy density of our Fe2O3/GA SC still maintains 6.7 W h kg−1. It is clear that Fe2O3/GA SC exhibits much better performance in terms of both energy density and power density than Fe2O3/G SC device. The results of this work are comparing favourably with earlier related reports.
Conclusions
In summary, a novel class of Fe2O3/GA hybrid was successfully synthesized through hydrothermal method and the material showed good performance as lightweight solid-state, flexible symmetric SC device. Compared with the nonporous Fe2O3/G composite, the Fe2O3/GA composite show much higher capacitance and cycle stability. In addition, all-solid-state flexible supercapacitor devices were fabricated by the as prepared Fe2O3/GA composite, which show excellent flexibility and stability nature. This rationally designed 3D graphene and metal oxide composite network based SC makes it a promising candidate as electrode material for a flexible SC. Moreover, further optimization of the fabrication process on the simple and low-cost assembly of this flexible and lightweight device may also improve its performance as efficient electrode material for its practical use in adhesive tape-like or wearable electronics.Acknowledgements
This work was supported financially by National Key Basic Research Program of China (2014CB931801, Z. Y. T.), National Natural Science Foundation of China (51472054, L. S. Li, 21475029 and 91427302, Z. Y. T.), Instrument Developing Project of the Chinese Academy of Sciences (YZ201311, Z. Y. T.), CAS-CSIRO Cooperative Research Program (GJHZ1503, Z. Y. T.), and “Strategic Priority Research Program” of Chinese Academy of Sciences (XDA09040100, Z. Y. T.).References
- (a) P. J. Hall and E. J. Bain, Energy Policy, 2008, 36, 4352 CrossRef; (b) M. Winter and R. J. Brodd, Chem. Rev., 2004, 104, 4245 CrossRef CAS PubMed; (c) J. R. Miller and P. Simon, Science, 2008, 321, 651 CrossRef CAS PubMed.
- Y. Xu, C. Y. Chen, Z. Zhao, Z. Lin, C. Lee, X. Xu, C. Wang, Y. Huang, M. I. Shakir and X. Duan, Nano Lett., 2015, 15, 4605 CrossRef CAS PubMed.
- M. D. Stoller, S. Park, Y. Zhu, J. An and R. S. Ruoff, Nano Lett., 2008, 8, 3498 CrossRef CAS PubMed.
- H. Gwon, H. S. Kim, K. U. Lee, D.-H. Seo, Y. C. Park, Y.-S. Lee, B. T. Ahn and K. Kang, Energy Environ. Sci., 2011, 4, 1277 Search PubMed.
- Y. Xu, Z. Lin, X. Huang, Y. Wang, Y. Huang and X. Duan, Adv. Mater., 2013, 25, 5779 CrossRef CAS PubMed.
- S. Pang, Y. Hernandez, X. Feng and K. Mullen, Adv. Mater., 2011, 23, 2779 CrossRef CAS PubMed.
- (a) L. Gao, W. Ren, H. Xu, L. Jin, Z. Wang, T. Ma, L. P. Ma, Z. Zhang, Q. Fu, L. M. Peng, X. Bao and H. M. Cheng, Nat. Commun., 2012, 3, 699 CrossRef PubMed; (b) Y. Zhang, L. Zhang and C. Zhou, Acc. Chem. Res., 2013, 46, 2329 CrossRef CAS PubMed.
- Y. Xu, K. Sheng, C. Li and G. Shi, ACS Nano, 2010, 4, 4324 CrossRef CAS PubMed.
- (a) J. R. Miller, R. A. Outlaw and B. C. Holloway, Science, 2010, 329, 1637 CrossRef CAS PubMed; (b) J. R. Miller and R. A. Outlaw, J. Electrochem. Soc., 2015, 162, A5077 CrossRef CAS.
- D. Wang, Q. Wang and T. Wang, Nanotechnology, 2011, 22, 135604 CrossRef PubMed.
- (a) M.-S. Song, K. M. Lee, Y. R. Lee, I. Y. Kim, T. W. Kim, J. L. Gunjakar and S.-J. Hwang, J. Phys. Chem. C, 2010, 114, 22134 CrossRef CAS; (b) J. Jiang and A. Kucernak, Electrochim. Acta, 2002, 47, 2381 CrossRef CAS.
- (a) T. Brezesinski, J. Wang, S. H. Tolbert and B. Dunn, Nat. Mater., 2010, 9, 146 CrossRef CAS PubMed; (b) X. Lu, T. Zhai, X. Zhang, Y. Shen, L. Yuan, B. Hu, L. Gong, J. Chen, Y. Gao, J. Zhou, Y. Tong and Z. L. Wang, Adv. Mater., 2012, 24, 938 CrossRef CAS PubMed.
- Y. Fan, H. Shao, J. Wang, L. Liu, J. Zhang and C. Cao, Chem. Commun., 2011, 47, 3469 RSC.
- Y. M. Chen, Z. Li and X. W. Lou, Angew. Chem., Int. Ed., 2015, 54, 10521 CrossRef CAS PubMed.
- B. Wang, J. S. Chen, H. B. Wu, Z. Wang and X. W. Lou, J. Am. Chem. Soc., 2011, 133, 17146 CrossRef CAS PubMed.
- X. Zhu, Y. Zhu, S. Murali, M. D. Stoller and R. S. Ruoff, ACS Nano, 2011, 5, 3333 CrossRef CAS PubMed.
- S. Yang, X. Song, P. Zhang, J. Sun and L. Gao, Small, 2014, 10, 2270 CrossRef CAS PubMed.
- K. K. Lee, S. Deng, H. M. Fan, S. Mhaisalkar, H. R. Tan, E. S. Tok, K. P. Loh, W. S. Chin and C. H. Sow, Nanoscale, 2012, 4, 2958 RSC.
- S. Yang, X. Song, P. Zhang and L. Gao, ACS Appl. Mater. Interfaces, 2015, 7, 75 Search PubMed.
- H. Yin, S. Zhao, J. Wan, H. Tang, L. Chang, L. He, H. Zhao, Y. Gao and Z. Tang, Adv. Mater., 2013, 25, 6270 CrossRef CAS PubMed.
- W. S. Hummers and R. E. Offeman, J. Am. Chem. Soc., 1958, 80, 1339 CrossRef CAS.
- (a) L. Hao, J. Ning, B. Luo, B. Wang, Y. Zhang, Z. Tang, J. Yang, A. Thomas and L. Zhi, J. Am. Chem. Soc., 2015, 137, 219 CrossRef CAS PubMed; (b) S. Khalid, C. Cao, L. Wang and Y. Zhu, Sci. Rep., 2016, 6, 22699 CrossRef CAS PubMed; (c) C. Xiang, M. Li, M. Zhi, A. Manivannan and N. Wu, J. Power Sources, 2013, 226, 65 CrossRef CAS.
- (a) W. Wei, S. Yang, H. Zhou, I. Lieberwirth, X. Feng and K. Mullen, Adv. Mater., 2013, 25, 2909 CrossRef CAS PubMed; (b) W. Chen, S. Li, C. Chen and L. Yan, Adv. Mater., 2011, 23, 5679 CrossRef CAS PubMed; (c) X. Yang, X. Zhang, Y. Ma, Y. Huang, Y. Wang and Y. Chen, J. Mater. Chem., 2009, 19, 2710 RSC.
- (a) D. Chen, W. Wei, R. Wang, J. Zhu and L. Guo, New J. Chem., 2012, 36, 1589 RSC; (b) H. Wang, L. F. Cui, Y. Yang, H. Sanchez Casalongue, J. T. Robinson, Y. Liang, Y. Cui and H. Dai, J. Am. Chem. Soc., 2010, 132, 13978 CrossRef CAS PubMed.
- W. Qian, J. Zhu, Y. Zhang, X. Wu and F. Yan, Small, 2015, 11, 4959 CrossRef CAS PubMed.
- (a) L. Xiao, D. Wu, S. Han, Y. Huang, S. Li, M. He, F. Zhang and X. Feng, ACS Appl. Mater. Interfaces, 2013, 5, 3764 CrossRef CAS PubMed; (b) Z. S. Wu, S. Yang, Y. Sun, K. Parvez, X. Feng and K. Mullen, J. Am. Chem. Soc., 2012, 134, 9082 CrossRef CAS PubMed.
- J. Chen, J. Xu, S. Zhou, N. Zhao and C. P. Wong, Nano Energy, 2015, 15, 719 CrossRef CAS.
- (a) A. Mahmood, R. Zou, Q. Wang, W. Xia, H. Tabassum, B. Qiu and R. Zhao, ACS Appl. Mater. Interfaces, 2016, 8, 2148 CrossRef CAS PubMed; (b) H. Zhang, Q. Gao, K. Yang, Y. Tan, W. Tian, L. Zhu, Z. Li and C. Yang, J. Mater. Chem. A, 2015, 3, 22005 RSC; (c) Q. Tang, W. Wang and G. Wang, J. Mater. Chem. A, 2015, 3, 6662 RSC; (d) Q. Wang, L. Jiao, H. Du, Y. Wang and H. Yuan, J. Power Sources, 2014, 245, 101 CrossRef CAS; (e) Z. Ma, X. Huang, S. Dou, J. Wu and S. Wang, J. Phys. Chem. C, 2014, 118, 17231 CrossRef CAS.
- (a) W. Tian, X. Mao, P. Brown, G. C. Rutledge and T. A. Hatton, Adv. Funct. Mater., 2015, 25, 4803 CrossRef CAS; (b) M. D. Stoller and R. S. Ruoff, Energy Environ. Sci., 2010, 3, 1294 RSC; (c) V. Khomenko, E. Frackowiak and F. Béguin, Electrochim. Acta, 2005, 50, 2499 CrossRef CAS.
- Q. Qu, S. Yang and X. Feng, Adv. Mater., 2011, 23, 5574 CrossRef CAS PubMed.
- (a) L. Yuan, X.-H. Lu, X. Xiao, T. Zhai, J. Dai, F. Zhang, B. Hu, X. Wang, L. Gong, J. Chen, C. Hu, Y. Tong, J. Zhou and Z. L. Wang, ACS Nano, 2012, 6, 656 CrossRef CAS PubMed; (b) J. Yan, Z. Fan, T. Wei, W. Qian, M. Zhang and F. Wei, Carbon, 2010, 48, 3825 CrossRef CAS.
- W. Shi, J. Zhu, D. H. Sim, Y. Y. Tay, Z. Lu, X. Zhang, Y. Sharma, M. Srinivasan, H. Zhang, H. H. Hng and Q. Yan, J. Mater. Chem., 2011, 21, 3422 RSC.
- (a) Z. S. Wu, Y. Sun, Y. Z. Tan, S. Yang, X. Feng and K. Mullen, J. Am. Chem. Soc., 2012, 134, 19532 CrossRef CAS PubMed; (b) W. Chen, Z. L. Fan, L. Gu, X. H. Bao and C. L. Wang, Chem. Commun., 2010, 46, 3905 RSC.
Footnote |
| † Electronic supplementary information (ESI) available. See DOI: 10.1039/c6ra11106h |
| This journal is © The Royal Society of Chemistry 2016 |