Synthesis and enhanced gas sensing properties of Au-nanoparticle decorated CdS nanowires†
Xiaohui Maa,
Sijia guoa,
Jingli Shena,
Yu Chen*a,
Chuan Chenc,
Liang Sunc,
Xindong Zhang*ac and
Shengping Ruan*ab
aState Key Laboratory on Integrated Optoelectronics and College of Electronic Science & Engineering, Jilin University, Changchun 130012, P. R. China
bState Key Laboratory on Applied Optics, Changchun 130023, P. R. China
cGlobal Energy Interconnection Research Institute, Beijing, 102211, P. R. China
First published on 20th July 2016
Abstract
CdS nanowires (NWs) with an average diameter of 30 nm were synthesized by a solvothermal method and then Au nanoparticles with a size of 10–25 nm were decorated on the surface of the as-synthesized CdS NWs through a simple deposition process. The ethanol sensing properties of CdS NWs and Au-nanoparticle decorated CdS NWs with different Au content were investigated. The results showed that Au nanoparticle-decorated CdS NWs could enhance the response of CdS NWs to ethanol. Especially, the Au–CdS NWs with a proper Au decorating content showed the highest response to 100 ppm ethanol (about 110) which was 5 times higher than that of the CdS NWs as well as fast response/recovery speed (less than 15 s and 5 s, respectively) and excellent selectivity. In addition, the mechanism of CdS NWs and Au nanoparticle-decorated CdS NWs were discussed.
Introduction
Since the gas sensing reactions depend on the active centres and the defects existing on the surface layer of materials, the response of a gas sensor is usually determined by the surface-to-volume ratio of materials.1 Compared with conventional materials, one-dimensional (1-D) nanostructures have attracted attention due to their excellent properties, such as large surface-to-volume ratio and easy to control size. So the 1-D nanostructures have already displayed superior sensitivity to surface chemical processes.2 Until now, many 1-D nanostructures have been reported, such as nanorods,3 nanobelts, nanotubes,4,5 nanoribbon and nanowires.6With the increasing development of industry and seriousness of environment problem, there are more and more opportunities for people to contact with poisonous, noxious and flammable gases such as ethanol, formaldehyde, carbon monoxide, methane, nitric oxide and so on which are either industrial raw materials or atmospheric pollutants. Up to now, a large number of nanomaterials for gas sensing application such as SnO2,7–10 ZnO,10–13 WO3 (ref. 13–16) and so on have been reported. In the past decades, gas sensing materials based on metal oxide semiconductors have been obtaining extensive research, while other classes of gas sensing materials like metal chalcogenides drawing a little attention.
As a representative of metal sulfides, CdS is an important II–VI group semiconductor with a direct band gap of 2.42 eV.17 It has attracted particular attention and been widely applied in many fields that contain solar cell, photoconductor18 and laser19 for its excellent optical and electrical properties. At the same time, different morphologies of CdS like nanorods,20–22 nanobelts17,23–25 and nanoparticles26–28 etc. have been synthesised thought different methods. However, the research about the gas sensing properties of CdS has rarely been reported in the existing literatures.
Decorating noble metal such as Au, Ag, Pd and Pd etc. is an effective mean to improve the gas sensing properties of materials. Nanoscale noble metal usually acts as a catalyst to boost the gas sensing reaction occurred on the surface of the gas sensing material. Although many studies have been reported on the enhancement of gas sensing properties of oxide semiconductor caused by noble metal catalysts,29 the effects of the decorated noble metal and its content on gas sensing properties of metal sulfide have barely been investigated.
In this paper, CdS NWs and Au nanoparticle-decorated CdS NWs (Au–CdS NWs) with different Au content were successfully synthesized. The ethanol sensing properties of CdS NWs and Au–CdS NWs were investigated and the results indicated that the Au–CdS NWs, especially the ones with proper Au content, showed great enhancement in the response to ethanol. In addition, the mechanism about the enhanced ethanol-sensing performance of the Au–CdS NWs was discussed.
Experimental section
Preparation of CdS NWs
All the reagents were of analytical grade and used without any further treatment.The synthesis of the CdS NWs was carried out by a typical one-step solvothermal method. In a typical procedure, cadmium nitrate (1.9 g) and thiourea (1.4 g) were successively dissolved in 32 mL of ethylenediamine. Then the solution was transferred into a 50 mL Teflon-lined stainless steel autoclave for solvothermal treatment under the condition of 180 °C for 48 h. After being cooled down to room temperature, the precipitate was separated by centrifugation and washed several times with ethanol and distilled water. Then the product was dried at 70 °C in air.
Preparation of Au nanoparticle-decorated CdS NWs
Au nanoparticles were decorated on the surface of CdS NWs according to the procedure in the literature.30 In a typical synthesis, 5.0 mg as-prepared CdS NWs were dispersed in the mixture of 60 mL deionized water and 30 mL ethanol under ultrasonic treatment, followed by the addition of 0.5 mL NaOH (0.1 M). Then a certain amount of HAuCl4 (0.5 mM) aqueous solution were added in order to the suspension. After being stirred and kept at 50 °C for about 3 h, the precipitate was collected by centrifugation and washed with deionized water and ethanol several times. Finally, the Au nanoparticle-decorated CdS NWs were obtained by dried at 70 °C for 10 h in air. In order to investigate the effect of content of Au nanoparticles on the gas response of CdS NWs, the different dosage of HAuCl4 (0.1 mL, 0.2 mL and 0.4 mL) was added in the procedure of Au-nanoparticle decoration and the corresponding Au nanoparticle-decorated CdS NWs were denoted as 0.1Au–CdS NWs, 0.2Au–CdS NWs and 0.4Au–CdS NWs, respectively.Characterization
The products were characterized by X-ray diffraction (XRD, Shimadzu XRD-6000, Cu-Kα radiation λ = 1.5418 Å); scanning electron microscopy (SEM, SHIMADZU SSX-550); transmission electron microscope (TEM, JEM-ARM200F), respectively.Fabrication and measurement of gas sensor
To fabricate the gas sensor, the as-prepared materials were mixed with deionized water (the ratio was 100![[thin space (1/6-em)]](https://www.rsc.org/images/entities/char_2009.gif) :
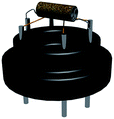
:![[thin space (1/6-em)]](https://www.rsc.org/images/entities/char_2009.gif) 4) forming a paste, which was coated on an alumina ceramic tube. On the surface of the tube, there is a pair of Au electrodes and four Pt wires which were used wedge on the pedestal to conduct. Then, a Ni–Cr alloy through the tube was used as a heater to control the operating temperature. The structure of the sensor is shown in Fig. 1. The details of the sensor fabrication were similar to our previous works.31
4) forming a paste, which was coated on an alumina ceramic tube. On the surface of the tube, there is a pair of Au electrodes and four Pt wires which were used wedge on the pedestal to conduct. Then, a Ni–Cr alloy through the tube was used as a heater to control the operating temperature. The structure of the sensor is shown in Fig. 1. The details of the sensor fabrication were similar to our previous works.31
Gas sensing properties were measured by CGS-8 intelligent gas sensing analysis system (Beijing Elite Tech Co., Ltd., China). The response value (S) was defined as S = Ra/Rg, where Ra and Rg was the sensor's resistance in the air and presence of the target gases. When the target gas was introduced to the sensor (target gas adsorption), the time taken by the sensor to achieve 90% of the total resistance change was defined as response time or the recovery time when the chamber was full of air replacing target gas (target gas desorption).
Result and discussion
Structural and morphological characteristics
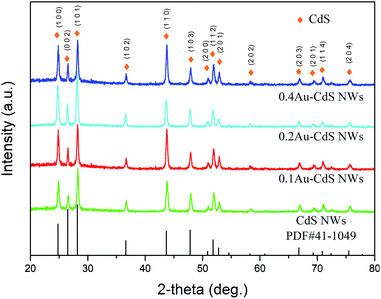
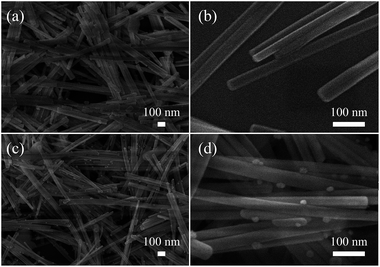
The XRD patterns of the as-prepared materials are shown in Fig. 2. It can be observed that all of the diffraction peaks of the products can be indexed to the CdS which was consistent with the Joint Committee on Powder Diffraction Standards card (JCPDS, 41-1049). Peak of Au is not detected in the Fig. 2, which is reasonable for its little content.The SEM images of the as-prepared CdS NWs and 0.2Au CdS NWs are shown in Fig. 3. Fig. 3(a) and (b) show the typical low- and high-magnification SEM images of CdS NWs with the uniform morphology and smooth surface, and the average diameter was about 30 nm. Fig. 3(c) and (d) shows the SEM images of the 0.2Au–CdS NWs. After Au-nanoparticle decoration, CdS NWs kept the original morphology, and it can be evidently found that the Au nanoparticles with a diameter of 10–25 nm were adhere on the surface of the CdS NWs.
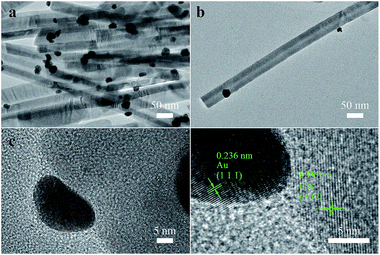
For characterizing the microscopic morphology of 0.2Au–CdS, TEM image and high-resolution TEM (HRTEM) images are showed in Fig. 4. Fig. 4(a) and (b) displays the TEM images of 0.2Au–CdS. The high-resolution TEM (HRTEM) images in Fig. 4(c) further shows the detailed crystallographic structure of 0.2Au–CdS. In Fig. 4(d) which is the partial enlarged picture of Fig. 4(c) at the interface of CdS NW and nanoparticle, the HRTEM image clearly reveals two distinct sets of lattice fringes. The measured interplanar distance of 0.336 nm in the CdS NW region was in good agreement with d spacing of the (002) lattice planes of the hexagonal CdS crystal. While, in nanoparticle region, an interplanar distance of 0.236 nm was observed and it complied with the lattice spacing of (1 1 1) planes of Au, confirming Au nanoparticles were decorated on the surface of CdS NWs.
Gas sensor performance
In order to research the properties of the sensors based on the as-prepared materials, their ethanol sensing properties were investigated.To determine the optimum operating temperature of the sensors, their responses to 100 ppm ethanol at different operating temperature (from 160 °C to 280 °C) were collected. Below 500 °C, the chemical property of CdS is stability as shown in Fig. S1, ESI.† As shown in Fig. 5, the response of sensors to ethanol increased with the augment of operating temperatures and attained the maximum values at a certain operating temperature i.e. the optimal operating temperature, followed by a decrease. As can be seen, all the sensors optimum operating temperatures were suggested 230 °C, and the corresponding responses of the sensors based on pure CdS NWs, 0.1Au–CdS NWs, 0.2Au–CdS NWs and 0.4Au–CdS NWs were 20, 38, 50 and 110, respectively. Among all the sensors, the one based on 0.2Au–CdS NWs showed the highest response to 100 ppm ethanol which was much higher than those of the others. In addition, it is worth noting that, although all the sensors based Au-nanoparticle decorated CdS NWs samples showed enhanced ethanol responses compared with the pure CdS NWs, the overmuch Au-decorating content could lead to a decrease in the enhancement of response caused by Au decoration. Next, the ethanol sensing properties of pure CdS NWs and 0.2Au–CdS NWs were investigated in detail.
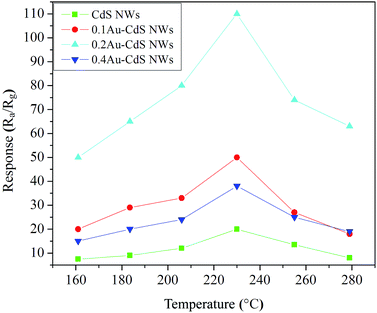 | ||
| Fig. 5 Responses of the sensors based on the samples to 100 ppm ethanol at different operating temperatures. | ||
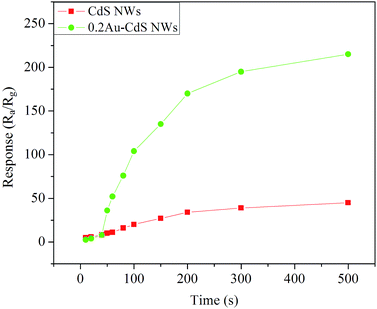
The responses of the sensors based on pure CdS NWs and 0.2Au–CdS NWs versus different concentration (from 10 ppm to 500 ppm) of ethanol at the optimum operating temperature are shown in Fig. 6. According to the curves, it is obviously found that the responses went up accompanying with the increases of ethanol concentration, and gradually leveled off when the ethanol concentration reached to 200 ppm. What's more, 0.2Au–CdS NWs exhibited the much higher responses than those of CdS NWs against ethanol with relatively high concentration (≥50 ppm).
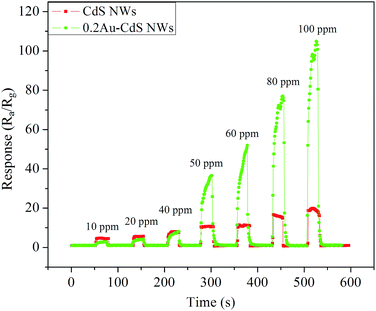
Response and recovery time is an important parameter as for an applied gas sensor. Fig. 7 shows the dynamic response curves of the gas sensors against 10, 20, 40, 50, 60, 80 and 100 ppm ethanol. When the sensors exposed to ethanol ambience the resistance suddenly decrease rapidly, and when the sensors exposed to air ambience, the resistance recover also rapidly. The response time and recovery time of CdS NWs were less than 5 s and 3 s, respectively. For the sensor based on 0.2Au–CdS NWs, when exposed to 50 ppm or higher concentration of ethanol, it spent a little time to obtain the higher response than that of CdS NWs followed by a continued increase and recovered its initial state rapidly. The response time and recovery time of 0.2Au–CdS NWs were less than 15 s and 5 s, respectively.
For the gas sensor application, selectivity is another important property to evaluate the sensing ability of a sensor based on semiconductor materials. The sensors based on CdS NWs and 0.2Au–CdS NWs successively exposed to 100 ppm hydrogen (H2), carbon monoxide (CO), acetone (CH3COCH3), ammonia (NH3), formaldehyde (HCHO), toluene (C6H5CH3), methanol (CH3OH) and ethanol (C2H5OH) at the optimum operating temperature and the corresponding responses were displayed in Fig. 8. Both the CdS NWs and 0.2Au–CdS NWs sensors showed the much higher response to ethanol than those to the other interfering gases, indicating their good selectivity. For 0.2Au–CdS NWs sensor, due to the highly enhanced ethanol response, it showed the more excellent selectivity making it a good candidate for ethanol detection.
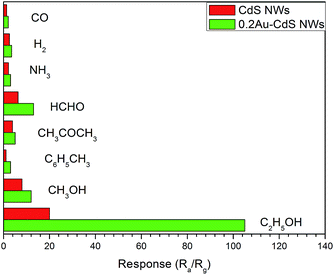 | ||
| Fig. 8 Selectivity of the sensors to 100 ppm hydrogen (H2), carbon monoxide (CO), acetone (CH3COCH3), ammonia (NH3), formaldehyde (HCHO), toluene (C6H5CH3) and methanol (CH3OH), ethanol (C2H5OH). | ||
Gas sensing mechanism
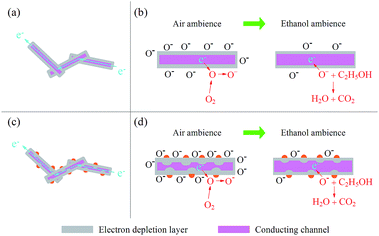
The gas sensing mechanism is explained thought surface-controlled mode, which involves adsorption, electronic transfer and desorption. CdS is an n-type semiconductor and its resistance is mainly determined by the conduction band electrons. The electrons transport along the CdS NWs as shown in Fig. 9(a). When the sensor based on CdS NWs expose to the air, oxygen molecules will adsorb on the surface of CdS NWs and they will capture electrons from the conduction band to form ionized oxygen species (O2−, O−, O2−), which results the formation of electron depletion layer at the surface of CdS NWs, shrinks the conducting channel and as a result makes the sensor show a high resistance (as shown in Fig. 9(b)). The reactions are as follows:32,33| O2(gas) → O2(ads) | (1) |
| O2(ads) + e− → O2(ads)− (T < 100 °C) | (2) |
| O2(ads)− + e− → 2O(ads)− (100 °C < T < 300 °C) | (3) |
| O(ads)− + e− → O(ads)2− (T > 300 °C) | (4) |
O(ads)− is believed to be dominant at the operating temperature (230 °C) of the sensor based on CdS NWs.37,38 When the sensor undergoes ethanol, the oxygen-ions will react with ethanol molecules and the electrons captured from CdS NWs will be released back which shrinks the electron depletion layer, widens the conducting channel and as a result makes a decrease in the resistance of CdS NWs. The reactions are as follows:32–36
| C2H5OH(gas) + O(ads)− → CH3CHO + H2O + e− | (5) |
| CH3CHO(gas) + 5O(ads)− → 2CO2 + 3H2O + 5e− | (6) |
When CdS NWs sensor was put into air ambience, oxygen-ions will form on the surface of CdS NWs again and sensor's resistance recovers to the initial value.
The highly enhanced ethanol-sensing response of Au–CdS NWs can be mainly attributed to catalytic oxidation of ethanol induced by Au nanoparticles. For Au–CdS NWs, the reaction between ethanol and O− spices is promoted, and as a result, a higher response is obtained. Fig. 9(c) illustrates the electronic transmission path within and between Au–CdS NW(s). It has reported that Au nanoparticles can effectively accelerate the transformation of O2 to O− spices which will deepen electron depletion layer (as shown in Fig. 9(d)) and make Au–CdS NWs show a higher atmospheric resistance. In addition, the electron depletion layer introduced by the connection of Au and CdS, as shown in Fig. 9(d) and illustrated in Fig. S2 and S3, ESI,† also contribute to the resistance of Au–CdS NWs. Therefore, when Au–CdS NWs expose to ethanol, a larger resistance change i.e. higher response generates.
Conclusions
In summary, CdS nanowires with an average diameter of 30 nm were synthesized by a facile solvothermal method and Au nanoparticle-decorated CdS NWs (Au–CdS NWs) were prepared by decorating Au nanoparticles with a size of 10–25 nm on the surface of the as-synthesized CdS NWs through a simple deposition process. The ethanol sensing properties of the as-prepared CdS NWs and Au–CdS NWs with different Au content were investigated. The results showed that Au nanoparticle-decoration could enhance the response of CdS NWs and the Au–CdS NWs with a proper Au decorating content (0.2Au–CdS NWs) whose response to 100 ppm ethanol was about 110 (5 times higher than that of the CdS NWs) worked much better than the others. Meanwhile, 0.2Au–CdS NWs showed fast response and recovery rate and excellent selectivity.Acknowledgements
The authors are grateful to National Natural Science Foundation of China (Grant no. 11574110), Project of Science and Technology Plan of Changchun City (Grant no. 14KG020), Opened Fund of the State Key Laboratory on Integrated Optoelectronics and Opened Fund of the State Key Laboratory on Applied Optics.Notes and references
- B. Wang, L. Zhu, Y. Yang, N. Xu and G. Yang, J. Phys. Chem. C, 2008, 112, 6643 CAS.
- P.-C. Chen, G. Shen and C. Zhou, IEEE Trans. Nanotechnol., 2008, 7, 668 CrossRef.
- L. Vayssieres, Adv. Mater., 2003, 15, 464 CrossRef CAS.
- R. Martel, T. Schmidt, H. Shea, T. Hertel and P. Avouris, Appl. Phys. Lett., 1998, 73, 2447 CrossRef CAS.
- S. J. Tans, A. R. Verschueren and C. Dekker, Nature, 1998, 393, 49 CrossRef CAS.
- C. S. Rout, S. H. Krishna, S. Vivekchand, A. Govindaraj and C. Rao, Chem. Phys. Lett., 2006, 418, 586 CrossRef CAS.
- Z. Dai, J. Gole, J. Stout and Z. Wang, J. Phys. Chem. B, 2002, 106, 1274 CrossRef CAS.
- Y.-J. Choi, I.-S. Hwang, J.-G. Park, K. J. Choi, J.-H. Park and J.-H. Lee, Nanotechnology, 2008, 19, 095508 CrossRef PubMed.
- Y. Wang, X. Jiang and Y. Xia, J. Am. Chem. Soc., 2003, 125, 16176 CrossRef CAS PubMed.
- A. Kolmakov, D. Klenov, Y. Lilach, S. Stemmer and M. Moskovits, Nano Lett., 2005, 5, 667 CrossRef CAS PubMed.
- Q. Wan, Q. Li, Y. Chen, T.-H. Wang, X. He, J. Li and C. Lin, Appl. Phys. Lett., 2004, 84, 3654 CrossRef CAS.
- M.-W. Ahn, K.-S. Park, J.-H. Heo, D.-W. Kim, K. J. Choi and J.-G. Park, Sens. Actuators, B, 2009, 138, 168 CrossRef CAS.
- T.-J. Hsueh, C.-L. Hsu, S.-J. Chang and I.-C. Chen, Sens. Actuators, B, 2007, 126, 473 CrossRef CAS.
- K. Huang, Q. Zhang, F. Yang and D. He, Nano Res., 2010, 3, 281 CrossRef CAS.
- L. F. Zhu, J. C. She, J. Y. Luo, S. Z. Deng, J. Chen and N. S. Xu, J. Phys. Chem. C, 2010, 114, 15504 CAS.
- N. Van Hieu, V. Van Quang, N. D. Hoa and D. Kim, Curr. Appl. Phys., 2011, 11, 657 CrossRef.
- T. Gao, Q. Li and T. Wang, Appl. Phys. Lett., 2005, 86, 173105 CrossRef.
- Q. Li, T. Gao and T. Wang, Appl. Phys. Lett., 2005, 86, 193109 CrossRef.
- C. J. Barrelet, Y. Wu, D. C. Bell and C. M. Lieber, J. Am. Chem. Soc., 2003, 125, 11498 CrossRef CAS PubMed.
- H. Zhang, X. Ma, Y. Ji, J. Xu and D. Yang, Chem. Phys. Lett., 2003, 377, 654 CrossRef CAS.
- Y.-W. Jun, S.-M. Lee, N.-J. Kang and J. Cheon, J. Am. Chem. Soc., 2001, 123, 5150 CrossRef CAS PubMed.
- J. Yang, J.-H. Zeng, S.-H. Yu, L. Yang, G.-e. Zhou and Y.-T. Qian, Chem. Mater., 2000, 12, 3259 CrossRef CAS.
- L. Li, P. Wu, X. Fang, T. Zhai, L. Dai, M. Liao, Y. Koide, H. Wang, Y. Bando and D. Golberg, Adv. Mater., 2010, 22, 3161 CrossRef CAS PubMed.
- J. Zhang, F. Jiang and L. Zhang, J. Phys. Chem. B, 2004, 108, 7002 CrossRef CAS.
- R.-M. Ma, L. Dai and G.-G. Qin, Nano Lett., 2007, 7, 868 CrossRef CAS PubMed.
- L. Qi, H. Cölfen and M. Antonietti, Nano Lett., 2001, 1, 61 CrossRef CAS.
- M. A. Correa-Duarte, M. Giersig and L. M. Liz-Marzan, Chem. Phys. Lett., 1998, 286, 497 CrossRef CAS.
- A. Ahmad, P. Mukherjee, D. Mandal, S. Senapati, M. I. Khan, R. Kumar and M. Sastry, J. Am. Chem. Soc., 2002, 124, 12108 CrossRef CAS PubMed.
- N. Hongsith, C. Viriyaworasakul, P. Mangkorntong, N. Mangkorntong and S. Choopun, Ceram. Int., 2008, 34, 823 CrossRef CAS.
- Y.-C. Pu, Y.-C. Chen and Y.-J. Hsu, Appl. Catal., B, 2010, 97, 389 CrossRef CAS.
- D. Jiang, W. Wei, F. Li, Y. Li, C. Liu, D. Sun, C. Feng and S. Ruan, RSC Adv., 2015, 5, 39442 RSC.
- X. Wang, Z. Xie, H. Huang, Z. Liu, D. Chen and G. Shen, J. Mater. Chem., 2012, 22, 6845 RSC.
- X. Fu, J. Liu, Y. Wan, X. Zhang, F. Meng and J. Liu, J. Mater. Chem., 2012, 22, 17782 RSC.
- F. Gaillard, Catal. Lett., 2004, 95, 23–29 CrossRef CAS.
- F. Gaillard, J. Joly, E. Peillex and M. Romand, J. Adhes., 2000, 72, 317 CrossRef CAS.
- D. Puzzovio, M. Carotta, A. Cervi, A. El Hachimi, J. Joly, F. Gaillard and V. Guidi, Solid State Ionics, 2009, 180, 1545 CrossRef CAS.
- Y. Lin, W. Wei, Y. Wang, J. Zhou, D. Sun, X. Zhang and S. Ruan, J. Alloys Compd., 2015, 650, 37 CrossRef CAS.
- J. Zhai, L. Wang, D. Wang, H. Li, Y. Zhang, D. Q. He and T. Xie, ACS Appl. Mater. Interfaces, 2011, 3, 2253 CAS.
Footnote |
| † Electronic supplementary information (ESI) available: Sketch of the change in the energy band of CdS NWs and Au nanoparticle, dynamic resistance curves of the sensors to 100 ppm ethanol. See DOI: 10.1039/c6ra10963b |
| This journal is © The Royal Society of Chemistry 2016 |

