Effective charge separation and enhanced photocatalytic activity by the heterointerface in MoS2/reduced graphene oxide composites

Long Zhang a, Lan Suna, Shuai Liua, Yuhong Huangb, Kewei Xu*ac and Fei Ma*a
aState Key Laboratory for Mechanical Behavior of Materials, Xi'an Jiaotong University, Xi'an 710049, Shaanxi, China. E-mail: mafei@mail.xjtu.edu.cn; kwxu@mail.xjtu.edu.cn; Tel: +86 2982668610
bCollege of Physics and Information Technology, Shaanxi Normal University, Xi'an 710062, Shaanxi, China
cDepartment of Physics and Opt-electronic Engineering, Xi'an University of Arts and Science, Xi'an 710065, Shaanxi, China

Received 27th April 2016 , Accepted 13th June 2016

First published on 13th June 2016


Abstract

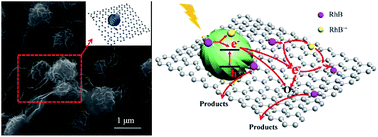
MoS2/reduced graphene oxide (rGO) composites were fabricated via a facile one-step hydrothermal reaction. In the composites, MoS2 clusters composed of several nanosheets are intertwined tightly with rGO sheets. As the amount of rGO in the composites is increased, the crystallinity of MoS2 changes little, but the diameter of MoS2 clusters decreases considerably and they become more dispersive, resulting in a large specific surface area. As compared to the bare MoS2, the as-prepared MoS2/rGO composites exhibit remarkably enhanced light adsorption and photocatalytic activity for the degradation of Rhodamine B (RhB) under visible light irradiation. Photoluminescence (PL) spectra measurements suggest that the enhanced photocatalytic properties can be ascribed to the effective charge separation across the heterointerface in MoS2/rGO composites. It is also demonstrated that the optical and photoelectric properties of two-dimensional (2D) materials could be substantially enhanced by the heterojunction with an appropriate band edge alignment, since they possess the largest specific surface area.


1. Introduction

Environmental pollution and energy crisis are two key issues restricting the rapid development of human society at the current stage. Semiconductor-based photocatalysts have received enormous interest as an effective method to alleviate the environmental deterioration by toxic organic pollutants.1,2 The fundamental requirements for high-efficiency photocatalysts are as follows: (1) large specific surface area so that the organic pollutants can contact with catalysts sufficiently; (2) strong light absorption in the visible range; (3) the photon-generated electron–hole pairs can be separated rapidly.3,4 To this end, nanocomposites with an appropriate band gap and band edge alignment are commonly favored. A great number of research works have been done in this field from both the experimental and theoretical aspects.5,6

As well known, the materials with a band gap of about 1.6 eV are desirable for high-efficient absorption of solar energy. However, it is difficult to find out the suitable materials in nature. In recent years, it has been proved that the band gap of two-dimensional (2D) materials can be considerably tuned through changing the sheet thickness and strain state. For example, the band gap of MoS2 sheets changes from 1.3 eV in bulks to 1.97 eV in single-layer counterpart,7 and few-layer MoS2 exhibits a very high light absorption coefficient up to 7 × 105 cm−1 in the visible wavelength region.8,9 Moreover, 2D materials possess the largest specific surface area and might provide more sites for photocatalytic reaction. Hence, a great number of research works focused on coupling 2D nanosheets of MoS2 or graphene with TiO2,10,11 Bi2MoO6,12,13 Bi2WO6,14 g-C3N4,15,16 ZnO17 and so on to fabricate co-catalysts for photocatalytic degradation of dyes or photocatalytic hydrogen evolution. The results demonstrated that the photo-generated electrons could be easily transferred onto MoS2 or graphene sheets, leading to effective separation of photo-generated electrons and holes, and thus improved photocatalytic performance. Supposing that two kinds of 2D materials are combined into heterojunction with an appropriate band edge alignment, the strong interface effect should enhance the separation of photon-generated electron–hole pairs and the photocatalytic activity more effectively. Meng et al. demonstrated good photocatalytic activity of MoS2 nano-platelets on rGO sheets for hydrogen evolution reaction (HER) which is dominated by the photo-generated electrons.18 It was reported that MoS2/rGO composites are usually p type.18 That is, holes are the majority carriers, and electrons are the minority ones. In the photocatalytic hydrogen evolution reaction, the electrons will be consumed, and light illumination should be continued in order to induce more electrons and holes. Since a great number of holes occupy the states at the top of valence band in p type semiconductor, the optical excitation becomes more and more difficult. However, in the photocatalytic process for degradation of organic pollutants, the holes are consumed, and thus the optical excitation is easier than that in HER process. Hence, the kinetics should be distinct from that in the HER process. Li et al.19 synthesized MoS2/rGO composites via microwave-assisted method and studied photocatalytic degradation of MB under visible light. It was found that MoS2 sheets in the composites exhibited irregularly aggregated morphology and lower crystallinity with a wide full width at half maximum (FWHM) of XRD peaks. As well known, lower crystallinity means that more defects are involved, and they usually act as the centers for the recombination of photo-generated electrons and holes. In such a case, the substantial recombination of photogenerated electrons and holes might take place at the defect centers, and affect the photocatalytic activity to some degree.19,20 So it is still a challenge to fabricate dispersive MoS2/rGO composites with higher crystallinity.

In this work, hydrothermal process is adopted to prepare MoS2/rGO composites at a considerably lowered growth speed. X-ray diffraction (XRD), Raman spectra, X-ray photoelectron spectroscopy (XPS) and high-resolution transmission electron microscopy (HRTEM) are used to characterize the structures of the MoS2/rGO composites. It is found that MoS2 in the as-fabricated samples commonly exhibit dispersive flower-like morphology with enhanced crystallinity and edge-terminated feature, which are tightly intertwined with rGO sheets. The adsorption ability to organic pollutants will be substantially enhanced for the ultra-thin MoS2 nanosheets due to large specific surface area, and the edge-terminated nanosheets could provide more active sites for photo-catalytic degradation. Photoluminescence (PL) spectra, absorption spectra and photocatalytic test are conducted to study the effects of heterogeneous interface on the separation of carriers as well as on the photocatalytic properties, and the physical mechanism is discussed.

2. Experimental details

2.1. Samples preparation

Firstly, 1 mmol Na2MoO4·2H2O and 5 mmol thiourea were dissolved in 60 mL distilled water with magnetic stirring for 30 minutes. Then different amount of GO was dispersed into the above clear solution with sonication for 1 h, resulting in a gray dispersion. Next, the homogeneous solution was transferred into a 100 mL Teflon-lined autoclave and kept at 210 °C for 24 h. The precipitates were collected, washed three times with distilled water followed by ethanol two times, and then dried at 80 °C in a vacuum oven overnight to obtain the MoS2/rGO hybrids. In order to study the effect of the amount of rGO sheets on the growth and photocatalytic activity of MoS2/rGO hybrids, we prepared a series of MoS2/rGO composites using different weight percentages of GO relative to Na2MoO4·2H2O. The samples prepared using 5% and 10% GO are presented in this paper and they are labeled as MoS2/rGO-5 and MoS2/rGO-10. The bare MoS2 was obtained according to the above route for preparation of MoS2/rGO but in the absence of GO.

2.2. Microstructure characterization

XRD (SHIMADZU XRD-7000S diffractometer) was adopted to analyze the phase structure in the as-prepared samples. Scanning electron microscopy (SEM, FEI Quanta 600S) and HRTEM (JEOL JEM 2100F) were adopted to characterize the morphology and heterogeneous interface of the samples. Raman spectra were examined by a Horiba HR800 spectrometer with a 633 nm laser as the excitation light source. N2 adsorption–desorption isotherms were measured on Micromeritics ASAP2010. The specific surface areas were determined from nitrogen adsorption using the Brunauer–Emmett–Teller (BET) method. XPS measurements were performed on Thermo Scientific K-Alpha XPS spectrometer. PL spectra were detected with a PTI QM40 spectrometer using a 532 nm line from a xenon lamp. The UV-vis absorption spectra of samples were measured on a Hitachi U-4100 spectrophotometer.

2.3. Photocatalytic tests

RhB was used as the organic pollutant to evaluate the photocatalytic activity of the samples under visible light illumination by a 1 kW xenon lamp. Firstly, 10 mg photocatalyst was added into 40 mL of 20 mg L−1 RhB solution with ultrasonication for 30 min, and the homogeneous solution was stirred in the dark for 3 h to reach adsorption–desorption equilibrium. Secondly, the photocatalyst was collected from the solution by using the centrifugation method, and then added to 40 mL of 10 mg L−1 RhB solution which is close to the concentration in adsorption–desorption equilibrium. In this way, the real initial concentration of RhB solution at the beginning of degradation could be maintained as a constant value of 10 mg L−1. During the process of degradation reaction, 4 mL mixed solution was taken out for each 30 min, and then the photocatalyst was separated by centrifugation at 8000 rpm for 5 min. The reduction in the concentration of RhB solution was measured by the Hitachi U-4100 UV-vis spectrophotometer. In order to evaluate the stability of photocatalyst, it was collected by centrifugation at 8000 rpm for 5 min after degradation reaction, then washed with deionized water for 3 times to eliminate contaminants on surface, and dried at 80 °C for 6 h for another cycle.

2.4. Photoelectrochemical measurements

The photoelectrodes were prepared by dip-coating method. 4 mg of the samples was suspended in 0.1 mL isopropanol to make a slurry with ultrasonication for 20 min, and the slurry was dip-coated on a 2 cm × 2 cm F-doped SnO2-coated glass (FTO glasses). To attach the samples on FTO glasses, the photoelectrodes were calcined at 500 °C under a constant flow of Ar gas for 1 h. The photoelectrochemical experiments were done in an Autolab PGSTAT 128N electrochemical station with a xenon lamp. The photoelectrodes acted as the working electrode, and a Pt sheet and a saturated calomel electrode (SCE) were used as counter and reference electrode, respectively. 0.5 mol L−1 Na2SO4 solution was used as the electrolyte. Before measurement, the electrolyte was purged with nitrogen for 30 min.

3. Results and discussion

Fig. 1 shows the XRD patterns of the as-synthesized MoS2, MoS2/rGO-5 and MoS2/rGO-10 composites. The diffraction peaks could be perfectly indexed to 2H–MoS2 (JCPDS 37-1492). The strongest peak at 2θ = 14.1° corresponds to (002) crystal plane, indicating a typical lamellar structure along the c axis.20 The FWHM values of (002) peak are 1.14°, 1.17°, and 1.20° for the three samples. The close FWHM values indicate similar crystallinity of MoS2 in all the samples, and the content of rGO hardly affects the crystallinity of MoS2. This is in agreement with the previously reported results.21 As compared to the XRD patterns of MoS2/rGO in ref. 18, the FWHM value in our work is substantially reduced. This indicates improved crystallinity in our samples, and should result in enhanced photocatalytic activity. Fig. S1 shows the XRD patterns of MoS2/rGO-5 composites prepared for a reaction time of 12 h, 18 h, 24 h, and 30 h [ESI]. It also indicates that the reaction time influences the crystallinity of samples little.
image file: c6ra10923c-f1.tif
Fig. 1 XRD patterns of as-prepared MoS2, MoS2/rGO-5 and MoS2/rGO-10 samples.

Fig. 2(a) displays the Raman spectra of the samples. The two dominant peaks at 378 cm−1 and 405 cm−1 correspond to the in-plane E12g and out-of-plane A1g vibration modes in the hexagonal MoS2 lattice, respectively.22 Two peaks at 1334 cm−1 and 1584 cm−1 matching very well to the D- and G-bands of graphene are identified from the Raman spectra of MoS2/rGO-5 and MoS2/rGO-10 samples. The results suggest that the hybrid structure of MoS2 and rGO is successfully fabricated through the one-step method. Furthermore, the relative change of the integrated intensities of E12g and A1g can provide some interesting information about the terminated structure of MoS2.22,23 Fig. 2(b) shows the intensity ratio of E12g and A1g peaks of the as-prepared samples. Obviously, the intensity ratio of the MoS2/rGO composites is lower than that of bare MoS2. The higher intensity ratio of E12g and A1g peaks stands for the formation of surface-terminated terrace structure, the lowered intensity ratio is related to the edge-terminated structure. Hence, the edge-terminated MoS2 nanosheets are preferred in MoS2/rGO-5 and MoS2/rGO-10 composites. In essential, the free energy of the edge sites is higher than that of the terrace sites by 2 orders of magnitude. So the edge-terminated configuration is unstable. But it could be produced in non-equilibrium process.22 In the growth process of MoS2/rGO composites by hydrothermal method, the functional groups on GO nanosheets could promote the nucleation and growth of MoS2. So the growth rate of MoS2 in the solution with GO available is much faster. This facilitates the formation of unstable edge-terminated MoS2.22 The rim and edge sites on MoS2 are considered as the active sites in photo-catalytic degradation of dyes, because they have a strong interaction with dyes molecules via unstable dangling bonds.24,25 So the MoS2 nanosheets with exposed edge sites are critical for photo-catalytic degradation of dyes, and they have also attracted great interests in other fields.26–28


image file: c6ra10923c-f2.tif
Fig. 2 (a) Raman spectra, (b) the intensity ratio of E12g and A1g lattice vibration mode in MoS2, MoS2/rGO-5 and MoS2/rGO-10 samples.

XPS spectra of MoS2/rGO-5 composite as well as those of GO are measured to study the reduction degree of rGO. As shown in Fig. 3(a), the high-resolution XPS spectrum of C 1s in GO can be decomposed into three components: (1) the C–C, C[double bond, length as m-dash]C, or C–H at the binding energy of 284.8 eV; (2) C–OH at 286.7 eV; (3) C–O–C or C[double bond, length as m-dash]O at 288.0 eV characteristic of oxidized state of graphene. The result is consistent with that reported previously.29 The XPS peaks of C 1s, Mo 3d, S 2p in the MoS2/rGO-5 sample can be clearly identified from Fig. 3(b–d), respectively. The high-resolution spectrum of C 1s in Fig. 3(b) can be decomposed into two peaks at 284.8 eV and 286.7 eV, and the peak of oxygen-containing functional groups is substantially reduced as compared to that in Fig. 3(a). So GO has been effectively reduced to rGO during hydrothermal process.30 The Mo 3d spectrum in Fig. 3(c) can be fitted into two peaks at 229.4 eV and 232.6 eV, corresponding to Mo 3d5/2 and Mo 3d3/2, respectively, while the S 2p spectrum in Fig. 3(d) can be resolved into two peaks at 162.3 eV and 163.4 eV. It suggests that Mo4+ and S2− ions are involved in the samples.21 Namely, MoS2/rGO composites are successfully fabricated.


image file: c6ra10923c-f3.tif
Fig. 3 High-resolution XPS spectra: (a) C 1s in the GO sample; (b) C 1s, (c) Mo 3d, and (d) S 2p in the MoS2/rGO-5 composite.

Fig. 4(a–c) show the SEM images of the surface morphologies of MoS2, MoS2/rGO-5 and MoS2/rGO-10 composites, respectively, and Fig. 4(d–f) present the corresponding high-resolution images. As shown in Fig. 4(a) and (d), the bare MoS2 is composed of sphere-like clusters with an average diameter of about 2.34 μm, and the cluster consists of many nanosheets with the thickness of about 20 nm. It is reasonable to deduce that the similar clusters in Fig. 4(b) and (c) are also MoS2, and the thinner chiffon-like sheets must be rGO. As exhibited in Fig. 4(b) and (c), the MoS2 clusters are tightly intertwined with rGO sheets, and the intimate contact makes the electronic interaction between MoS2 and rGO possible.31 The mean diameter of clusters in MoS2/rGO-5 and MoS2/rGO-10 is about 0.93 μm and 0.70 μm, respectively. Notably, as the content of rGO is increased, the diameter of MoS2 clusters gradually decreases and they become more dispersive. The detailed measurements are presented in Fig. S2 and S3. It means that the GO sheets can promote the nucleation of MoS2 but suppress the aggregation of MoS2 clusters. N2 adsorption–desorption isotherm curves are measured and employed to evaluate the specific surface area by BET method. The results are shown in Fig. S4. The specific surface area of MoS2, MoS2/rGO-5, and MoS2/rGO-10 is 2.6 m2 g−1, 23.5 m2 g−1, and 55.8 m2 g−1, respectively. Obviously, the composites have much larger specific surface area as compared to the pure MoS2. The dye molecules can be adsorbed on the dispersive MoS2 clusters easily. Fig. 4(g–i) shows the HRTEM images of the samples. Lamellar structures with an interlayer separation of 0.63 nm can be identified in all the samples, corresponding to the (002) planes of MoS2. The results are in good agreement with the XRD patterns. Furthermore, (002) planes are the exposed facets of MoS2 in the as-synthesized samples. This confirms that the interface between MoS2 and rGO may be formed by (002) planes.


image file: c6ra10923c-f4.tif
Fig. 4 SEM (a–f) and TEM (g–i) images of the samples (MoS2: (a), (d), and (g); MoS2/rGO-5: (b), (e), and (h); MoS2/rGO-10: (c), (f), and (i)).

In order to investigate the growth process of MoS2 on GO sheets, a series of MoS2/rGO-5 samples at different reaction time were prepared, and Fig. S5 shows the SEM images of the morphologies. No particles can be observed on rGO sheets after 1.5 h reaction [Fig. S5(a)]. When the reaction time is elongated to 3 h, a great number of particles with an average diameter of 0.45 μm appear [Fig. S5(b)]. EDS (Energy Dispersive Spectrometer) analysis indicates that the particles are MoS2, as depicted in the inset of Fig. S5(h). It can be seen from Fig. S5 that the MoS2 clusters distinctly grow up with the elongating reaction time, and the separation between nanosheets becomes larger and larger. As shown in Fig. S5(f), the nanosheets of MoS2 clusters prepared at a reaction time of 24 h are more dispersive and bigger than those obtained in other conditions [Fig. S5(b)–(e) and (g)]. So, we choose the samples prepared at a reaction time of 24 h to study the effect of rGO sheets on the photocatalytic activity. The effect of the functional groups of GO on the growth of MoS2 is studied by using graphene sheets as the matrix rather than GO. As shown in Fig. S6, no similar particles are available on graphene sheets after 3 h reaction. It indicates that the functional groups of GO facilitate the nucleation of MoS2, as reported in the other graphene-based composites.32,33 Fig. 5 schematically displays the mechanism for the formation of MoS2/rGO hybrid. When Na2MoO4 is introduced into the suspension of GO sheets, MoO42− will interact with the functional groups of GO, resulting in the selective nucleation of MoS2 on GO sheets.26 This interaction may differ from that in the presence of hexadecyltrimethyl ammonium bromide (CTAB) in which the CTAB usually acts as a bridge to overcome the charge incompatibility between GO and anions.34 During the hydrothermal reaction, H2S is generated through decomposition of CN2H4S at 210 °C and the GO sheets are reduced to rGO by H2S, meanwhile, the MoO42− is transformed into MoS2 clusters. Finally, the flower-like clusters consisting of nanosheets are formed.


image file: c6ra10923c-f5.tif
Fig. 5 Schematic illustration for the synthesis of MoS2/rGO composite.

Fig. 6(a) and (b) present the UV-visible absorption and PL spectra of the samples. According to the previous reports,35 four characteristic excitonic peaks A, B, C, and D can be resolved at 408, 465, 617, and 678 nm from the absorption spectra of MoS2 and are marked by black arrows. Peaks A and B are direct excitonic transitions at the point K in the Brillouin zone due to the spin–orbit splitting of the top of valence band, while peaks C and D are from the deep level in the valence band to conduction band at the point M.35,36 As compared to the bare MoS2, the absorption intensity of MoS2/rGO-5 and MoS2/rGO-10 is significantly enhanced over the entire range of wavelength investigated owing to the intrinsic light absorption of rGO.37 Therefore, the hybrid structure, in particular, the MoS2/rGO-5, is a good harvesting carrier for visible light. The lower absorption of MoS2/rGO-10 as compared with MoS2/rGO-5 may be related to the stronger scattering of light by the excess rGO sheets. PL spectra have been widely employed to probe the transfer behavior of the photo-generated carriers across the interface in the composites.29 As shown in Fig. 6(b), broad and intense emission peaks exist in the PL spectra of MoS2, which can be assigned to a combination of deep level emissions and indirect band-edge recombination in MoS2. However, substantial quenching of PL is observed in MoS2/rGO-5 and MoS2/rGO-10 samples, indicating that the recombination of photo-generated electrons and holes is effectively suppressed by the heterojunction between MoS2 and rGO sheets. This should improve the photocatalytic activity. The remarkable quenching of PL indirectly proves that MoS2 clusters are tightly intertwined with rGO sheets in the composites.


image file: c6ra10923c-f6.tif
Fig. 6 (a) UV-visible absorption and (b) photoluminescence spectra of the as-prepared MoS2, MoS2/rGO-5 and MoS2/rGO-10 samples.

Photocatalytic degradation of RhB in aqueous solution was conducted under visible light irradiation to evaluate the photocatalytic performances of MoS2, MoS2/rGO-5 and MoS2/rGO-10. Since the adsorption of organic molecules on photocatalyst is a key step during photodegradation process, we firstly investigate the adsorption characteristics of RhB on the MoS2, MoS2/rGO-5 and MoS2/rGO-10. Fig. 7(a) displays the adsorption percentage of RhB after reaching the adsorption–desorption equilibrium in the dark. The absorption efficiencies of bare MoS2, MoS2/rGO-5 and MoS2/rGO-10 composites are 24.20%, 55.56% and 71.74%, respectively. Obviously, the MoS2/rGO-5 and MoS2/rGO-10 composites exhibit improved adsorptivity of RhB as compared with the bare MoS2. The enhancement was also observed in TiO2–rGO composites,38 and is mainly due to the strong interaction between RhB molecules and the decorated rGO sheets via a conjugational π–π stacking with a face-to-face orientation.39 As the amount of rGO in the composites is increased, the contribution from the more dispersive MoS2 clusters and nanosheets to the improved adsorptivity is not negligible.


image file: c6ra10923c-f7.tif
Fig. 7 (a) Absorption of RhB after reaching the adsorption equilibrium in the dark, (b) photocatalytic degradation profiles of RhB solution under visible light irradiation, (c) photocatalytic degradation reaction kinetics, and (d) recycling test on the MoS2–rGO-5 composite for degradation of RhB under visible light irradiation.

Commonly, the normalized temporal concentration change (C/C0) of dye solution is proportional to the normalized maximum absorbance (A/A0),40 so the change in concentration of RhB solution can be easily characterized by the absorption spectra of RhB at 553.5 nm. Fig. 7(b) shows the photocatalytic degradation profiles of RhB solution with MoS2, MoS2/rGO-5 and MoS2/rGO-10 under visible light irradiation. It can be found that, after photodegradation for 180 min, the concentration of RhB solution decreases by about 28% in the presence of MoS2, however, the degradation is remarkably enhanced by MoS2/rGO-5 and MoS2/rGO-10 composites. The photocatalytic efficiency is quantitatively evaluated by exploring the kinetic process. In pseudo-first-order kinetics, the photocatalytic degradation process can be described by

 
image file: c6ra10923c-t1.tif(1)
where kapp is the apparent reaction rate constant (in unit of min−1), C0 is the concentration of RhB at the adsorption equilibrium, C is the residual concentration at time t. kapp is calculated by the gradient of ln(C0/C) with respect to time (t).41 The results are shown in Fig. 7(c). The linear fit between ln(C0/C) and reaction time (t) with a slope very close to unity is characteristic of pseudo-first-order reaction kinetics. The kapp of MoS2/rGO-5 and MoS2/rGO-10 is 0.00378 min−1 and 0.00240 min−1, respectively, higher than that of bare MoS2 (0.00184 min−1). Hence, rGO plays a vital role in improving the photocatalytic degradation of RhB. However, the excess rGO in MoS2/rGO-10 samples results in strong light scattering and weak irradiation on MoS2. In such a case, the photocatalytic activity is lowered as compared to MoS2/rGO-5 samples on the contrary.3 It is suggested that an appropriate amount of rGO is desirable in the composites for the best photocatalytic performance. Similar observations have also been reported in TiO2/rGO composites.38 Fig. 7(d) shows four recycling runs tests on the MoS2/rGO-5 composite for degradation of RhB under visible light irradiation. The C/C0 decreases with time in almost the same tendency during the four cycling tests, that is, the photocatalytic activity of the MoS2/rGO-5 composite degrades little. Hence, the MoS2/rGO-5 composite should exhibit excellent stable recycling performance for photocatalytic degradation of organic pollutions.

The photocurrents of MoS2, MoS2/rGO-5 and MoS2/rGO-10 under visible light irradiation were measured through dip-coating the as-prepared samples on FTO electrodes. The potential of the working electrodes against Pt counter electrode was set at 0.8 V. In the photocurrent measurement, when the MoS2/rGO composites are irradiated by visible light, the electrons on the top of valence band of MoS2 will be excited to the bottom of conduction band, and holes are left on valence band, then the electrons and holes will flow towards the opposite directions resulting in electronic current, and the photocurrent response is detectable when the light irradiation is switched on and off. The photocurrent magnitude is related to the separation efficiency of photo-generated electrons and holes. The results are displayed in Fig. 8. An obvious photocurrent response is observed for each switch-on/off event. In contrast, the photocurrent of MoS2/rGO-5 and MoS2/rGO-10 is higher than that of bare MoS2. The improved photoelectric property can be ascribed to the effectively suppressed recombination of photo-generated electrons and holes by the heterojunction between MoS2 and rGO sheets. The MoS2/rGO-5 composites exhibit the fastest and the highest photocurrent response, indicating the superior separation efficiency, which is in good agreement with the results of photo-degradation tests.


image file: c6ra10923c-f8.tif
Fig. 8 Photocurrent responses of MoS2, MoS2/rGO-5 and MoS2/rGO-10 samples.

The energy band alignment and trapping experiments are required to understand the physical mechanism for the enhanced photocatalytic properties. The work function of graphene which is prepared by reduction of GO through a hydrothermal route is 4.40 eV.10 Hence, the conduction band bottom of rGO is at −4.40 eV with respect to the absolute vacuum (AV) level. The electron affinity of MoS2 is 4.3 eV, and thus the conduction band bottom is at −4.3 eV vs. AV level and the valence band top is at −5.5 eV vs. AV level.42 As reported previously,43 the redox potentials vs. normal hydrogen electrode (NHE) of a semiconductor in electrochemical scale can be converted from the values with respect to AV level by:

 
E(NHE) = −E(AV) − 4.50 (2)

So the redox potentials of the conduction band bottom and valence band top of MoS2 is at −0.2 V and 1.0 V vs. NHE, respectively. The top of valence band of MoS2 is more negative than the redox potentials of H2O/˙OH (2.72 V vs. NHE) and OH/˙OH (1.89 V vs. NHE),44 so the ˙OH radicals is not available in the photocatalytic process. As the bottom of conduction band of MoS2 is more positive than the standard redox potential of O2/O2˙ (−0.28 V vs. NHE),12 the photo-generated electrons in MoS2 cannot be trapped by adsorbed O2 to produce O2˙ radical. But the redox potentials of the excited RhB (RhB*) (−1.42 eV) is negative than that of O2/O2˙ (−0.28 V), the energy of photogenerated electrons due to the dye-sensitization effect is enough to trap O2 to produce O2˙ radicals. Therefore, the trapping experiments of O2˙ radicals and holes have been done to detect the active species during photodegradation process and to judge whether the dye-sensitization effect dominates the degradation process. Fig. 9 presents the results. As well known, nitrogen and methanol are commonly used as the scavenger of O2˙ radicals and holes in photocatalytic reaction, respectively. It can be found that the degradation efficiency decreases from 49.56% to 33.33% by 33% if nitrogen gas is bubbled into RhB solution, but to 22.20% by 55% if methanol is introduced into the solution. It means that both O2˙ radicals and photogenerated holes from MoS2 are responsible for the photocatalytic activity, but the holes dominate the degradation process. Accordingly, Fig. 10 schematically illustrates the physical mechanism for enhanced photocatalytic activity of MoS2/rGO composites. Because the energy level of rGO is slightly lower than the conduction band of MoS2, the photo-generated electrons produced in MoS2 will flow onto rGO sheets, and the rGO works as an electron sink to rapidly capture the photo-generated electrons,45 thus the photo-generated holes are left on the MoS2. The heterointerface between MoS2 and rGO effectively retard the recombination of photo-induced electrons–holes pairs in MoS2. Because the photogenerated electrons from MoS2 could not trap O2˙ to produce O2˙ radicals, so the O2˙ radicals should come from the dye-sensitization effect in which the excited dye will supply electrons to graphene and MoS2 sheets without any more reaction.5,10,39 Moreover, the conduction band of MoS2 is higher than that of rGO, the electron transfer from RhB* to rGO is more favorable. But the injected electrons on rGO are easily recombined with RhB˙+ radicals adsorbed on surface.5,39 In spite of this, RhB* adsorbed on MoS2 can provide electrons to MoS2, some electrons will be separated onto graphene by the heterointerface, and some electrons unrecombined with RhB˙+ radicals will trap O2 to produce O2˙ radicals. The heterointerface promotes the separation between the injected electrons and RhB˙+ radicals on MoS2, and enhances the photocatalytic degradation. So the photogenerated holes in MoS2 are mainly responsible for the photocatalytic degradation of RhB, and the sensitization effect of RhB molecules under visible light accelerates the photodegradation process further.


image file: c6ra10923c-f9.tif
Fig. 9 The trapping experiments of O2˙ radicals and holes.

image file: c6ra10923c-f10.tif
Fig. 10 Suggested mechanism for the photocatalytic degradation of RhB by MoS2/rGO composites under visible light irradiation.

4. Conclusions

In summary, we have fabricated MoS2/rGO heterostructures through a facile hydrothermal method. In the composites, MoS2 clusters composed of several nanosheets are intertwined with rGO sheets tightly. As the amount of rGO in the composites is increased, the crystallinity of MoS2 changes little, but the diameter of MoS2 clusters decreases considerably and they become more dispersive, resulting in a large specific surface area. It is found that, as compared to bare MoS2, the as-prepared MoS2/rGO photocatalysts exhibit higher adsorptivity of RhB. The photo-generated holes are mainly responsible for the photocatalytic degradation of RhB and, the electrons from the sensitization effect of RhB molecules under visible light can trap O2 to produce O2˙ radicals and accelerate the photodegradation process. The heterointerface between MoS2 and rGO results in an efficient separation of photo-generated electron–hole pairs in MoS2, and retards the recombination of between the injected electrons and RhB˙+ radicals. Consequently, the photocatalytic activity for degradation of RhB under visible light irradiation is substantially improved. It opens a new avenue for fabrication of heterostructure photocatalyst.

Acknowledgements

This work was jointly supported by National Natural Science Foundation of China (Grant No. 51271139, 51471130, 51302162), Fundamental Research Funds for the Central Universities.

References

  1. L. Liu, W. Yang, Q. Li, S. Gao and J. K. Shang, ACS Appl. Mater. Interfaces, 2014, 6, 5629–5639 Search PubMed.
  2. M. Lu, C. Shao, K. Wang, N. Lu, X. Zhang, P. Zhang, M. Zhang, X. Li and Y. Liu, ACS Appl. Mater. Interfaces, 2014, 6, 9004–9012 Search PubMed.
  3. T. Xu, L. Zhang, H. Cheng and Y. Zhu, Appl. Catal., B, 2011, 101, 382–387 CrossRef CAS.
  4. X. Zhang, B. Zhang, D. Huang, H. Yuan, M. Wang and Y. Shen, Carbon, 2014, 80, 591–598 CrossRef CAS.
  5. Z. Xiong, L. L. Zhang, J. Ma and X. S. Zhao, Chem. Commun., 2010, 46, 6099–6101 RSC.
  6. T. Hua, O. Shuxin, B. Yingpu, N. Umezawa, M. Oshikiri and Y. Jinhua, Adv. Mater., 2012, 24, 229–251 CrossRef PubMed.
  7. A. Splendiani, L. Sun, Y. Zhang, T. Li, J. Kim, C.-Y. Chim, G. Galli and F. Wang, Nano Lett., 2010, 10, 1271–1275 CrossRef CAS PubMed.
  8. K.-K. L. Dung-Sheng Tsai and D.-H. Lien, ACS Nano, 2013, 7, 3905–3911 CrossRef PubMed.
  9. S. Wi, M. Chen, H. Nam, A. C. Liu, E. Meyhofer and X. Liang, Appl. Phys. Lett., 2014, 104, 232103 CrossRef.
  10. J. S. Lee, K. H. You and C. B. Park, Adv. Mater., 2012, 24, 1084–1088 CrossRef CAS PubMed.
  11. M. Shen, Z. Yan, L. Yang, P. Du, J. Zhang and B. Xiang, Chem. Commun., 2014, 50, 15447–15449 RSC.
  12. E. Gao, W. Wang, M. Shang and J. Xu, Phys. Chem. Chem. Phys., 2011, 13, 2887–2893 RSC.
  13. Y. Chen, G. Tian, Y. Shi, Y. Xiao and H. Fu, Appl. Catal., B, 2015, 164, 40–47 CrossRef CAS.
  14. Z. Sun, J. Guo, S. Zhu, J. Ma, Y. Liao and D. Zhang, RSC Adv., 2014, 4, 27963 RSC.
  15. Q. J. Xiang, J. G. Yu and M. Jaroniec, J. Phys. Chem. C, 2011, 115, 7355–7363 CrossRef CAS.
  16. S. W. Hu, L. W. Yang, Y. Tian, X. L. Wei, J. W. Ding, J. X. Zhong and P. K. Chu, Appl. Catal., B, 2015, 163, 611–622 CrossRef CAS.
  17. T. N. Reddy, J. Manna and R. K. Rana, ACS Appl. Mater. Interfaces, 2015, 7, 19684–19690 Search PubMed.
  18. F. Meng, J. Li, S. K. Cushing, M. Zhi and N. Wu, J. Am. Chem. Soc., 2013, 135, 10286–10289 CrossRef CAS PubMed.
  19. J. Li, X. Liu, L. Pan, W. Qin, T. Chen and Z. Sun, RSC Adv., 2014, 4, 9647–9651 RSC.
  20. J. Guo, X. Chen, S. H. Jin, M. M. Zhang and C. H. Liang, Catal. Today, 2015, 246, 165–171 CrossRef CAS.
  21. F. Xiong, Z. Cai, L. Qu, P. Zhang, Z. Yuan, O. K. Asare, W. Xu, C. Lin and L. Mai, ACS Appl. Mater. Interfaces, 2015, 7, 12625–12630 Search PubMed.
  22. D. S. Kong, H. T. Wang, J. J. Cha, M. Pasta, K. J. Koski, J. Yao and Y. Cui, Nano Lett., 2013, 13, 1341–1347 CrossRef CAS PubMed.
  23. F. Li, L. Zhang, J. Li, X. Lin, X. Li, Y. Fang, J. Huang, W. Li, M. Tian, J. Jin and R. Li, J. Power Sources, 2015, 292, 15–22 CrossRef CAS.
  24. M. Daage and R. R. Chianelli, J. Catal., 1994, 149, 414–427 CrossRef CAS.
  25. H. Li, K. Yu, X. Lei, B. Guo, C. Li, H. Fu and Z. Zhu, Dalton Trans., 2015, 44, 10438–10447 RSC.
  26. Y. Li, H. Wang, L. Xie, Y. Liang, G. Hong and H. Dai, J. Am. Chem. Soc., 2011, 133, 7296–7299 CrossRef CAS PubMed.
  27. T. Lin, J. Wang, L. Guo and F. Fu, J. Phys. Chem. C, 2015, 119, 13658–13664 CrossRef CAS.
  28. T. Y. Wang, D. L. Gao, J. Q. Zhuo, Z. W. Zhu, P. Papakonstantinou, Y. Li and M. X. Li, Chem.–Eur. J., 2013, 19, 11939–11948 CrossRef CAS PubMed.
  29. T. Lavanya, K. Satheesh, M. Dutta, N. V. Jaya and N. Fukata, J. Alloys Compd., 2014, 615, 643–650 CrossRef CAS.
  30. M.-Q. Yang, C. Han and Y.-J. Xu, J. Phys. Chem. C, 2015, 119, 27234–27246 CrossRef CAS.
  31. J. Qin, X. Zhang, Y. Xue, N. Kittiwattanothai, P. Kongsittikul, N. Rodthongkum, S. Limpanart, M. Ma and R. Liu, Appl. Surf. Sci., 2014, 321, 226–232 CrossRef CAS.
  32. H. Wang, L.-F. Cui, Y. Yang, H. Sanchez Casalongue, J. T. Robinson, Y. Liang, Y. Cui and H. Dai, J. Am. Chem. Soc., 2010, 132, 13978–13980 CrossRef CAS PubMed.
  33. Y. Liang, H. Wang, H. S. Casalongue, Z. Chen and H. Dai, Nano Res., 2010, 3, 701–705 CrossRef CAS.
  34. Z. Wang, T. Chen, W. Chen, K. Chang, L. Ma, G. Huang, D. Chen and J. Y. Lee, J. Mater. Chem. A, 2013, 1, 2202–2210 RSC.
  35. Z. X. Gan, L. Z. Liu, H. Y. Wu, Y. L. Hao, Y. Shan, X. L. Wu and P. K. Chu, Appl. Phys. Lett., 2015, 106, 233113 CrossRef.
  36. J. P. Wilcoxon, P. P. Newcomer and G. A. Samara, J. Appl. Phys., 1997, 81, 7934 CrossRef CAS.
  37. Y. Hou, Z. Wen, S. Cui, X. Guo and J. Chen, Adv. Mater., 2013, 25, 6291–6297 CrossRef CAS PubMed.
  38. Y. Zhang, Z.-R. Tang, X. Fu and Y.-J. Xu, ACS Nano, 2010, 4, 7303–7314 CrossRef CAS PubMed.
  39. J. Zhang, Z. Xiong and X. S. Zhao, J. Mater. Chem., 2011, 21, 3634–3640 RSC.
  40. J. Du, X. Lai, N. Yang, J. Zhai, D. Kisailus, F. Su, D. Wang and L. Jiang, ACS Nano, 2011, 5, 590–596 CrossRef CAS PubMed.
  41. D. Sarkar, C. K. Ghosh, S. Mukherjee and K. K. Chattopadhyay, ACS Appl. Mater. Interfaces, 2013, 5, 331–337 Search PubMed.
  42. S. McDonnell, A. Azcatl, R. Addou, C. Gong, C. Battaglia, S. Chuang, K. Cho, A. Javey and R. M. Wallace, ACS Nano, 2014, 8, 6265–6272 CrossRef CAS PubMed.
  43. Y. Xu and M. A. A. Schoonen, Am. Mineral., 2000, 85, 543–556 CrossRef CAS.
  44. T. Tachikawa, M. Fujitsuka and T. Majima, J. Phys. Chem. C, 2007, 111, 5259–5275 CrossRef CAS.
  45. H. Yu, J. Tian, F. Chen, P. Wang and X. Wang, Sci. Rep., 2015, 5, 13083 CrossRef CAS PubMed.

Footnotes

Electronic supplementary information (ESI) available: XRD patterns of MoS2/rGO-5 composites prepared in different time, the measurements of the average diameter of MoS2 clusters, the aggregation of MoS2 clusters in MoS2/rGO-5 and MoS2/rGO-10, N2 adsorption–desorption isotherm curves of MoS2, MoS2/rGO-5, and MoS2/rGO-10, SEM images of surface morphologies of MoS2/rGO-5 composites at different reaction time, and the surface morphologies of the composites synthesized by using graphene as the matrix. See DOI: 10.1039/c6ra10923c
Long Zhang and Lan Sun contributed equally to this work.

This journal is © The Royal Society of Chemistry 2016
Click here to see how this site uses Cookies. View our privacy policy here.