Optical detection of small biomolecule thiamines at a micromolar level by highly luminescent lanthanide complexes with tridentate N-heterocyclic ligands†
Ning Dua,
Xue Gaoa,
Jian Songa,
Zhi-Nan Wanga,
Yong-Heng Xing*a,
Feng-Ying Baia and
Zhan Shib
aCollege of Chemistry and Chemical Engineering, Liaoning Normal University, Dalian City, 116029, China. E-mail: xingyongheng2000@163.com
bState Key Laboratory of Inorganic Synthesis and Preparative Chemistry, College of Chemistry, Jilin University, Changchun 130012, P. R. China
First published on 13th July 2016
Abstract
A new series of lanthanide complexes Ln(H2L)(EtOH)(NO3)3 (Ln = La (1), Ce (2), Pr (3), Nd (4), Sm (5), Eu (6), Gd (7), and Tb (8)) have been synthesized by a solution synthetic method, heating in a pyrex flask, from the self-assembly of lanthanide ions (Ln3+) with tridentate N-heterocyclic ligand 2,6-bis(5-methyl-1H-pyrazol-3-yl)pyridine (H2L). These complexes were characterized by elemental analysis, IR spectra, powder X-ray diffraction (PXRD), single-crystal X-ray diffraction, thermal gravimetric analysis (TG) and luminescence spectra. In particular, the complexes Eu(H2L)(EtOH)(NO3)3 (6) and Tb(H2L)(EtOH)(NO3)3 (8) emit strong luminescence with high efficiency. Based on the luminescent properties of the lanthanide complexes, we found that very fast and extremely sensitive optical detection of the thiamines can be achieved for the first time, using the better performing luminescent sensing materials. The quenching constant (KSV) of complex 6 was 9.08 × 10⁵ M−1 for TPP, 4.90 × 10⁵ M−1 for TMP, and 4.17 × 10⁵ M−1 for TCl. The KSV of complex 8 was 1327 M−1 for TPP, 149 M−1 for TMP, and 132 M−1 for TCl. The lower detection limit of complex 6 was 0.029 μM for TPP, 0.027 μM for TMP, and 0.028 μM for TCl, and the highest quenching efficiency was 99.92% for TPP, 99.85% for TMP and 99.82% for TCl. For complex 8, the lower detection limit was 0.090 μM for TPP, 0.278 μM for TMP, and 0.263 μM for TCl, and the highest quenching efficiency was 86% for TPP, 38% for TMP and 35% for TCl. The greater KSV values, the lower detection limits, and the higher quenching efficiencies revealed extremely high sensitivity, showing both complexes 6 and 8 to be some of the best sensitive luminescence based metal–organic detectors of TPP, TMP and TCl. In the meantime, possible energy transfer mechanisms are discussed.
Introduction
Thiamine is a vitamin, also called vitamin B1.1 As one of the important small biomolecules, thiamine is found in many foodstuffs including yeast, cereal grain, bean, nut and meat. Thiamine is also widely distributed in skeletal muscle, heart, liver, kidney and brain tissue of the body. It is often used combination with other B vitamins, and was found in many vitamin B family products. The vitamin B family generally includes vitamin B1 (thiamine), vitamin B2 (riboflavin), vitamin B3 (niacin/niacinamide), vitamin B5 (pantothenic acid), vitamin B6 (pyridoxine), vitamin B12 (cyanocobalamin) and folic acid. People take thiamine supplements for conditions related to low levels of thiamine, including beriberi and inflammation of the nerves associated with pellagra or pregnancy. Thiamine is also used for digestive problems including poor appetite, ulcerative colitis and ongoing diarrhoea. Other uses include AIDS and boosting the immune system, diabetic pain, heart disease, alcoholism, aging, a type of brain damage called cerebellar syndrome, canker sores, vision problems such as cataracts and glaucoma, motion sickness, improving athletic performance etc. Some people use thiamine for maintaining a positive mental attitude, enhancing learning abilities, increasing energy, fighting stress and for preventing memory loss, including for Alzheimer’s disease. Usually, in the vitamin B family, there are three kinds of important thiamines: thiamine bydrochloride (TCl);1,2 thiamine monophosphate chloride (TMP);1–3 thiamine pyrophosphate chloride (TPP)1,4 (Scheme 1). Their coordination complexes with transition metal ions have been reported, such as Cd(HBT)X3·H2O, Hg2X5(HBT) (X = Cl, Br), Pt(HBT)(NO2)3 (HBT = 2-(a-hydroxybenzyl)thiamine);2e [ZnCl3(HOxT)], [CdCl3(HOxT)], [HgCl3(HOxT)] and [PtCl3(HOxT)]·H2O (HOxTCl·HCl = oxythiamine chloride hydrochloride);2c (TMP)(Hg2Br5)·0.5H2O and (TMP)2(Hg3I8);3 [Zn2(TPPH)2Cl2]·4H2O and [Cd2(TPPH)2Cl2]·4H2O;4b K2{[Zn(HETPP)Cl2]2} and K2{[Cd(HETPP)Cl2]2} (HETPP = 2-(α-hydroxyethyl)thiamine pyrophosphate);4c etc.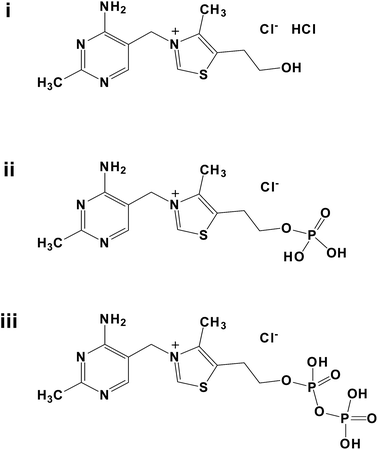 | ||
| Scheme 1 The structure of thiamines: (i) thiamine bydrochloride (TCl); (ii) thiamine monophosphate chloride (TMP); (iii) thiamine pyrophosphate chloride (TPP). | ||
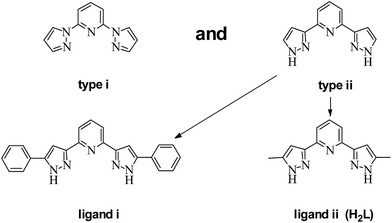
In recent years, extensive investigations in the field of coordination chemistry have been carried out into complexes containing N-heterocyclic ligands (e.g. pyrazole, pyridine, imidazole, etc.) and their derivatives because of their good binding abilities.5 Among these N-heterocyclic ligands, it is worthy to note that the use of rich nitrogen-donor ligands is an effective method to form useful metal–organic complexes, because they can satisfy and even adjust the coordination needs of the metal center.5b,6 The derivatives of 2,6-dis(pyrazolyl)pyridine shown in the Scheme 2 which have five N atoms (one is on the pyridine ring, the other four are on the pyrazolyl rings) are widely studied in coordination chemistry.5b,7 This is because: (i) the ligands are easy to understand; (ii) they are commercially available or straight forward to synthesize; (iii) they can bind to both low-oxidation and high-oxidation state metal ions, generally in a tridentate fashion.5b,6c In particular, the presence of the NH group in 2,6-dis(pyrazol-3-yl)pyridine means that Lewis base donors and Lewis acid acceptors are present simultaneously. Until now, although much work has been focused on the 2,6-dis(pyrazol-3-yl)pyridine ligands to prepare transition metal complexes, a few kinds of crystal structure with 2,6-dis(pyrazol-3-yl)pyridine have been reported, such as [Zn2(HL1)2(μ2-SO4)]2·EtOH·H2O, [Co2(HL1)2(μ2-SO4)]2·2DMF·6H2O, [Zn4(HL1)4(μ4-SO4)][OH]2, [Zn2(HL2)2(μ2-SO4)]·2H2O [Zn-(H2L2)(H2O)2](SO4)·0.87H2O (H2L1 = 2,6-dis(5-phenyl-1H-pyrazol-3-yl)pyridine, H2L2 = 2,6-dis(5-methyl-1H-pyrazol-3-yl)pyridine)5b etc.
Human health is generally always a global issue, and considerable research interest has been paid to the sensitive detection of biomolecules from the human body. As one of the six important nutrients in the body, the detection of vitamins has a great significance. Considering the great influence correlated to human health, qualitatively and quantitatively detecting thiamines is significantly important. Surprisingly, the complexes 6 and 8 could be used as potential molecular recognition probes for the detection of the thiamines. The development of sensors for thiamines is important and interesting. Optical sensing utilizing the change in luminescence readouts induced by sensor–analyte interaction is a powerful detection method.8 The choice of sensing materials is central to achieving effective detection of the targeted analyte.8a,9 H2L is an electron-rich N-heterocyclic ligand, which has a certain weak interaction with small biomolecules which contain positive charges. Therefore, the luminescent signal of the lanthanide complexes containing N-heterocyclic ligands (H2L) can be affected by a small biomolecule which contains positive charge. Until now, no luminescent materials of lanthanide complexes for the detection of thiamines have been reported. Because it was found that the lanthanide complexes with N-heterocyclic ligand (H2L) have stronger luminescent properties, we utilized this feature to detect the thiamines.10 This provided some important information for investigating the interaction between a series of the lanthanide complexes and the thiamines.
Here, we present a series of the lanthanide complexes Ln(H2L)(EtOH)(NO3)3 (Ln = La (1), Ce (2), Pr (3), Nd (4), Sm (5), Eu (6), Gd (7), and Tb (8)). These complexes were characterized by single-crystal X-ray diffraction, IR spectra, XRD analysis, luminescence spectra and thermal properties. In addition, in order to further extend application of the detecting biomolecule based on the lanthanide complexes with N-heterocyclic ligand (H2L), studies on the family of the lanthanide complexes for sensing thiamines have been developed for its quick response and high sensitivity.
Experimental
Materials and methods
Elemental analysis was performed with a PE 240C automatic analyzer (Perkin-Elmer, Waltham, MA). IR spectra were determined with a FT/IR-480 PLUS Fourier Transform spectrometer (JASCO, Tokyo, Japan) (200–4000 cm−1, with pressed KBr pellets). Thermogravimetric analyses (TG) were performed on a Perkin Elmer Diamond TG/DTA under atmosphere from 30 to 1000 °C with a heating rate of 10 °C min−1. The luminescence spectra were determined with an F-4600 spectrofluorimeter (JASCO, Tokyo, Japan) (200–800 nm). The absorption spectra were determined with an UV-1000 spectrometer. Powder X-ray diffraction patterns were obtained on a Bruker Advance-D8 equipped with Cu Kα radiation, in the range 5° < 2θ < 60°, with a step size of 0.02° (2θ) and an count time of 2 s per step. All chemicals used were analytical grade.Synthesis of the complexes
A mixture of Ln(NO3)3·6H2O (0.10 mmol, Ln = La, Ce, Pr, Nd, Sm, Eu, Gd, Tb), H2L (0.0100 g, 0.04 mmol), dodecanedioic acid (0.0120 g, 0.05 mmol), and EtOH (6 ml) was put in a pyrex flask and stirred for 2 h at room temperature. Then, the solution was kept at 80 °C for a further 2 h, followed by slow cooling to room temperature. Yellow block crystals were obtained. Detailed analysis data are as follows:X-ray crystallographic determination
Suitable single crystals of the eight complexes were mounted on glass fibers for X-ray measurement. Reflection data were collected at room temperature on a Bruker AXS SMARTAPEX II CCD diffractometer with graphite monochromatized Mo Kα radiation (λ = 0.71073 Å). All the measured independent reflections (I > 2σ(I)) were used in the structural analyses, and semi-empirical absorption corrections were applied by an SADABS program.11 Crystal structures were solved by the direct method using SHELXL-97.12 All nonhydrogen atoms were refined anisotropically. Hydrogen atoms on carbon and nitrogen were fixed at calculated positions and refined using a riding model. Hydrogen atoms of coordination EtOH molecules were found in the difference Fourier map. Crystal data and details of the data collection and the structure refinement are given in Table 1 and 2. The selected bond lengths and angles around metal atoms of the complexes 1–8 are listed in Table S1.† Hydrogen bond lengths (Å) and angles (°) for the complexes 1–8 are listed in Table S2.†| a R = Σ‖F0| − |Fc‖/Σ|F0|, wR2 = [Σw(F02 − Fc2)2/Σw(F02)2]1/2; [F0 > 4σ(F0)].b Based on all data. | ||||
|---|---|---|---|---|
| Complexes | 1 | 2 | 3 | 4 |
| Formula | C15H19N8O10La | C15H19N8O10Ce | C15H19N8O10Pr | C15H19N8O10Nd |
| M (g mol−1) | 610.29 | 611.50 | 612.29 | 615.62 |
| Crystal system | Triclinic | Triclinic | Triclinic | Triclinic |
| Space group | P![[1 with combining macron]](https://www.rsc.org/images/entities/char_0031_0304.gif) |
P![[1 with combining macron]](https://www.rsc.org/images/entities/char_0031_0304.gif) |
P![[1 with combining macron]](https://www.rsc.org/images/entities/char_0031_0304.gif) |
P![[1 with combining macron]](https://www.rsc.org/images/entities/char_0031_0304.gif) |
| a (Å) | 9.8400(6) | 9.8357(11) | 9.8334(6) | 9.847(3) |
| b (Å) | 10.5881(6) | 10.5776(12) | 10.5636(7) | 10.559(3) |
| c (Å) | 11.9083(7) | 11.8760(13) | 11.8353(8) | 11.810(4) |
| α (°) | 101.3140(10) | 101.212(2) | 101.1470(10) | 100.957(5) |
| β (°) | 111.1760(10) | 111.261(2) | 111.3090(10) | 111.374(4) |
| γ (°) | 93.0810(10) | 93.071(2) | 93.0680(10) | 93.104(5) |
| V (Å3) | 1123.84(11) | 1119.0(2) | 1113.40(13) | 1112.4(6) |
| Z | 2 | 2 | 2 | 2 |
| Dcalc (g cm−3) | 1.803 | 1.815 | 1.826 | 1.838 |
| Crystal size (mm) | 0.58 × 0.32 × 0.18 | 0.53 × 0.43 × 0.27 | 0.51 × 0.47 × 0.24 | 0.57 × 0.46 × 0.21 |
| F(000) | 604 | 606 | 608 | 610 |
| μ(Mo-Kα)/mm−1 | 1.969 | 2.103 | 2.257 | 2.403 |
| θ (°) | 1.89–28.40 | 1.89–28.39 | 1.90–28.37 | 1.90–24.99 |
| Reflections collected | 8491 | 8380 | 8277 | 5625 |
| Independent reflections (I > 2σ(I)) | 5601(4880) | 5551(5044) | 5516(4967) | 3885(3493) |
| Parameters | 323 | 323 | 323 | 323 |
| Limiting indices | −13 ≤ h ≤ 13 | −13 ≤ h ≤ 9 | −13 ≤ h ≤ 6 | −10 ≤ h ≤ 11 |
| −14 ≤ k ≤ 13 | −14 ≤ k ≤ 14 | −14 ≤ k ≤ 13 | −10 ≤ k ≤ 12 | |
| −10 ≤ l ≤ 15 | −13 ≤ l ≤ 15 | −15 ≤ l ≤ 15 | −14 ≤ l ≤ 12 | |
| Goodness of fit | 1.032 | 1.059 | 1.036 | 1.000 |
| R1a | 0.0309(0.0379)b | 0.0257(0.0300)b | 0.0276(0.0325)b | 0.0244(0.0300)b |
| wR2a | 0.0646(0.0682)b | 0.0613(0.0636)b | 0.0654(0.0686)b | 0.0544(0.0558)b |
| Δ(ρ) (e Å−3) | 0.619 and −0.362 | 0.722 and −0.459 | 1.082 and −0.401 | 0.567 and −0.390 |
| a R = Σ‖F0| − |Fc‖/Σ|F0|, wR2 = [Σw(F02 − Fc2)2/Σw(F02)2]1/2; [F0 > 4σ(F0)].b Based on all data. | ||||
|---|---|---|---|---|
| Complexes | 5 | 6 | 7 | 8 |
| Formula | C15H19N8O10Sm | C15H19N8O10Eu | C15H19N8O10Gd | C15H19N8O10Tb |
| M (g mol−1) | 621.74 | 623.34 | 628.63 | 630.31 |
| Crystal system | Triclinic | Triclinic | Triclinic | Triclinic |
| Space group | P![[1 with combining macron]](https://www.rsc.org/images/entities/char_0031_0304.gif) |
P![[1 with combining macron]](https://www.rsc.org/images/entities/char_0031_0304.gif) |
P![[1 with combining macron]](https://www.rsc.org/images/entities/char_0031_0304.gif) |
P![[1 with combining macron]](https://www.rsc.org/images/entities/char_0031_0304.gif) |
| a (Å) | 9.8205(15) | 9.8278(17) | 9.8238(6) | 9.8370(10) |
| b (Å) | 10.5371(16) | 10.5328(17) | 10.5226(6) | 10.5202(11) |
| c (Å) | 11.7288(18) | 11.7056(19) | 11.6761(7) | 11.6498(12) |
| α (°) | 100.895(2) | 100.796(2) | 100.6990(10) | 100.558(2) |
| β (°) | 111.404(2) | 111.442(2) | 111.4740(10) | 111.491(2) |
| γ (°) | 92.993(2) | 93.031(2) | 92.9820(10) | 92.907(2) |
| V (Å3) | 1099.8(3) | 1098.1(3) | 1094.13(11) | 1093.6(2) |
| Z | 2 | 2 | 2 | 2 |
| Dcalc (g cm−3) | 1.877 | 1.885 | 1.908 | 1.914 |
| Crystal size (mm) | 0.56 × 0.49 × 0.23 | 0.52 × 0.39 × 0.12 | 0.54 × 0.34 × 0.14 | 0.45 × 0.32 × 0.19 |
| F(000) | 614 | 616 | 618 | 620 |
| μ(Mo-Kα)/mm−1 | 2.740 | 2.926 | 3.101 | 3.304 |
| θ (°) | 1.91–28.40 | 1.99–25.00 | 1.92–24.99 | 1.99–25.00 |
| Reflections collected | 8268 | 5573 | 5524 | 5634 |
| Independent reflections (I > 2σ(I)) | 5459(4939) | 3838(3557) | 3818(3495) | 3828(3556) |
| Parameters | 323 | 323 | 323 | 325 |
| Limiting indices | −13 ≤ h ≤ 11 | −11 ≤ h ≤ 10 | −6 ≤ h ≤ 11 | −11 ≤ h ≤ 11 |
| −14 ≤ k ≤ 13 | −12 ≤ k ≤ 11 | −12 ≤ k ≤ 11 | −12 ≤ k ≤ 11 | |
| −15 ≤ l ≤ 15 | −13 ≤ l ≤ 10 | −13 ≤ l ≤ 10 | −13 ≤ l ≤ 10 | |
| Goodness of fit | 1.035 | 1.036 | 1.034 | 1.036 |
| R1a | 0.0267(0.0315)b | 0.0225(0.0255)b | 0.0205(0.0248)b | 0.0206 (0.0240)b |
| wR2a | 0.0610(0.0639)b | 0.0540(0.0550)b | 0.0481(0.0491)b | 0.0460(0.0469)b |
| Δ(ρ) (e Å−3) | 0.632 and −0.333 | 0.509 and −0.365 | 0.572 and −0.371 | 0.504 and −0.290 |
Results and discussion
Synthesis
To obtain a deep insight of the influence of the N-heterocyclic ligands on the architectures of lanthanide complexes, we chose to further investigate using Ln(NO3)3·6H2O (Ln = La, Ce, Pr, Nd, Sm, Eu, Gd, Tb) as the starting metal materials, and an N-heterocyclic compound (H2L) as an organic ligand. As the H2L has a high solubility in EtOH, we chose EtOH as the solvent in the reaction system. Eight new complexes have been synthesized by the reaction of mixing Ln(NO3)3·6H2O and the N-heterocyclic ligand (H2L) in the EtOH solvent, and heating in a pyrex flask at 80 °C for two hours. In order to obtain the complexes with more complicated structures and dimensions, which have potential applications in the functional materials field, we try to add dodecanedioic acid to this reaction system as the auxiliary ligand for modifying electron structural characterization. We expected that both the N-heterocyclic ligand (H2L) and dodecanedioic acid could coordinate to Ln3+ forming rigid-flexible mixed lanthanide complexes as we designed previously. However, the reaction results show that only Ln–H2L complexes were obtained. It is indicated that the coordination capability of the N-heterocyclic ligand (H2L) is obviously stronger than that of dodecanedioic acid in the system above. It is worth mentioning that only with dodecanedioic acid in this reaction system, were the desired complexes obtained with good yields. It seems that dodecanedioic acid is an effective structure directing agent during the preparation of the complexes.Description of the crystal structures
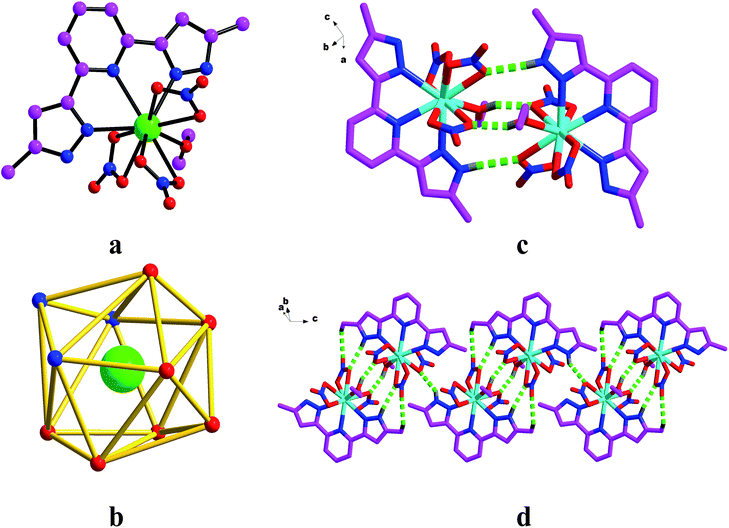
X-ray diffraction analysis revealed that the complexes 1–8 crystallized in the Triclinic space group P![[1 with combining macron]](https://www.rsc.org/images/entities/char_0031_0304.gif) (Fig. 1a). The molecular structure of the complexes consisted of one Ln atom, one H2L ligand, one EtOH ligand, and three coordination NO3− anions. The Ln atom is ten-coordinated by three nitrogen atoms (N2, N3 and N4) from the H2L ligand with bond lengths of Ln–NH2L in the range of 2.554(2)–2.643(2) Å, six oxygen atoms (O1, O2, O4, O5, O7 and O8) from the three coordination NO3− anions with the bond distances in the range of 2.473(2)–2.645(2) Å, one oxygen atom (O10) from the EtOH ligand with a bond length of 2.459(19) Å, to form a slightly distorted bicapped square antiprism polyhedron configuration (Fig. 1b). In the structure, the H2L ligand adopts tridentate chelation coordination in a μ1–η1–η1–η1 fashion.
(Fig. 1a). The molecular structure of the complexes consisted of one Ln atom, one H2L ligand, one EtOH ligand, and three coordination NO3− anions. The Ln atom is ten-coordinated by three nitrogen atoms (N2, N3 and N4) from the H2L ligand with bond lengths of Ln–NH2L in the range of 2.554(2)–2.643(2) Å, six oxygen atoms (O1, O2, O4, O5, O7 and O8) from the three coordination NO3− anions with the bond distances in the range of 2.473(2)–2.645(2) Å, one oxygen atom (O10) from the EtOH ligand with a bond length of 2.459(19) Å, to form a slightly distorted bicapped square antiprism polyhedron configuration (Fig. 1b). In the structure, the H2L ligand adopts tridentate chelation coordination in a μ1–η1–η1–η1 fashion.
For complexes 3 and 5–8, the adjacent asymmetric units are connected to form dimers (Fig. 1c) by hydrogen bonds (O–H⋯O and N–H⋯O). Meanwhile adjacent asymmetric units are linked to form 1D chains (Fig. 1d) though hydrogen bonds (O–H⋯O, N–H⋯O and C–H⋯O) for complexes 1, 2 and 4.
The IR spectra of the complexes 1–8 are similar, so that of complex 5 (Fig. S1†) is taken as an example. In the IR spectrum of the complex 5, absorption bands at 3422 and 3347 cm−1 were assigned to the stretching vibrations of the N–H in the pyrazolyl rings and the O–H in EtOH. Weak absorption bands at 3090 and 3080 cm−1 were assigned to the stretching vibrations of the C–H in the pyridine/pyrazolyl rings. Weak absorption bands observed at 2929 and 2854 cm−1 are the feature of the νC–H vibration modes of –CH3 groups. The bands at 1638, 1570, 1510, 1471, and 1442 cm−1 are attributed to the characteristic stretching vibrations of the pyrazolyl and pyridine rings. The detailed assignment of the other seven complexes are listed in Table S3.†
The complexes 1–8 were confirmed by elemental analysis and IR spectra, and additionally powder X-ray diffraction (PXRD), to be a phase purity of the bulk samples. As shown in Fig. S2,† all the peaks presented in the measured patterns closely match the simulated pattern generated from single crystal diffraction data.
To examine the thermal stability of the complexes 1–8, thermal gravimetric analysis (TG) was carried out at a heating rate of 10 °C min−1 under the conditions of N2 atmosphere with the temperature range from 30 to 1000 °C. The TG curve of the complex 1 is divided into three steps (Fig. S3†). The first step weight loss of 7.55% in the range of 70 to 240 °C should be attributed to one EtOH molecule. The second step weight loss occurs in the range of 240–410 °C, with a percentage weight loss of 26.55%, which is ascribed to the release of three coordination NO3− anions. The last step of decomposition occurred within the range of 410 to 1000 °C, which is considered to be the loss of one H2L ligand, and the final residue corresponds to LaO1.5 and some remaining composition of carbon. The TG curves of the complexes 2–8 are similar to that of the complex 1.
Lanthanide contraction
By comparison and analysis the lattice parameters, the volume of the crystal cell, and the Ln–Oave (average value of O1, O2, O4, O5, O7 and O8), Ln–O10, Ln–Nave (average value of N2 and N4) and Ln–N3 bonds lengths for the complexes 1–8, most of the data show a trend of decrease with the increase of atomic sequence number from lanthanum to terbium. The correlation between the parameters and the atomic sequence number was tested statistically, the results of which are shown in Fig. S4.† The parameters linearly decreased as a function of increasing atomic sequence number. Although the relationship plot of the lattice parameter “A” is not linear, it still presents a decreasing trend with increasing atomic sequence number. These phenomena can be regarded as a direct consequence of the so-called “lanthanide contraction”.13 It is proved that the ten-coordinated structure of the complexes 1–8 display the phenomena of “lanthanide contraction”.Luminescence spectra
It is widely acknowledged that efficient lanthanide luminescence in metallic–organic complexes is typically accomplished through the use of organic ligands which efficiently transfer the energy gained through photon absorption to the Ln atoms in the complexes. The process is as follows: firstly, via absorbing energy, organic ligands are transferred from their ground state to the excited singlet state, and then to the excited triplet state by means of intersystem crossing. Afterwards, the important energy transfer occurs from the organic ligands’ triplet excited state to the Ln atoms’ emissive state.15 Finally, lanthanide atoms emit light in the form of radiation, so-called luminescence, from the emissive state to the low state (or ground state).14The luminescence of the lanthanide–organic complexes is currently drawing significant attention in the development of the luminescent materials.16 Therefore, it is necessary to perform a systematic investigation of the luminescence with regard to the lanthanide complexes. Owing to the excellent luminescent properties of Sm(III), Eu(III) and Tb(III), the luminescence behaviors of complexes 5, 6 and 8 were investigated in the form of solid state samples at room temperature.17
With regard to the luminescence characteristics of samarium complexes, the luminescence spectrum of complex 5 was analyzed under an excitation wavelength of 380 nm with slit width (5![[thin space (1/6-em)]](https://www.rsc.org/images/entities/char_2009.gif) :
:![[thin space (1/6-em)]](https://www.rsc.org/images/entities/char_2009.gif) 5) and Fig. 2a displays the typical emission peaks of Sm(III) ions. The four characteristic peaks of Sm(III) ions originated from the transition from the 4G5/2 state to the 6HJ (J = 5/2, 7/2, 9/2, 11/2) at about 562, 596, 645, and 714 nm, respectively. Among the two magnetic dipole allowed transitions 4G5/2 → 6H5/2 and 4G5/2 → 6H7/2, the former has a predominant magnetic dipole character. The difference in the intensity of the electric dipole allowed transition 4G5/2 → 6H9/2 and the magnetic dipole 4G5/2 → 6H5/2 transition, supporting a moderate polarizable environment. The relative intensity of the 4G5/2 → 6H5/2, 6H7/2 and 6H9/2 transitions vary significantly across Sm(III) complexes, their ratio may be informative for the polarizability effect.
5) and Fig. 2a displays the typical emission peaks of Sm(III) ions. The four characteristic peaks of Sm(III) ions originated from the transition from the 4G5/2 state to the 6HJ (J = 5/2, 7/2, 9/2, 11/2) at about 562, 596, 645, and 714 nm, respectively. Among the two magnetic dipole allowed transitions 4G5/2 → 6H5/2 and 4G5/2 → 6H7/2, the former has a predominant magnetic dipole character. The difference in the intensity of the electric dipole allowed transition 4G5/2 → 6H9/2 and the magnetic dipole 4G5/2 → 6H5/2 transition, supporting a moderate polarizable environment. The relative intensity of the 4G5/2 → 6H5/2, 6H7/2 and 6H9/2 transitions vary significantly across Sm(III) complexes, their ratio may be informative for the polarizability effect.
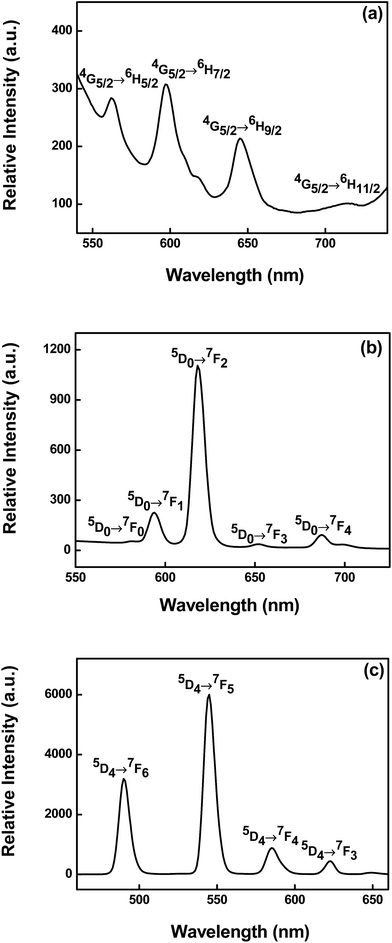 | ||
| Fig. 2 Room-temperature solid-state luminescence emission spectra: (a) for complex 5 (λex = 380 nm); (b) for complex 6 (λex = 370 nm); (c) for complex 8 (λex = 350 nm). | ||
Regarding the luminescence properties of europium, complex 6 was studied at an excitation wavelength of 370 nm with slit width (5![[thin space (1/6-em)]](https://www.rsc.org/images/entities/char_2009.gif) :
:![[thin space (1/6-em)]](https://www.rsc.org/images/entities/char_2009.gif) 5) and Fig. 2b gives the emission spectrum of complex 6. The characteristic 5D0 → 7FJ (J = 1–4) transitions of Eu(III) ions in 593, 618, 652, and 687 nm show efficient ligand-to-Eu energy transfer. The fairly weak emission band 5D0 → 7F0 at 581 nm is attributed to the symmetry-forbidden emission of the Eu(III) ions in the complex 6. The emission band 5D0 → 7F1 pertained to the prominent magnetic dipole transition, which is almost influenced by the coordination environment. On the other hand, the outstanding 5D0 → 7F2 emission band, possessing strong electric dipole character, is hypersensitive to the coordination environment. Herein Eu(III) ions luminescence can act as a sensitive probe of the lanthanide coordination environment.14,18 In particular, the ratio of the intensity (5D0 → 7F2)
5) and Fig. 2b gives the emission spectrum of complex 6. The characteristic 5D0 → 7FJ (J = 1–4) transitions of Eu(III) ions in 593, 618, 652, and 687 nm show efficient ligand-to-Eu energy transfer. The fairly weak emission band 5D0 → 7F0 at 581 nm is attributed to the symmetry-forbidden emission of the Eu(III) ions in the complex 6. The emission band 5D0 → 7F1 pertained to the prominent magnetic dipole transition, which is almost influenced by the coordination environment. On the other hand, the outstanding 5D0 → 7F2 emission band, possessing strong electric dipole character, is hypersensitive to the coordination environment. Herein Eu(III) ions luminescence can act as a sensitive probe of the lanthanide coordination environment.14,18 In particular, the ratio of the intensity (5D0 → 7F2)![[thin space (1/6-em)]](https://www.rsc.org/images/entities/char_2009.gif) :
:![[thin space (1/6-em)]](https://www.rsc.org/images/entities/char_2009.gif) (5D0 → 7F1) transition is very sensitive to the symmetry of the Eu(III) ion center. In the spectrum, it can be obviously seen that the intensity of the electric dipole transition 5D0 → 7F2 is much stronger than that of the magnetic dipole transition 5D0 → 7F1, which implies that the Eu(III) ions in complex 6 are located in a lower symmetric coordination environment. This can be confirmed by analysis of the single crystal diffraction data. Among these emission lines, the 5D0 → 7F2 transition is most striking, indicating intense red luminescence of complex 6.
(5D0 → 7F1) transition is very sensitive to the symmetry of the Eu(III) ion center. In the spectrum, it can be obviously seen that the intensity of the electric dipole transition 5D0 → 7F2 is much stronger than that of the magnetic dipole transition 5D0 → 7F1, which implies that the Eu(III) ions in complex 6 are located in a lower symmetric coordination environment. This can be confirmed by analysis of the single crystal diffraction data. Among these emission lines, the 5D0 → 7F2 transition is most striking, indicating intense red luminescence of complex 6.
The emission spectrum of the terbium complex was determined using excitation wavelength at 350 nm with slit width 5![[thin space (1/6-em)]](https://www.rsc.org/images/entities/char_2009.gif) :
:![[thin space (1/6-em)]](https://www.rsc.org/images/entities/char_2009.gif) 5 and the Tb(III) ions emission spectrum of complex 8 is illustrated in Fig. 2c. As expected, four emission peaks at 490, 545, 584 and 622 nm are attributed to the characteristic emission of Tb(III) ion transition from the emissive state 5D4 to the ground state 7FJ (J = 6 → 3), respectively. The spectrum is dominated by the 5D4 → 7F5 transition at 545 nm which creates the intense green luminescence output for the solid state sample of complex 8.
5 and the Tb(III) ions emission spectrum of complex 8 is illustrated in Fig. 2c. As expected, four emission peaks at 490, 545, 584 and 622 nm are attributed to the characteristic emission of Tb(III) ion transition from the emissive state 5D4 to the ground state 7FJ (J = 6 → 3), respectively. The spectrum is dominated by the 5D4 → 7F5 transition at 545 nm which creates the intense green luminescence output for the solid state sample of complex 8.
Detecting thiamines by the luminescence response of the lanthanide complexes
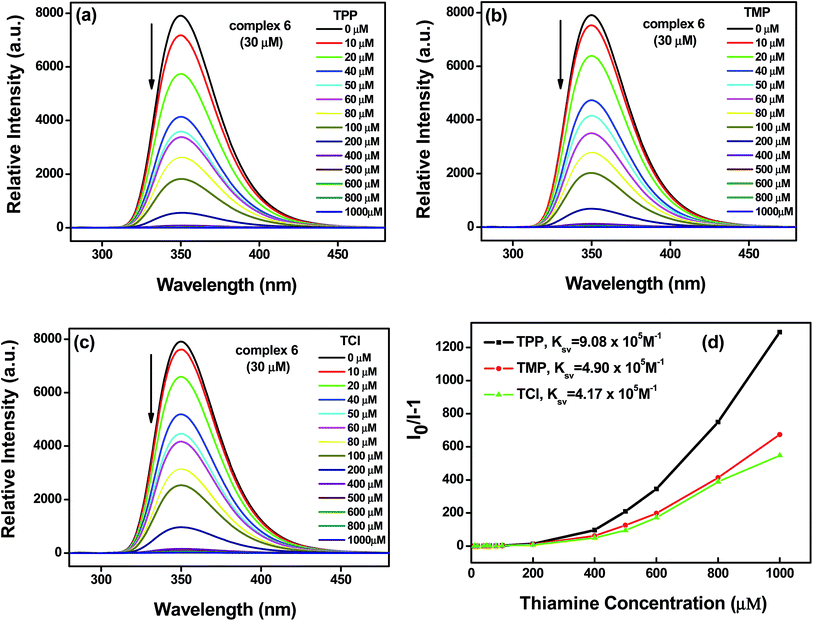
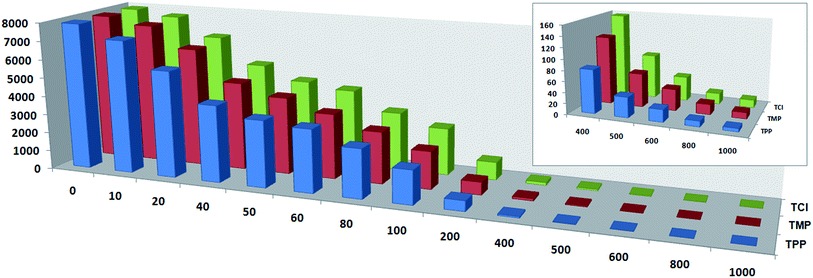
Thiamine detection was achieved by monitoring the change of the lanthanide complex luminescence signal. Upon addition of the thiamines, the emission peak intensity of complexes 6 and 8 decreased to some extent. Fig. 3 and 6 demonstrate the degree of luminescence quenching as a function of the thiamine concentration.Compared with the luminescent spectrum of complex 6 in the solid state, the emission peak intensity and position in the solution was changed obviously due to the solvent effect. To investigate the identifying ability of complex 6 as a thiamine sensing material, thiamines (TPP, TMP, TCl) were added into the solution of complex 6 to check their luminescence emission peak intensity, respectively. We found that the thiamines have a significant effect on the luminescence emission peak intensity of complex 6. To further examine the sensing sensitivity of the thiamines in more detail, a series of water solutions of complex 6 (fixed concentration 30 μM) with the thiamines (different concentration 10–1000 μM) were prepared. The research results showed that the emission peak intensity decreased with increasing concentration of the thiamines. Fig. 3a–c shows the emission band in higher energy (350 nm), generally observed due to π* → n and π* → π transitions of the H2L ligand. The emission peak intensity decreases regularly with increasing concentration (up to 1000 μM) of the thiamines (TPP, TMP, TCl), which quenched nearly 99.92%, 99.85% and 99.82% of the initial luminescence intensity, respectively. Corresponding histograms indicate the luminescence intensity (monitored at 350 nm) after addition of the analyte (thiamines) and are shown in Fig. 4.
The detection limit of complex 6 for the thiamines is calculated by following equation:
| Detection limit = 3σ/k | (1) |
Where, k represents the slope between the luminescence intensity vs. log[thiamines]; σ represents the standard deviation of blank determination. The detection limit of complex 6 is calculated to be 0.029 μM for TPP, 0.027 μM for TMP, and 0.028 μM for TCl. The lower detection limits indicate the feasibility and sensitivity of complex 6 to detect biological molecule thiamines.
To furthermore understand the luminescence sensitivity, the quenching efficiency was quantified using the Stern–Volmer (SV) equation:
| I0/I = KSV[Q] + 1 | (2) |
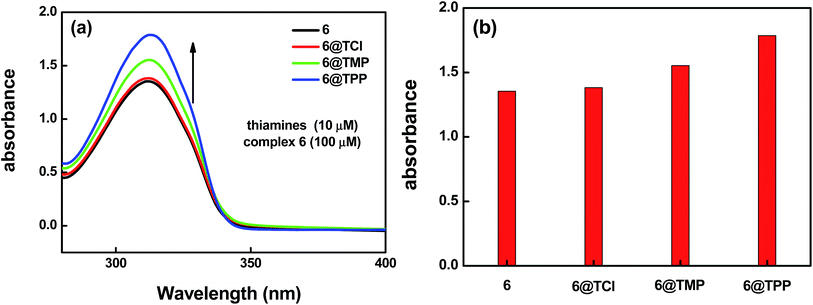
For an excellent probe, high selectivity is necessity. The selectivity of complex 6 as a probe for thiamine was evaluated further by examination of the UV absorption spectra. To investigate the selectivity to the three kinds of thiamines (TPP, TMP or TCl), the crystalline materials of complex 6 were ground into powder samples and added into aqueous solutions containing the three kinds of the thiamines (TPP, TMP, or TCl). The experiment details are listed as follows: a series of aqueous solutions of the thiamines@6 has been prepared by addition of the same molar quantity of the thiamine (10 μM) into aqueous solution containing the same molar quantity of complex 6 (100 μM). Fig. 5a shows the absorption band at 312 nm, assigned as the π* → n and π* → π transitions of the H2L ligand. We found that the thiamines have an effect on the absorption band intensity of complex 6, of which TPP > TMP > TCl. A corresponding bar diagram revealing the absorption intensity (monitored at 312 nm) is shown in Fig. 5b.
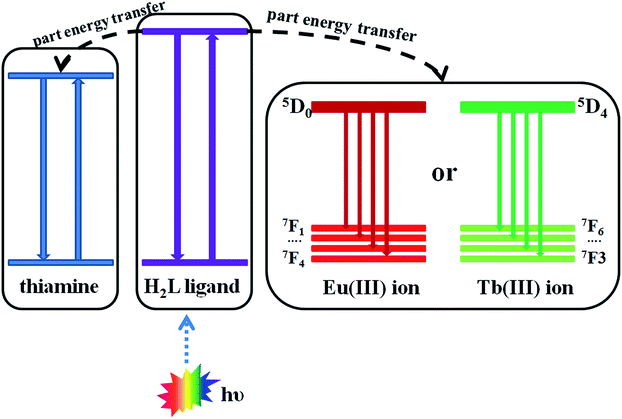
The result suggests that the complex 6 has good sensitivity and selectivity in detecting small amounts of thiamines in solution. This means that the electrostatic interaction between the H2L ligand (electron-rich) and the thiamines (contain positive charge) maybe a main cause of the luminescence quenching of complex 6. Based on the data of KSV, we found that the detecting ability of the complex 6 for the thiamines is TPP > TMP > TCl. This shows that the weak interaction between the pyrophosphate group of TPP (or phosphate group of TMP) and the NH group of the H2L ligand maybe a cause of the luminescence quenching of complex 6. The energy transfer processes is shown in Fig. 9. This shows the possibility of the absorption of the excitation light by the analyte, as well as the possibility of electron transfer from the excited state to the slightly lower excited state of the analyte.19 Combining with the UV absorption spectra and the excitation spectra of the liquid luminescence, there is a clear indication that there is strong molecular level interaction between the sensors and analytes, which ensures a close proximity of the sensor–analyte pair. This effect makes the complexes more promising towards the specific detection of the thiamines at the micromolar region. The luminescence explorations also reveal that complex 6 represents a typical example of functional luminescent metal–organic material Ln(III)-based probes for selectively detecting thiamines in water solution.
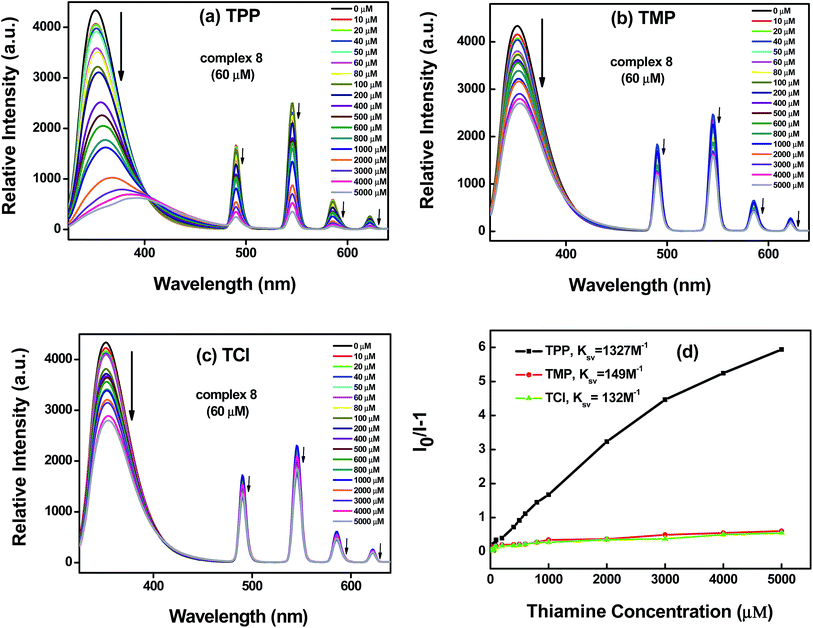
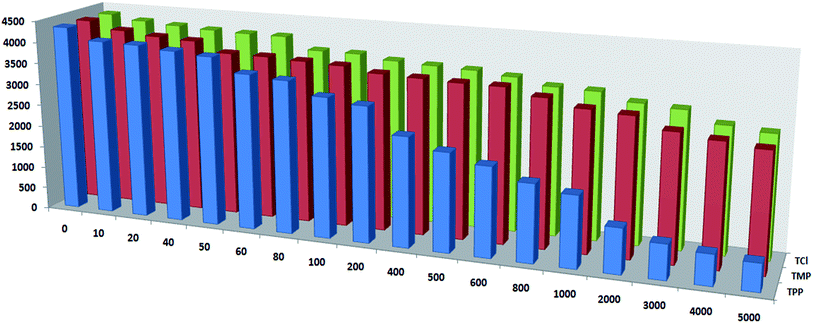
Compared with the luminescence spectrum of complex 8 in the solid state, the corresponding emission peak intensity and position in the solution were changed slightly. Based on the same method as above, we investigated the sensing ability of complex 8 as a thiamine sensing material. To further examine the sensing sensitivity of thiamines in more detail, a series of water solutions of complex 8 (at fixed concentration 60 μM) with the thiamines (at different concentrations 10–5000 μM) were prepared. Fig. 6a–c shows the emission band at higher energy (350 nm), generally observed due to π* → n and π* → π transitions of H2L ligand. The emission bands observed at 490, 545, 584 and 622 nm can be assigned to the 5D4 → 7F6, 5D4 → 7F5, 5D4 → 7F4 and 5D4 → 7F3 transitions of the characteristic emission of Tb(III) ions, respectively. The emission peak intensity decreased regularly with increasing concentration (up to 5000 μM) of the thiamines (TPP, TMP, TCl), which quenched nearly 86%, 38% and 35% of the initial luminescence intensity, respectively. The corresponding histogram indicates the luminescence intensity (monitored at 350 nm) after addition of the analytes (thiamines) and is shown in Fig. 7.
According to eqn (1), the detection limit of complex 8 is calculated to be 0.090 μM for TPP, 0.278 μM for TMP, and 0.263 μM for TCl. The lower detection limits indicate the feasibility and selectivity of complex 8 to detect biological molecule thiamines.
As shown in Fig. 6d, I0/I is linearly proportional to concentration of the thiamines, and the slope is the KSV. Based on eqn (2), the quenching constant (KSV) was 1327 M−1 for TPP, 149 M−1 for TMP, and 132 M−1 for TCl. For effective quenching reagents, quenching constant KSV ≈ 102 to 103 M−1. The KSV values revealed complex 8 is also one of the effective quenching reagents of TPP, TMP and TCl.
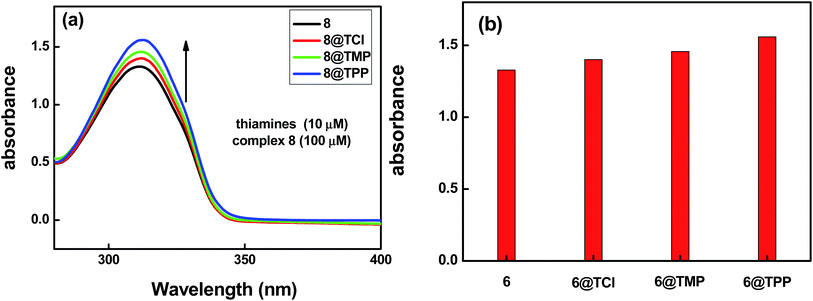
Based on the same method as above, the selectivity of complex 8 as a probe for detecting thiamines also was evaluated by further examination of the UV absorption spectra. For investigating the selectivity of the three kinds of thiamine (TPP, TMP or TCl), the crystalline materials of complex 8 were ground into powder samples and added into aqueous solutions containing the three kinds of thiamine (TPP, TMP, or TCl). The experiment details are listed as follows: a series of aqueous solutions of the thiamines@8 has been prepared by addition of the same molar quantity of the thiamines (10 μM) into aqueous solutions containing the same molar quantity of complex 8 (100 μM). Fig. 8a shows the absorption band at 312 nm, assigned as π* → n and π* → π transitions of the H2L ligand. We found that the thiamines also have an effect on the absorption band intensity of complex 8, of which TPP > TMP > TCl. The corresponding bar diagram revealing the absorption intensity (monitored at 312 nm) is shown in Fig. 8b.
The result suggests that complex 8 has response to TPP, TMP and TCl, this means that the electrostatic interaction between the H2L ligand (electron-rich) and the thiamines (containing positive charge) maybe a cause of the luminescence quenching of the complex 8. At the same time, we found that complex 8 is more suitable to detect small amounts of TPP in solution compared with TMP and TCl. This shows that the weak interaction between the pyrophosphate group of TPP and the NH group of the H2L ligand may be a main cause of the luminescence quenching of complex 8. The energy transfer processes are shown in Fig. 9. The characteristic emission peak intensity of Tb(III) ions also shows a trend of decreasing with increasing concentration of thiamines. It is found that the interaction between H2L ligands and the thiamines increases gradually with increasing the concentration of the thiamines, which leads to the luminescence quenching (the characteristic emission peaks of Tb(III) ions). In the meantime, it can be seen that the emission peak of the H2L ligand is slightly red shifted when increasing the concentration of TPP.
Conclusion
In summary, a novel series of lanthanide complexes Ln(L11)(EtOH)(NO3)3 (Ln = La (1), Ce (2), Pr (3), Nd (4), Sm (5), Eu (6), Gd (7), and Tb (8)) was synthesized using Ln(NO3)·6H2O and an N-heterocyclic ligand (H2L) under a solution synthesis method, heating in a pyrex flask. Complexes 6 and 8 display luminescence properties and selectivity and sensitivity to detect small biomolecules of thiamine. Complex 6 has good sensitivity in detecting small amounts of thiamines, mainly due to the weak interaction between H2L and the thiamines, which is a main cause that leads to the luminescence quenching of complex 6 (and the characteristic emission peak of H2L). Complex 8 is also suitable for the detection of small amounts of TPP compared with TCl or TMP, mainly because of the weak interaction between the pyrophosphate group of TPP (or the phosphate group of TMP) and the NH group of the H2L ligand, which maybe a main cause of the luminescence quenching (the characteristic emission peak of H2L). The results showed that complexes 6 and 8 may be used as potential candidate materials for detecting thiamines. The importance of the work for the liquid phase detection of the thiamine molecules is as follows: (i) the work, for the first time, demonstrates the potential of the use of a π/n-electron based activator supported by f-based metal–organic host for the detection of a pyrophosphate group (phosphate group); (ii) the weak interaction between the analytes and the materials in the solution phase has been suggested. In particular, the interaction between the pyrophosphate group (phosphate group) of the analyte and the ligand of the detector could be one of the important factors for luminescence detection.Acknowledgements
This work was supported by the grants of the National Natural Science Foundation of China (No. 21371086 and 21571091), and Commonwealth Research Foundation of Liaoning province in China (No. 2014003019), State Key Laboratory of Inorganic Synthesis and Preparative Chemistry, College of Chemistry, Jilin University, Changchun 130012, P. R. China (No. 2016-02) for financial assistance.References
- (a) M. Louloudi and N. Hadjiliadis, Coord. Chem. Rev., 1994, 135–136, 429 CrossRef; (b) A. A. Gallo and H. Z. Sable, J. Biol. Chem., 1976, 251, 2564 CAS.
- (a) N. H. Hu, K. Aoki, A. O. Adeyemo and G. N. Williams, Inorg. Chim. Acta, 2001, 325, 9 CrossRef CAS; (b) N. H. Hu, T. Tokuno and K. Aoki, Inorg. Chim. Acta, 1999, 295, 71 CrossRef CAS; (c) J. S. Casas, E. E. Castellano, M. D. Couce, J. Ellena, A. Sánchez, J. Sordo and C. Taboada, J. Inorg. Biochem., 2006, 100, 124 CrossRef CAS PubMed; (d) H. Doi, A. Mawatari, M. Kanazawa, S. Nozaki, Y. Nomura, T. Kitayoshi, K. Akimoto, M. Suzuki, S. Ninomiya and Y. Watanabe, J. Org. Chem., 2015, 80, 6250 CrossRef CAS PubMed; (e) N. H. Hu, T. Norifusa and K. Aoki, Polyhedron, 1999, 18, 2987 CrossRef CAS; (f) N. H. Hu, W. Liu and K. Aoki, Bull. Chem. Soc. Jpn., 2000, 73, 1043 CrossRef CAS.
- N. H. Hu, K. Aoki, A. O. Adeyemo and G. N. Williams, Inorg. Chim. Acta, 2002, 333, 63 CrossRef CAS.
- (a) J. Pletcher, M. Wood, G. Blank, W. Shin and M. Sax, Acta Crystallogr., Sect. B: Struct. Crystallogr. Cryst. Chem., 1977, 33, 3349 CrossRef; (b) G. Malandrinos, M. Louloudi, A. Koukkou, I. Sovago, C. Drainas and N. Hadjiliadis, J. Biol. Inorg. Chem., 2000, 5, 218 CrossRef CAS PubMed; (c) G. Malandrinos, M. Louloudi, C. A. Mitsopoulou, I. S. Butler, R. Bau and N. Hadjiliadis, J. Biol. Inorg. Chem., 1998, 3, 437 CrossRef CAS; (d) K. Aoki and H. Yamazaki, J. Am. Chem. Soc., 1980, 102, 6878 CrossRef CAS; (e) J. Pletcher and M. Sax, J. Am. Chem. Soc., 1972, 94, 3998 CrossRef CAS PubMed.
- (a) J. E. Kim, J. A. Bogart, P. J. Carroll and E. J. Schelter, Inorg. Chem., 2016, 55, 775 CrossRef CAS PubMed; (b) L. Wan, C. Zhang, Y. Xing, Z. Li, N. Xing, L. Wan and H. Shan, Inorg. Chem., 2012, 51, 6517 CrossRef CAS PubMed; (c) H. Zhao, N. Lopez, A. Prosvirin, H. T. Chifotides and K. R. Dunbar, Dalton Trans., 2007, 878 RSC.
- (a) R. K. Prabhakara, A. Thirumurugan and C. N. R. Rao, Chem.–Eur. J., 2007, 13, 3193 CrossRef PubMed; (b) A. Guha, K. S. Banu, S. Das, T. Chattopadhyay, R. Sanyal, E. Zangrando and D. Das, Polyhedron, 2013, 52, 669 CrossRef CAS; (c) M. A. Halcrow, Coord. Chem. Rev., 2005, 249, 2880 CrossRef CAS.
- (a) Y. Zhou and W. Chen, Dalton Trans., 2007, 44, 5123 RSC; (b) T. D. Roberts, F. Tuna, T. L. Malkin, C. A. Kilner and M. A. Halcrow, Chem. Sci., 2012, 3, 349 RSC; (c) E. Coronado, J. R. G. Mascarós and M. C. Giménez-López, Polyhedron, 2007, 26, 1838 CrossRef CAS; (d) E. Coronado, M. C. Gimenez-Lopez, C. Gimenez-Saiz and F. M. Romero, CrystEngComm, 2009, 11, 2198 RSC; (e) Y. Zhou, W. Chen and D. Wang, Dalton Trans., 2008, 11, 1444 RSC; (f) D. Plaul, E. Spielberg and W. Plass, Z. Anorg. Chem., 2010, 636, 1268 CrossRef CAS; (g) L. T. Ghoochany, S. Farsadpour, Y. Sun and W. R. Thiel, Ber. Dtsch. Chem. Ges., 2011, 2011, 3431 Search PubMed; (h) P. Wang, C. H. Leung, D. L. Ma, S. C. Yan and C. M. Che, Chem.–Eur. J., 2010, 16, 6900 CrossRef CAS PubMed; (i) A. X. Zheng, H. F. Wang, C. N. Lu, Z. G. Ren, H. X. Li and J. P. Lang, Dalton Trans., 2012, 41, 558 RSC.
- (a) Z. Hu, W. P. Lustig, J. Zhang, C. Zheng, H. Wang, S. J. Teat, Q. Gong, N. D. Rudd and J. Li, J. Am. Chem. Soc., 2015, 137, 16209 CrossRef CAS PubMed; (b) Y. Lei, D. Zha and E. V. Anslyn, Chem. Rev., 2015, 115 Search PubMed; (c) Z. Hu, B. J. Deibert and J. Li, Chem. Soc. Rev., 2014, 43, 5815 RSC.
- (a) R. Zimmerman, L. Basabe-Desmonts, F. V. D. Baan, D. N. Reinhoudt and M. Crego-Calama, J. Mater. Chem., 2005, 15, 2772 RSC; (b) C. Dai, D. Yang, W. Zhang, B. Bao, Y. Cheng and L. Wang, Polym. Chem., 2015, 6, 3962 RSC.
- W. Xu, Y. Zhou, D. Huang, M. Su, K. Wang and M. Hong, Inorg. Chem., 2014, 53, 6497 CrossRef CAS PubMed.
- G. M. Sheldrick, SADABS, Program for Empirical Absorption Correction for Area Detector Data, University of Götingen, Götingen, Germany, 1996 Search PubMed.
- G. M. Sheldrick, SHELXS 97, Program for Crystal Structure Refinement, University of Göttingen, Göttingen, Germany, 1997 Search PubMed.
- (a) S. A. Cotton, V. Franckevicius, M. F. Mahon, L. L. Ooi and P. R. Raithby, Polyhedron, 2006, 25, 1057 CrossRef CAS; (b) S. Michael, A. G. Oliver and K. N. Raymond, J. Am. Chem. Soc., 2007, 129, 11153 CrossRef PubMed; (c) T. J. Boyle, L. A. M. Ottley, S. D. Daniel-Taylor, L. J. Tribby, S. D. Bunge, A. L. Costello, T. M. Alam, J. C. Gordon and M. T. Mark, Inorg. Chem., 2007, 46, 3705 CrossRef CAS PubMed; (d) Y. N. Hou, X. T. Xu, N. Xing, F. Y. Bai, S. B. Duan, Q. Sun, S. Y. Wei, Z. Shi, H. Z. Zhang and Y. H. Xing, ChemPlusChem, 2014, 79, 1304 CrossRef CAS.
- F. S. Richardson, Chem. Rev., 1982, 82, 541–552 CrossRef CAS.
- S. Comby and J. C. G. Bünzli, Handb. Phys. Chem. Rare Earths, 2007, 37, 217 CAS.
- K. Su, F. Jiang, M. Wu, J. Qian, J. Pang, D. Yuan and M. Hong, CrystEngComm, 2016 10.1039/C6CE00092D.
- K. Su, F. Jiang, J. Qian, M. Wu, K. Xiong, Y. Gai and M. Hong, Inorg. Chem., 2013, 52, 3780 CrossRef CAS PubMed.
- M. D. Allendorf, C. A. Bauer, R. K. Bhakta and R. J. T. Houk, Chem. Soc. Rev., 2009, 38, 1330 RSC.
- D. K. Singha, S. Bhattacharya, P. Majee, S. K. Mondal, M. Kumara and P. Mahata, J. Mater. Chem. A, 2014, 2, 20908 CAS.
Footnote |
| † Electronic supplementary information (ESI) available: Figures of IR spectra, XRD analysis, thermal properties and lanthanide contraction. Tables of selected bond distances (Å) and angles (°), hydrogen bond lengths (Å) and angles (°), and IR data. Tables of atomic coordinates, an isotropic thermal parameter, and complete bond distances and angles. CCDC 1448209–1448216 for the complexes 1–8. For ESI and crystallographic data in CIF or other electronic format see DOI: 10.1039/c6ra10869e |
| This journal is © The Royal Society of Chemistry 2016 |

